Zip Codes with the Highest Percentage of Population Employed in Health Care & Social Assistance in Santa Rosa, CA
RELATED REPORTS & OPTIONS
Health Care & Social Assistance
Santa Rosa
Compare Zip Codes
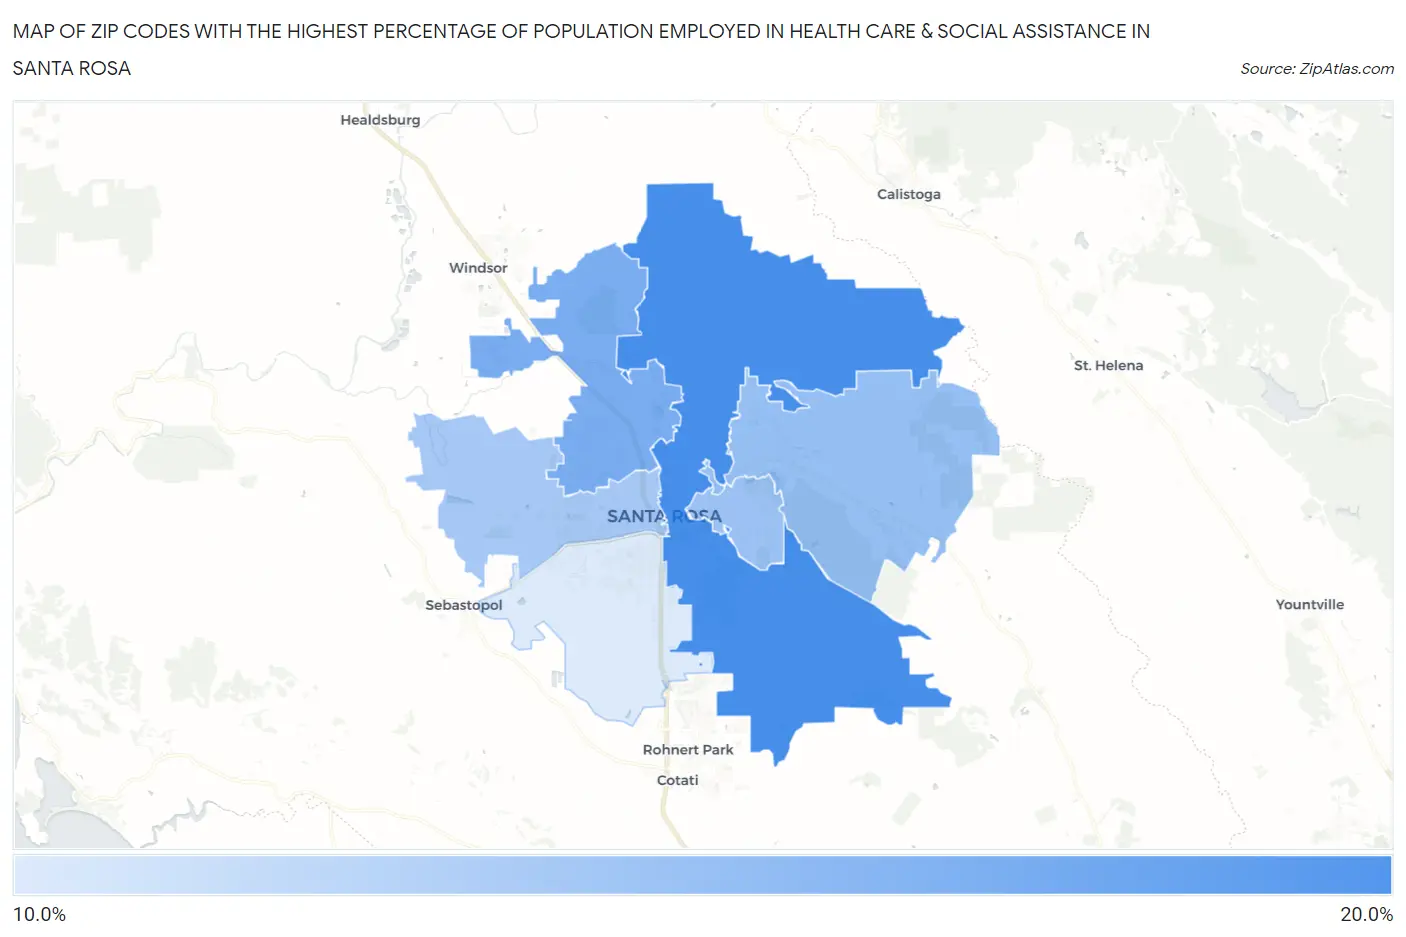
Map of Zip Codes with the Highest Percentage of Population Employed in Health Care & Social Assistance in Santa Rosa
12.2%
18.2%
Zip Codes with the Highest Percentage of Population Employed in Health Care & Social Assistance in Santa Rosa, CA
| Zip Code | % Employed | vs State | vs National | |
| 1. | 95404 | 18.2% | 12.7%(+5.43)#145 | 13.9%(+4.23)#5,985 |
| 2. | 95403 | 16.1% | 12.7%(+3.33)#270 | 13.9%(+2.14)#9,360 |
| 3. | 95409 | 15.0% | 12.7%(+2.28)#370 | 13.9%(+1.09)#11,572 |
| 4. | 95405 | 14.8% | 12.7%(+2.03)#396 | 13.9%(+0.836)#12,172 |
| 5. | 95401 | 14.4% | 12.7%(+1.62)#450 | 13.9%(+0.427)#13,185 |
| 6. | 95407 | 12.2% | 12.7%(-0.560)#819 | 13.9%(-1.76)#18,637 |
1
Common Questions
What are the Top 5 Zip Codes with the Highest Percentage of Population Employed in Health Care & Social Assistance in Santa Rosa, CA?
Top 5 Zip Codes with the Highest Percentage of Population Employed in Health Care & Social Assistance in Santa Rosa, CA are:
What zip code has the Highest Percentage of Population Employed in Health Care & Social Assistance in Santa Rosa, CA?
95404 has the Highest Percentage of Population Employed in Health Care & Social Assistance in Santa Rosa, CA with 18.2%.
What is the Percentage of Population Employed in Health Care & Social Assistance in Santa Rosa, CA?
Percentage of Population Employed in Health Care & Social Assistance in Santa Rosa is 15.4%.
What is the Percentage of Population Employed in Health Care & Social Assistance in California?
Percentage of Population Employed in Health Care & Social Assistance in California is 12.7%.
What is the Percentage of Population Employed in Health Care & Social Assistance in the United States?
Percentage of Population Employed in Health Care & Social Assistance in the United States is 13.9%.