Zip Codes with the Highest Percentage of Population Employed in Health Care & Social Assistance in Garden Grove, CA
RELATED REPORTS & OPTIONS
Health Care & Social Assistance
Garden Grove
Compare Zip Codes
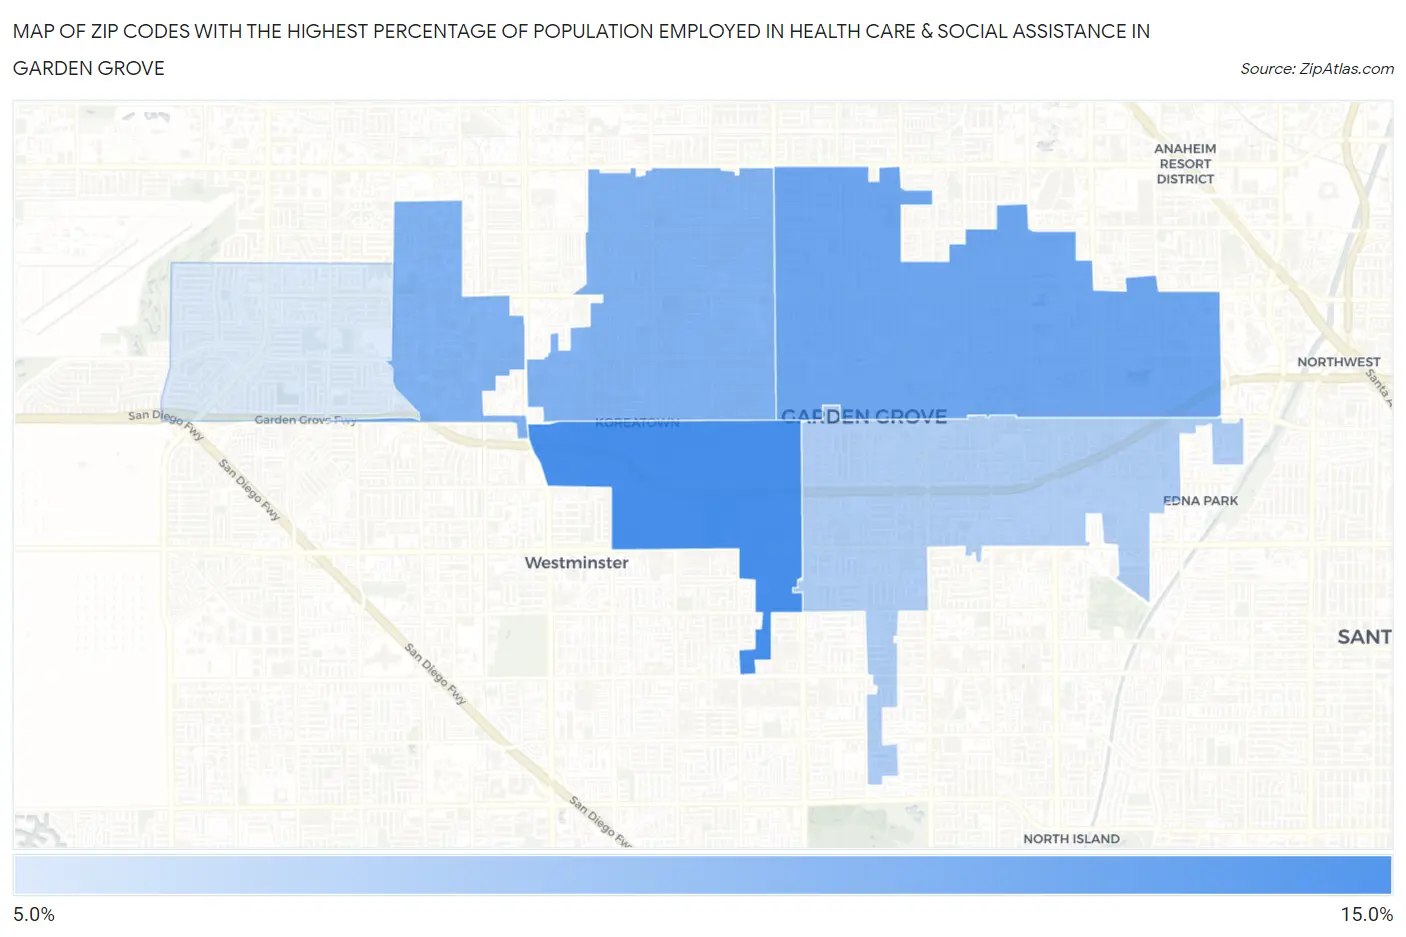
Map of Zip Codes with the Highest Percentage of Population Employed in Health Care & Social Assistance in Garden Grove
9.5%
12.5%
Zip Codes with the Highest Percentage of Population Employed in Health Care & Social Assistance in Garden Grove, CA
| Zip Code | % Employed | vs State | vs National | |
| 1. | 92844 | 12.5% | 12.7%(-0.216)#748 | 13.9%(-1.41)#17,786 |
| 2. | 92840 | 11.7% | 12.7%(-1.00)#906 | 13.9%(-2.20)#19,627 |
| 3. | 92841 | 11.4% | 12.7%(-1.38)#979 | 13.9%(-2.58)#20,557 |
| 4. | 92843 | 10.4% | 12.7%(-2.31)#1,121 | 13.9%(-3.50)#22,592 |
| 5. | 92845 | 9.5% | 12.7%(-3.21)#1,232 | 13.9%(-4.40)#24,303 |
1
Common Questions
What are the Top 3 Zip Codes with the Highest Percentage of Population Employed in Health Care & Social Assistance in Garden Grove, CA?
Top 3 Zip Codes with the Highest Percentage of Population Employed in Health Care & Social Assistance in Garden Grove, CA are:
What zip code has the Highest Percentage of Population Employed in Health Care & Social Assistance in Garden Grove, CA?
92844 has the Highest Percentage of Population Employed in Health Care & Social Assistance in Garden Grove, CA with 12.5%.
What is the Percentage of Population Employed in Health Care & Social Assistance in Garden Grove, CA?
Percentage of Population Employed in Health Care & Social Assistance in Garden Grove is 11.3%.
What is the Percentage of Population Employed in Health Care & Social Assistance in California?
Percentage of Population Employed in Health Care & Social Assistance in California is 12.7%.
What is the Percentage of Population Employed in Health Care & Social Assistance in the United States?
Percentage of Population Employed in Health Care & Social Assistance in the United States is 13.9%.