Cities with the Highest Percentage of Population Employed in Health Care & Social Assistance in Connecticut
RELATED REPORTS & OPTIONS
Health Care & Social Assistance
Connecticut
Compare Cities
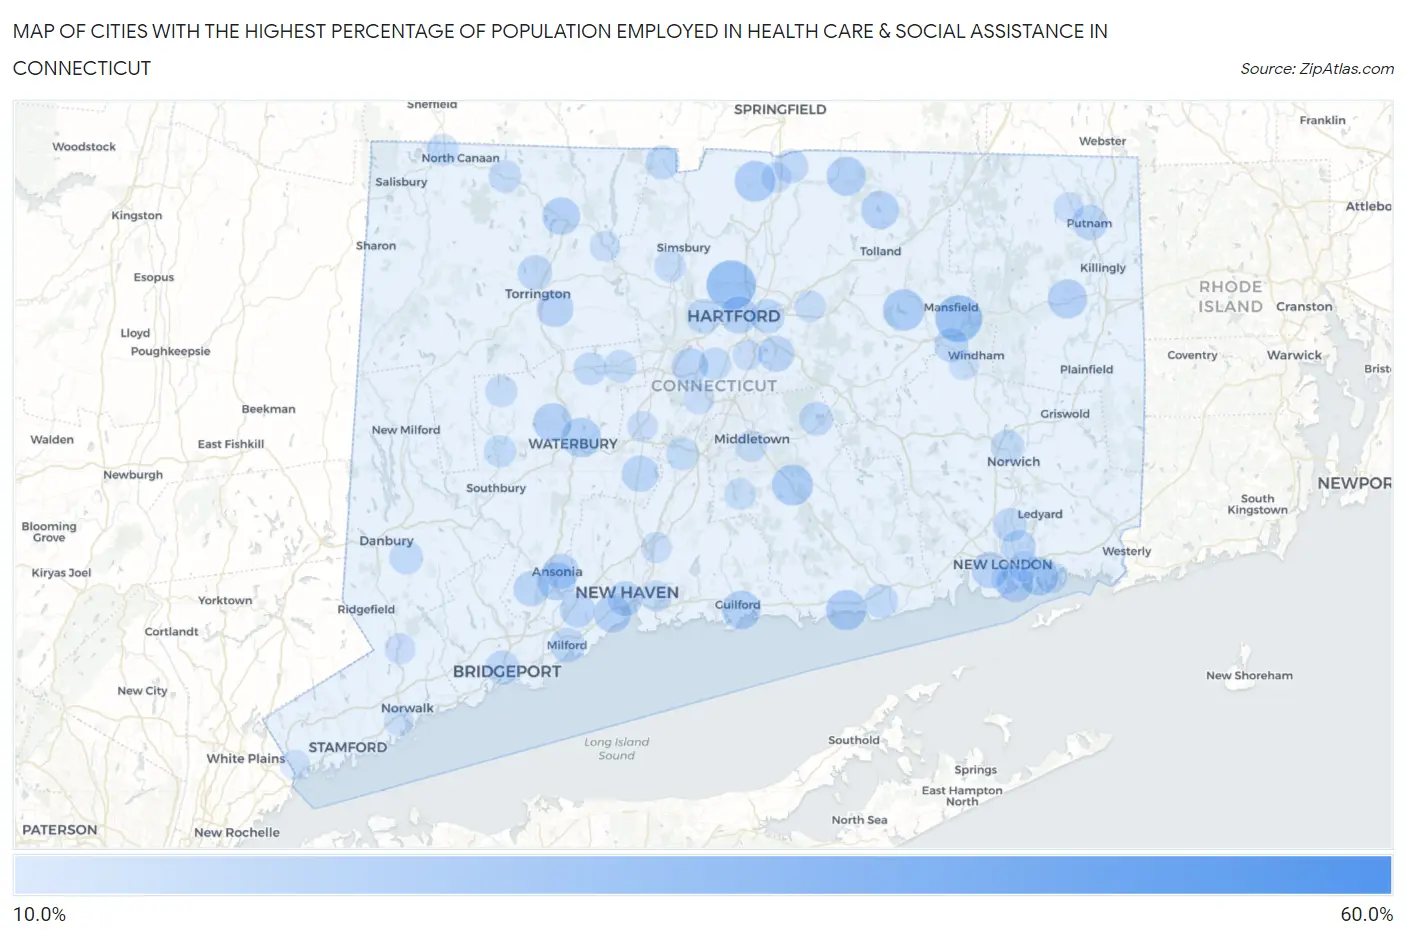
Map of Cities with the Highest Percentage of Population Employed in Health Care & Social Assistance in Connecticut
0.0%
60.0%
Cities with the Highest Percentage of Population Employed in Health Care & Social Assistance in Connecticut
| City | % Employed | vs State | vs National | |
| 1. | Branchville | 54.3% | 15.4%(+38.9)#1 | 13.9%(+40.4)#253 |
| 2. | Dodgingtown | 50.0% | 15.4%(+34.6)#2 | 13.9%(+36.1)#327 |
| 3. | Candlewood Lake Club | 39.3% | 15.4%(+23.9)#3 | 13.9%(+25.4)#618 |
| 4. | Plattsville | 35.4% | 15.4%(+19.9)#4 | 13.9%(+21.4)#852 |
| 5. | Bigelow Corners | 34.0% | 15.4%(+18.6)#5 | 13.9%(+20.0)#959 |
| 6. | Topstone | 33.8% | 15.4%(+18.4)#6 | 13.9%(+19.9)#976 |
| 7. | Blue Hills | 29.0% | 15.4%(+13.6)#7 | 13.9%(+15.0)#1,640 |
| 8. | Gaylordsville | 27.8% | 15.4%(+12.3)#8 | 13.9%(+13.8)#1,881 |
| 9. | Taylor Corners | 27.6% | 15.4%(+12.2)#9 | 13.9%(+13.7)#1,919 |
| 10. | Mansfield Center | 27.0% | 15.4%(+11.6)#10 | 13.9%(+13.1)#2,037 |
| 11. | Bridgewater | 26.4% | 15.4%(+11.0)#11 | 13.9%(+12.5)#2,201 |
| 12. | Hawleyville | 26.3% | 15.4%(+10.9)#12 | 13.9%(+12.4)#2,217 |
| 13. | Brookfield Center | 26.2% | 15.4%(+10.8)#13 | 13.9%(+12.3)#2,244 |
| 14. | Knollcrest | 24.2% | 15.4%(+8.79)#14 | 13.9%(+10.3)#2,905 |
| 15. | Route 7 Gateway | 23.9% | 15.4%(+8.51)#15 | 13.9%(+9.99)#3,011 |
| 16. | Fenwick Borough | 23.5% | 15.4%(+8.11)#16 | 13.9%(+9.59)#3,192 |
| 17. | South Coventry | 22.9% | 15.4%(+7.49)#17 | 13.9%(+8.97)#3,496 |
| 18. | Higganum | 22.4% | 15.4%(+7.01)#18 | 13.9%(+8.49)#3,706 |
| 19. | Suffield Depot | 22.3% | 15.4%(+6.86)#19 | 13.9%(+8.34)#3,776 |
| 20. | Westbrook Center | 22.0% | 15.4%(+6.55)#20 | 13.9%(+8.03)#3,950 |
| 21. | Waterbury | 21.5% | 15.4%(+6.04)#21 | 13.9%(+7.52)#4,276 |
| 22. | Mill Plain | 21.4% | 15.4%(+5.95)#22 | 13.9%(+7.43)#4,346 |
| 23. | Brooklyn | 21.2% | 15.4%(+5.76)#23 | 13.9%(+7.24)#4,495 |
| 24. | Somers | 21.0% | 15.4%(+5.55)#24 | 13.9%(+7.03)#4,658 |
| 25. | Guilford Center | 20.8% | 15.4%(+5.37)#25 | 13.9%(+6.85)#4,790 |
| 26. | Poquonock Bridge | 20.7% | 15.4%(+5.31)#26 | 13.9%(+6.79)#4,830 |
| 27. | Oakville | 20.7% | 15.4%(+5.30)#27 | 13.9%(+6.78)#4,838 |
| 28. | Ball Pond | 20.5% | 15.4%(+5.09)#28 | 13.9%(+6.57)#5,013 |
| 29. | Derby | 20.5% | 15.4%(+5.04)#29 | 13.9%(+6.52)#5,042 |
| 30. | Crystal Lake | 20.1% | 15.4%(+4.70)#30 | 13.9%(+6.19)#5,325 |
| 31. | Litchfield Borough | 20.1% | 15.4%(+4.64)#31 | 13.9%(+6.13)#5,368 |
| 32. | Winsted | 20.0% | 15.4%(+4.55)#32 | 13.9%(+6.03)#5,483 |
| 33. | West Haven | 19.9% | 15.4%(+4.47)#33 | 13.9%(+5.95)#5,544 |
| 34. | Hartford | 19.9% | 15.4%(+4.46)#34 | 13.9%(+5.94)#5,562 |
| 35. | Mechanicsville | 19.5% | 15.4%(+4.09)#35 | 13.9%(+5.57)#5,865 |
| 36. | Groton | 19.3% | 15.4%(+3.90)#36 | 13.9%(+5.38)#6,042 |
| 37. | Quasset Lake | 19.3% | 15.4%(+3.89)#37 | 13.9%(+5.37)#6,045 |
| 38. | Northwest Harwinton | 19.3% | 15.4%(+3.86)#38 | 13.9%(+5.34)#6,081 |
| 39. | Waterford | 19.2% | 15.4%(+3.83)#39 | 13.9%(+5.31)#6,098 |
| 40. | Indian Field | 19.2% | 15.4%(+3.80)#40 | 13.9%(+5.28)#6,139 |
| 41. | Cheshire Village | 19.1% | 15.4%(+3.71)#41 | 13.9%(+5.19)#6,218 |
| 42. | New Britain | 19.0% | 15.4%(+3.56)#42 | 13.9%(+5.04)#6,373 |
| 43. | Glastonbury Center | 18.9% | 15.4%(+3.45)#43 | 13.9%(+4.93)#6,487 |
| 44. | Ansonia | 18.3% | 15.4%(+2.85)#44 | 13.9%(+4.34)#7,105 |
| 45. | Putnam | 18.3% | 15.4%(+2.84)#45 | 13.9%(+4.33)#7,113 |
| 46. | Shelton | 18.2% | 15.4%(+2.80)#46 | 13.9%(+4.28)#7,166 |
| 47. | Orange | 17.9% | 15.4%(+2.51)#47 | 13.9%(+3.99)#7,538 |
| 48. | New Haven | 17.9% | 15.4%(+2.50)#48 | 13.9%(+3.98)#7,554 |
| 49. | Milford City Balance | 17.8% | 15.4%(+2.38)#49 | 13.9%(+3.86)#7,694 |
| 50. | Torrington | 17.7% | 15.4%(+2.30)#50 | 13.9%(+3.78)#7,797 |
| 51. | West Hartford | 17.7% | 15.4%(+2.25)#51 | 13.9%(+3.73)#7,854 |
| 52. | East Hartford | 17.6% | 15.4%(+2.23)#52 | 13.9%(+3.71)#7,914 |
| 53. | Stepney | 17.6% | 15.4%(+2.19)#53 | 13.9%(+3.67)#7,979 |
| 54. | Bridgeport | 17.5% | 15.4%(+2.08)#54 | 13.9%(+3.56)#8,105 |
| 55. | Conning Towers Nautilus Park | 17.5% | 15.4%(+2.06)#55 | 13.9%(+3.55)#8,118 |
| 56. | Willimantic | 17.4% | 15.4%(+1.94)#56 | 13.9%(+3.42)#8,284 |
| 57. | North Granby | 17.3% | 15.4%(+1.92)#57 | 13.9%(+3.40)#8,302 |
| 58. | Gales Ferry | 17.2% | 15.4%(+1.83)#58 | 13.9%(+3.31)#8,429 |
| 59. | Sherwood Manor | 17.2% | 15.4%(+1.78)#59 | 13.9%(+3.26)#8,500 |
| 60. | Lake Pocotopaug | 17.2% | 15.4%(+1.76)#60 | 13.9%(+3.24)#8,526 |
| 61. | Cornwall | 17.1% | 15.4%(+1.73)#61 | 13.9%(+3.21)#8,580 |
| 62. | Bethel | 17.0% | 15.4%(+1.58)#62 | 13.9%(+3.06)#8,760 |
| 63. | Old Saybrook Center | 17.0% | 15.4%(+1.58)#63 | 13.9%(+3.06)#8,767 |
| 64. | Norwich | 16.8% | 15.4%(+1.37)#64 | 13.9%(+2.85)#9,038 |
| 65. | East | 16.6% | 15.4%(+1.14)#65 | 13.9%(+2.62)#9,393 |
| 66. | Terryville | 16.5% | 15.4%(+1.10)#66 | 13.9%(+2.58)#9,434 |
| 67. | Meriden | 16.5% | 15.4%(+1.07)#67 | 13.9%(+2.55)#9,502 |
| 68. | Jewett City Borough | 16.3% | 15.4%(+0.848)#68 | 13.9%(+2.33)#9,797 |
| 69. | Norfolk | 16.2% | 15.4%(+0.823)#69 | 13.9%(+2.30)#9,834 |
| 70. | Bristol | 16.2% | 15.4%(+0.779)#70 | 13.9%(+2.26)#9,908 |
| 71. | Newington | 16.0% | 15.4%(+0.633)#71 | 13.9%(+2.11)#10,132 |
| 72. | Woodbury Center | 15.9% | 15.4%(+0.493)#72 | 13.9%(+1.97)#10,360 |
| 73. | Canaan | 15.9% | 15.4%(+0.475)#73 | 13.9%(+1.96)#10,396 |
| 74. | Bethlehem Village | 15.8% | 15.4%(+0.377)#74 | 13.9%(+1.86)#10,526 |
| 75. | Murray | 15.5% | 15.4%(+0.095)#75 | 13.9%(+1.58)#11,006 |
| 76. | Noank | 15.4% | 15.4%(-0.008)#76 | 13.9%(+1.47)#11,165 |
| 77. | Manchester | 15.4% | 15.4%(-0.030)#77 | 13.9%(+1.45)#11,202 |
| 78. | Weatogue | 15.4% | 15.4%(-0.037)#78 | 13.9%(+1.44)#11,241 |
| 79. | Middletown | 15.3% | 15.4%(-0.070)#79 | 13.9%(+1.41)#11,277 |
| 80. | Durham | 15.2% | 15.4%(-0.202)#80 | 13.9%(+1.28)#11,496 |
| 81. | East Haven | 15.2% | 15.4%(-0.230)#81 | 13.9%(+1.25)#11,536 |
| 82. | Danielson Borough | 15.2% | 15.4%(-0.238)#82 | 13.9%(+1.24)#11,546 |
| 83. | Kensington | 15.1% | 15.4%(-0.348)#83 | 13.9%(+1.13)#11,752 |
| 84. | Woodmont Borough | 15.0% | 15.4%(-0.385)#84 | 13.9%(+1.10)#11,820 |
| 85. | Cannondale | 15.0% | 15.4%(-0.443)#85 | 13.9%(+1.04)#11,924 |
| 86. | North Haven | 14.9% | 15.4%(-0.558)#86 | 13.9%(+0.923)#12,108 |
| 87. | Stratford Downtown | 14.9% | 15.4%(-0.561)#87 | 13.9%(+0.919)#12,113 |
| 88. | New London | 14.8% | 15.4%(-0.610)#88 | 13.9%(+0.871)#12,224 |
| 89. | New Hartford Center | 14.8% | 15.4%(-0.640)#89 | 13.9%(+0.841)#12,276 |
| 90. | Bantam Borough | 14.7% | 15.4%(-0.677)#90 | 13.9%(+0.804)#12,340 |
| 91. | Long Hill | 14.7% | 15.4%(-0.705)#91 | 13.9%(+0.776)#12,379 |
| 92. | Plantsville | 14.6% | 15.4%(-0.810)#92 | 13.9%(+0.671)#12,589 |
| 93. | Northford | 14.6% | 15.4%(-0.847)#93 | 13.9%(+0.634)#12,676 |
| 94. | Thompsonville | 14.6% | 15.4%(-0.865)#94 | 13.9%(+0.616)#12,715 |
| 95. | South Woodstock | 14.5% | 15.4%(-0.912)#95 | 13.9%(+0.569)#12,811 |
| 96. | Wethersfield | 14.5% | 15.4%(-0.915)#96 | 13.9%(+0.566)#12,813 |
| 97. | Naugatuck Borough | 14.4% | 15.4%(-0.983)#97 | 13.9%(+0.498)#12,930 |
| 98. | South Windham | 14.4% | 15.4%(-1.04)#98 | 13.9%(+0.438)#13,040 |
| 99. | Pemberwick | 14.4% | 15.4%(-1.06)#99 | 13.9%(+0.419)#13,069 |
| 100. | Norwalk | 14.1% | 15.4%(-1.27)#100 | 13.9%(+0.206)#13,495 |
Common Questions
What are the Top 10 Cities with the Highest Percentage of Population Employed in Health Care & Social Assistance in Connecticut?
Top 10 Cities with the Highest Percentage of Population Employed in Health Care & Social Assistance in Connecticut are:
#1
29.0%
#2
27.0%
#3
22.9%
#4
22.4%
#5
22.3%
#6
22.0%
#7
21.5%
#8
21.2%
#9
21.0%
#10
20.8%
What city has the Highest Percentage of Population Employed in Health Care & Social Assistance in Connecticut?
Blue Hills has the Highest Percentage of Population Employed in Health Care & Social Assistance in Connecticut with 29.0%.
What is the Percentage of Population Employed in Health Care & Social Assistance in the State of Connecticut?
Percentage of Population Employed in Health Care & Social Assistance in Connecticut is 15.4%.
What is the Percentage of Population Employed in Health Care & Social Assistance in the United States?
Percentage of Population Employed in Health Care & Social Assistance in the United States is 13.9%.