Cities with the Lowest Percentage of Owner-Occupied Units in Kansas
RELATED REPORTS & OPTIONS
Lowest Owner-Occupied
Kansas
Compare Cities
Map of Cities with the Lowest Percentage of Owner-Occupied Units in Kansas
80.0%
0.0%
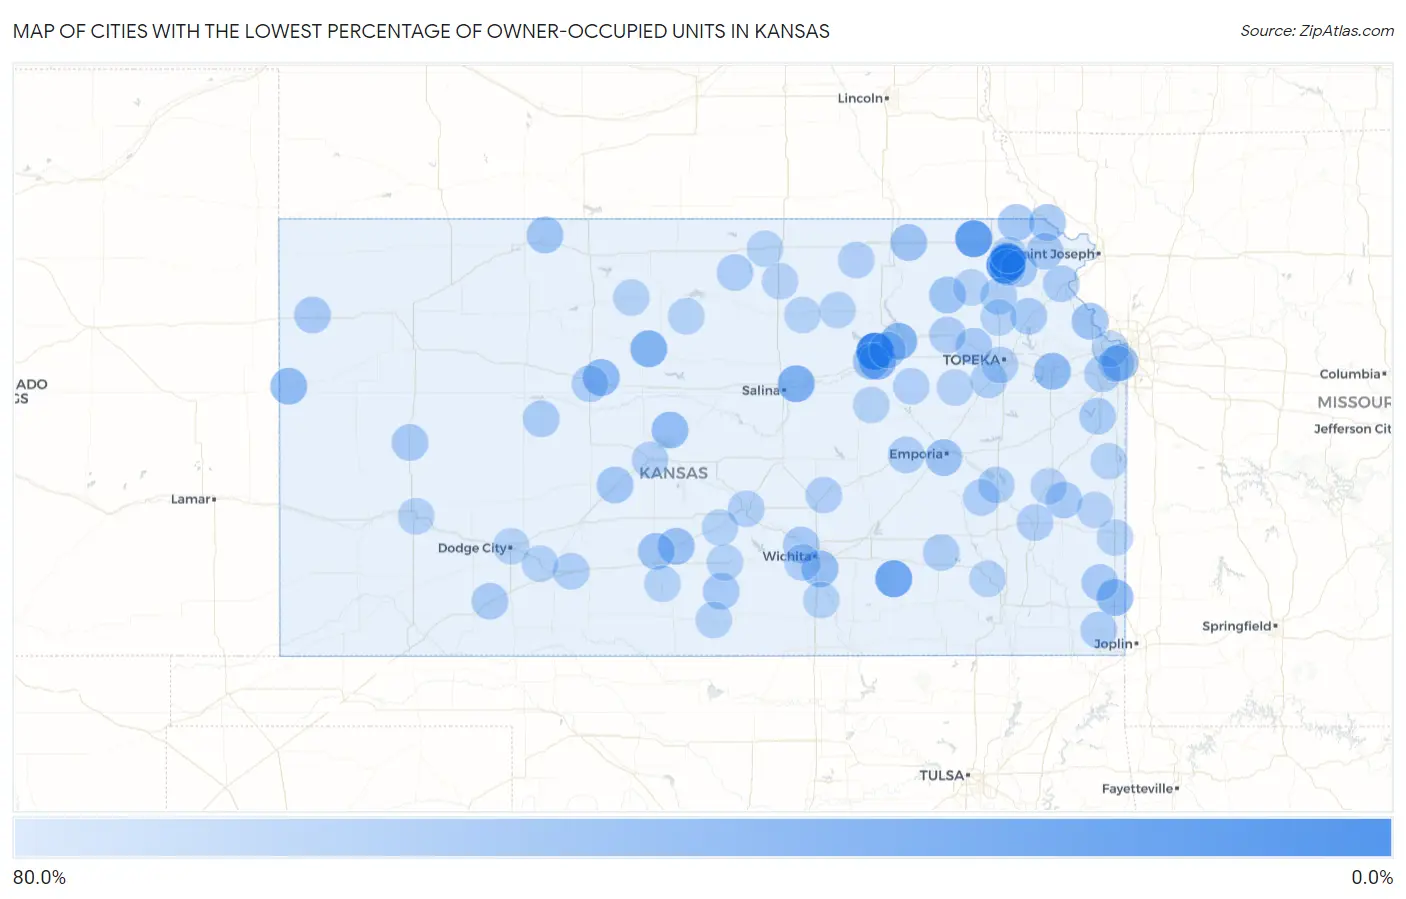
Cities with the Lowest Percentage of Owner-Occupied Units in Kansas
| City | % Owner-Occupied | vs State | vs National | |
| 1. | Fort Riley | 1.9% | 66.9% (-65.0)#1 | 64.8% (-62.9)#35 |
| 2. | Kickapoo Site 7 | 10.0% | 66.9% (-56.9)#2 | 64.8% (-54.8)#98 |
| 3. | Codell | 18.2% | 66.9% (-48.7)#3 | 64.8% (-46.6)#180 |
| 4. | Ludell | 20.0% | 66.9% (-46.9)#4 | 64.8% (-44.8)#215 |
| 5. | Oneida | 22.0% | 66.9% (-44.9)#5 | 64.8% (-42.8)#252 |
| 6. | Kickapoo Site 1 | 22.2% | 66.9% (-44.6)#6 | 64.8% (-42.6)#258 |
| 7. | Kickapoo Site 2 | 25.0% | 66.9% (-41.9)#7 | 64.8% (-39.8)#317 |
| 8. | Latham | 28.8% | 66.9% (-38.1)#8 | 64.8% (-36.0)#430 |
| 9. | New Cambria | 35.2% | 66.9% (-31.6)#9 | 64.8% (-29.6)#729 |
| 10. | Grandview Plaza | 38.1% | 66.9% (-28.8)#10 | 64.8% (-26.7)#957 |
| 11. | Waldo | 38.5% | 66.9% (-28.4)#11 | 64.8% (-26.4)#1,000 |
| 12. | Crestline | 39.1% | 66.9% (-27.7)#12 | 64.8% (-25.7)#1,056 |
| 13. | Manhattan | 40.0% | 66.9% (-26.8)#13 | 64.8% (-24.8)#1,148 |
| 14. | Catharine | 43.0% | 66.9% (-23.8)#14 | 64.8% (-21.8)#1,497 |
| 15. | Lawrence | 43.7% | 66.9% (-23.1)#15 | 64.8% (-21.1)#1,595 |
| 16. | Weskan | 44.4% | 66.9% (-22.4)#16 | 64.8% (-20.4)#1,706 |
| 17. | Pittsburg | 44.5% | 66.9% (-22.4)#17 | 64.8% (-20.3)#1,718 |
| 18. | Odin | 45.5% | 66.9% (-21.4)#18 | 64.8% (-19.4)#1,874 |
| 19. | St. Marks | 46.4% | 66.9% (-20.4)#19 | 64.8% (-18.4)#2,025 |
| 20. | Niles | 46.7% | 66.9% (-20.2)#20 | 64.8% (-18.1)#2,074 |
| 21. | Oaklawn Sunview | 47.1% | 66.9% (-19.7)#21 | 64.8% (-17.7)#2,178 |
| 22. | Mission | 47.5% | 66.9% (-19.4)#22 | 64.8% (-17.3)#2,241 |
| 23. | Monument | 48.0% | 66.9% (-18.9)#23 | 64.8% (-16.8)#2,360 |
| 24. | Preston | 48.1% | 66.9% (-18.7)#24 | 64.8% (-16.7)#2,384 |
| 25. | Keats | 49.3% | 66.9% (-17.6)#25 | 64.8% (-15.5)#2,685 |
| 26. | Junction City | 49.7% | 66.9% (-17.2)#26 | 64.8% (-15.1)#2,783 |
| 27. | Emporia | 50.0% | 66.9% (-16.9)#27 | 64.8% (-14.8)#2,843 |
| 28. | Home | 50.0% | 66.9% (-16.9)#28 | 64.8% (-14.8)#2,891 |
| 29. | Lafontaine | 50.0% | 66.9% (-16.9)#29 | 64.8% (-14.8)#2,904 |
| 30. | Leavenworth | 50.0% | 66.9% (-16.8)#30 | 64.8% (-14.8)#2,921 |
| 31. | Iuka | 50.4% | 66.9% (-16.4)#31 | 64.8% (-14.4)#2,993 |
| 32. | White Cloud | 51.1% | 66.9% (-15.7)#32 | 64.8% (-13.7)#3,174 |
| 33. | Almena | 51.5% | 66.9% (-15.3)#33 | 64.8% (-13.3)#3,308 |
| 34. | Onaga | 52.0% | 66.9% (-14.9)#34 | 64.8% (-12.8)#3,436 |
| 35. | Larned | 52.6% | 66.9% (-14.2)#35 | 64.8% (-12.2)#3,651 |
| 36. | Reserve | 53.3% | 66.9% (-13.5)#36 | 64.8% (-11.5)#3,898 |
| 37. | Williamstown | 53.6% | 66.9% (-13.3)#37 | 64.8% (-11.2)#3,963 |
| 38. | Ogden | 54.0% | 66.9% (-12.8)#38 | 64.8% (-10.8)#4,115 |
| 39. | Horton | 54.4% | 66.9% (-12.4)#39 | 64.8% (-10.4)#4,239 |
| 40. | Leona | 54.5% | 66.9% (-12.3)#40 | 64.8% (-10.3)#4,290 |
| 41. | Girard | 54.9% | 66.9% (-12.0)#41 | 64.8% (-9.95)#4,408 |
| 42. | Navarre | 54.9% | 66.9% (-11.9)#42 | 64.8% (-9.91)#4,421 |
| 43. | Spivey | 55.2% | 66.9% (-11.7)#43 | 64.8% (-9.64)#4,520 |
| 44. | Kincaid | 55.3% | 66.9% (-11.6)#44 | 64.8% (-9.55)#4,546 |
| 45. | Rossville | 55.3% | 66.9% (-11.5)#45 | 64.8% (-9.50)#4,569 |
| 46. | Maize | 55.3% | 66.9% (-11.5)#46 | 64.8% (-9.48)#4,580 |
| 47. | Scott City | 55.4% | 66.9% (-11.5)#47 | 64.8% (-9.44)#4,591 |
| 48. | Goodland | 55.5% | 66.9% (-11.3)#48 | 64.8% (-9.30)#4,632 |
| 49. | Brownell | 55.6% | 66.9% (-11.3)#49 | 64.8% (-9.26)#4,664 |
| 50. | Hillsdale | 55.8% | 66.9% (-11.1)#50 | 64.8% (-9.03)#4,754 |
| 51. | Valley Falls | 56.0% | 66.9% (-10.8)#51 | 64.8% (-8.78)#4,831 |
| 52. | Fowler | 56.0% | 66.9% (-10.8)#52 | 64.8% (-8.78)#4,833 |
| 53. | Holton | 56.5% | 66.9% (-10.3)#53 | 64.8% (-8.28)#5,053 |
| 54. | Belvue | 56.6% | 66.9% (-10.2)#54 | 64.8% (-8.21)#5,078 |
| 55. | Strong City | 56.7% | 66.9% (-10.2)#55 | 64.8% (-8.13)#5,103 |
| 56. | Auburn | 56.7% | 66.9% (-10.1)#56 | 64.8% (-8.08)#5,124 |
| 57. | Columbus | 56.8% | 66.9% (-10.1)#57 | 64.8% (-8.05)#5,133 |
| 58. | Randall | 57.1% | 66.9% (-9.71)#58 | 64.8% (-7.67)#5,284 |
| 59. | Climax | 57.1% | 66.9% (-9.71)#59 | 64.8% (-7.67)#5,298 |
| 60. | Hays | 57.1% | 66.9% (-9.70)#60 | 64.8% (-7.67)#5,301 |
| 61. | Lenexa | 57.2% | 66.9% (-9.61)#61 | 64.8% (-7.58)#5,333 |
| 62. | Atchison | 57.4% | 66.9% (-9.49)#62 | 64.8% (-7.45)#5,387 |
| 63. | Gridley | 57.6% | 66.9% (-9.22)#63 | 64.8% (-7.18)#5,493 |
| 64. | Mullinville | 58.2% | 66.9% (-8.64)#64 | 64.8% (-6.61)#5,744 |
| 65. | Burlington | 58.2% | 66.9% (-8.63)#65 | 64.8% (-6.60)#5,749 |
| 66. | Wichita | 58.5% | 66.9% (-8.38)#66 | 64.8% (-6.35)#5,842 |
| 67. | Iola | 58.8% | 66.9% (-8.08)#67 | 64.8% (-6.05)#5,983 |
| 68. | Alta Vista | 58.8% | 66.9% (-8.03)#68 | 64.8% (-5.99)#6,000 |
| 69. | Greenleaf | 58.9% | 66.9% (-7.94)#69 | 64.8% (-5.90)#6,046 |
| 70. | Topeka | 59.0% | 66.9% (-7.82)#70 | 64.8% (-5.79)#6,090 |
| 71. | South Hutchinson | 59.2% | 66.9% (-7.60)#71 | 64.8% (-5.57)#6,179 |
| 72. | Great Bend | 59.3% | 66.9% (-7.54)#72 | 64.8% (-5.51)#6,211 |
| 73. | Walton | 59.4% | 66.9% (-7.45)#73 | 64.8% (-5.41)#6,259 |
| 74. | Attica | 59.5% | 66.9% (-7.38)#74 | 64.8% (-5.35)#6,301 |
| 75. | Kansas City | 59.5% | 66.9% (-7.38)#75 | 64.8% (-5.34)#6,303 |
| 76. | Dodge City | 59.6% | 66.9% (-7.26)#76 | 64.8% (-5.23)#6,367 |
| 77. | Clay Center | 59.7% | 66.9% (-7.15)#77 | 64.8% (-5.11)#6,419 |
| 78. | Merriam | 59.7% | 66.9% (-7.13)#78 | 64.8% (-5.10)#6,425 |
| 79. | Fredonia | 59.7% | 66.9% (-7.11)#79 | 64.8% (-5.07)#6,430 |
| 80. | Garden City | 59.8% | 66.9% (-7.03)#80 | 64.8% (-5.00)#6,471 |
| 81. | Tipton | 59.8% | 66.9% (-7.02)#81 | 64.8% (-4.99)#6,478 |
| 82. | Arlington | 60.0% | 66.9% (-6.85)#82 | 64.8% (-4.82)#6,547 |
| 83. | Kickapoo Tribal Center | 60.0% | 66.9% (-6.85)#83 | 64.8% (-4.82)#6,557 |
| 84. | Alton | 60.0% | 66.9% (-6.85)#84 | 64.8% (-4.82)#6,559 |
| 85. | Sawyer | 60.0% | 66.9% (-6.85)#85 | 64.8% (-4.82)#6,560 |
| 86. | Powhattan | 60.0% | 66.9% (-6.85)#86 | 64.8% (-4.82)#6,562 |
| 87. | Latimer | 60.0% | 66.9% (-6.85)#87 | 64.8% (-4.82)#6,577 |
| 88. | Miltonvale | 60.1% | 66.9% (-6.73)#88 | 64.8% (-4.69)#6,622 |
| 89. | Kingman | 60.2% | 66.9% (-6.65)#89 | 64.8% (-4.61)#6,665 |
| 90. | Ford | 60.2% | 66.9% (-6.64)#90 | 64.8% (-4.60)#6,675 |
| 91. | La Cygne | 60.2% | 66.9% (-6.63)#91 | 64.8% (-4.60)#6,677 |
| 92. | Scandia | 60.3% | 66.9% (-6.52)#92 | 64.8% (-4.48)#6,728 |
| 93. | Fort Scott | 60.4% | 66.9% (-6.48)#93 | 64.8% (-4.44)#6,750 |
| 94. | Belle Plaine | 60.4% | 66.9% (-6.44)#94 | 64.8% (-4.41)#6,765 |
| 95. | Mayetta | 60.4% | 66.9% (-6.43)#95 | 64.8% (-4.40)#6,770 |
| 96. | Welda | 60.7% | 66.9% (-6.18)#96 | 64.8% (-4.14)#6,892 |
| 97. | Concordia | 60.8% | 66.9% (-6.08)#97 | 64.8% (-4.05)#6,932 |
| 98. | Soldier | 60.9% | 66.9% (-5.98)#98 | 64.8% (-3.95)#6,974 |
| 99. | Eskridge | 60.9% | 66.9% (-5.93)#99 | 64.8% (-3.90)#7,000 |
| 100. | Mapleton | 60.9% | 66.9% (-5.91)#100 | 64.8% (-3.88)#7,010 |
Common Questions
What are the Top 10 Cities with the Lowest Percentage of Owner-Occupied Units in Kansas?
Top 10 Cities with the Lowest Percentage of Owner-Occupied Units in Kansas are:
#1
1.9%
#2
10.0%
#3
22.0%
#4
22.2%
#5
25.0%
#6
28.8%
#7
35.2%
#8
38.1%
#9
38.5%
#10
40.0%
What city has the Lowest Percentage of Owner-Occupied Units in Kansas?
Fort Riley has the Lowest Percentage of Owner-Occupied Units in Kansas with 1.9%.
What is the Percentage of Owner-Occupied Units in the State of Kansas?
Percentage of Owner-Occupied Units in Kansas is 66.9%.
What is the Percentage of Owner-Occupied Units in the United States?
Percentage of Owner-Occupied Units in the United States is 64.8%.