Cities with the Lowest Percentage of Owner-Occupied Units in the United States
RELATED REPORTS & OPTIONS
Lowest Owner-Occupied
United States
Compare Cities
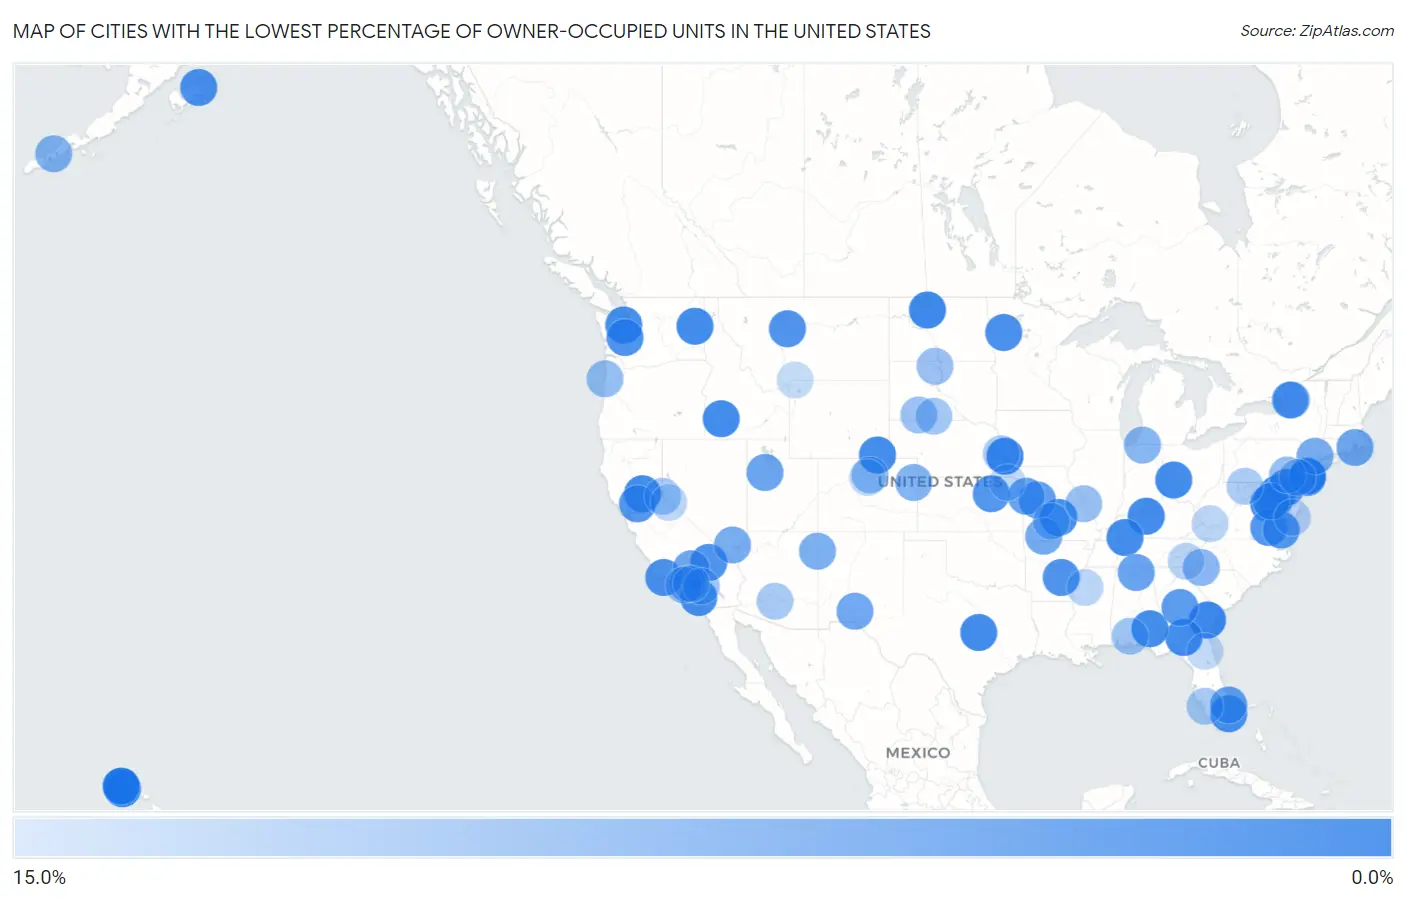
Map of Cities with the Lowest Percentage of Owner-Occupied Units in the United States
15.0%
0.0%
Cities with the Lowest Percentage of Owner-Occupied Units in the United States
| City | % Owner-Occupied | vs State | vs National | |
| 1. | Fort Stewart | 0.17% | 65.0%(-64.8)#1 | 64.8%(-64.6)#1 |
| 2. | Fort Dix | 0.22% | 63.9%(-63.6)#1 | 64.8%(-64.6)#2 |
| 3. | Schofield Barracks | 0.24% | 61.8%(-61.5)#1 | 64.8%(-64.6)#3 |
| 4. | Fort Meade | 0.24% | 67.5%(-67.2)#1 | 64.8%(-64.6)#4 |
| 5. | Hickam Housing | 0.28% | 61.8%(-61.5)#2 | 64.8%(-64.5)#5 |
| 6. | Minot Afb | 0.31% | 63.2%(-62.9)#1 | 64.8%(-64.5)#6 |
| 7. | Wheeler Afb | 0.50% | 61.8%(-61.3)#3 | 64.8%(-64.3)#7 |
| 8. | Offutt Afb | 0.56% | 66.5%(-66.0)#1 | 64.8%(-64.3)#8 |
| 9. | Fairchild Afb | 0.64% | 63.8%(-63.1)#1 | 64.8%(-64.2)#9 |
| 10. | Fort Knox | 0.66% | 68.1%(-67.5)#1 | 64.8%(-64.2)#10 |
| 11. | Fort Hood | 0.67% | 62.4%(-61.7)#1 | 64.8%(-64.1)#11 |
| 12. | Mountain Home Afb | 0.70% | 72.0%(-71.3)#1 | 64.8%(-64.1)#12 |
| 13. | Wright Patterson Afb | 0.73% | 66.8%(-66.1)#1 | 64.8%(-64.1)#13 |
| 14. | Remerton | 0.74% | 65.0%(-64.3)#2 | 64.8%(-64.1)#14 |
| 15. | Warren Afb | 0.78% | 71.9%(-71.1)#1 | 64.8%(-64.0)#15 |
| 16. | Beale Afb | 0.79% | 55.6%(-54.8)#1 | 64.8%(-64.0)#16 |
| 17. | Fort Campbell North | 0.79% | 68.1%(-67.3)#2 | 64.8%(-64.0)#17 |
| 18. | Fort Rucker | 0.82% | 69.7%(-68.9)#1 | 64.8%(-64.0)#18 |
| 19. | Quantico Base | 0.91% | 66.9%(-65.9)#1 | 64.8%(-63.9)#19 |
| 20. | Bangor Base | 1.0% | 63.8%(-62.8)#2 | 64.8%(-63.8)#20 |
| 21. | Andrews Afb | 1.0% | 67.5%(-66.4)#2 | 64.8%(-63.8)#21 |
| 22. | Camp Pendleton South | 1.1% | 55.6%(-54.6)#2 | 64.8%(-63.8)#22 |
| 23. | Kaneohe Base | 1.1% | 61.8%(-60.7)#4 | 64.8%(-63.7)#23 |
| 24. | Franklin Park | 1.1% | 66.9%(-65.7)#1 | 64.8%(-63.7)#24 |
| 25. | Kodiak Station | 1.1% | 66.3%(-65.1)#1 | 64.8%(-63.7)#25 |
| 26. | Fort Leonard Wood | 1.2% | 67.6%(-66.4)#1 | 64.8%(-63.6)#26 |
| 27. | Riverland | 1.3% | 72.3%(-71.1)#1 | 64.8%(-63.6)#27 |
| 28. | Aberdeen Proving Ground | 1.3% | 67.5%(-66.2)#3 | 64.8%(-63.5)#28 |
| 29. | Isla Vista | 1.4% | 55.6%(-54.2)#3 | 64.8%(-63.4)#29 |
| 30. | Fort Lewis | 1.4% | 63.8%(-62.4)#3 | 64.8%(-63.4)#30 |
| 31. | Malmstrom Afb | 1.5% | 69.0%(-67.6)#1 | 64.8%(-63.4)#31 |
| 32. | Fort Irwin | 1.5% | 55.6%(-54.2)#4 | 64.8%(-63.3)#32 |
| 33. | Sherrill | 1.6% | 66.2%(-64.7)#1 | 64.8%(-63.3)#33 |
| 34. | Williams Acres | 1.8% | 68.7%(-66.9)#1 | 64.8%(-63.0)#34 |
| 35. | Fort Riley | 1.9% | 66.9%(-65.0)#1 | 64.8%(-62.9)#35 |
| 36. | Mcguire Afb | 1.9% | 63.9%(-62.0)#2 | 64.8%(-62.9)#36 |
| 37. | Fort Lee | 2.0% | 66.9%(-64.9)#2 | 64.8%(-62.8)#37 |
| 38. | University Of California Davis | 2.0% | 55.6%(-53.6)#5 | 64.8%(-62.8)#38 |
| 39. | Bethel Manor | 2.1% | 66.9%(-64.7)#3 | 64.8%(-62.7)#39 |
| 40. | Fort Belvoir | 2.3% | 66.9%(-64.6)#4 | 64.8%(-62.6)#40 |
| 41. | Robins Afb | 2.5% | 65.0%(-62.5)#3 | 64.8%(-62.3)#41 |
| 42. | Petaluma Center | 2.5% | 55.6%(-53.1)#6 | 64.8%(-62.3)#42 |
| 43. | Fort Drum | 2.8% | 54.3%(-51.5)#1 | 64.8%(-62.0)#43 |
| 44. | Whiteman Afb | 2.8% | 67.6%(-64.8)#2 | 64.8%(-62.0)#44 |
| 45. | Unity Village | 3.1% | 67.6%(-64.5)#3 | 64.8%(-61.7)#45 |
| 46. | Stacey Street | 3.1% | 66.9%(-63.7)#2 | 64.8%(-61.7)#46 |
| 47. | Kirtland Afb | 3.4% | 68.7%(-65.2)#2 | 64.8%(-61.4)#47 |
| 48. | Redstone Arsenal | 3.5% | 69.7%(-66.2)#2 | 64.8%(-61.3)#48 |
| 49. | Dugway | 3.8% | 70.7%(-67.0)#1 | 64.8%(-61.1)#49 |
| 50. | Edwards Afb | 3.9% | 55.6%(-51.8)#7 | 64.8%(-60.9)#50 |
| 51. | Melville | 3.9% | 62.7%(-58.8)#1 | 64.8%(-60.9)#51 |
| 52. | White Sands | 4.1% | 68.7%(-64.6)#3 | 64.8%(-60.7)#52 |
| 53. | Bull Creek | 4.3% | 67.6%(-63.3)#4 | 64.8%(-60.6)#53 |
| 54. | Vernon | 4.4% | 55.6%(-51.2)#8 | 64.8%(-60.4)#54 |
| 55. | Kaser | 4.5% | 54.3%(-49.8)#2 | 64.8%(-60.3)#55 |
| 56. | Nellis Afb | 4.6% | 58.4%(-53.9)#1 | 64.8%(-60.3)#56 |
| 57. | Navajo | 4.8% | 68.7%(-63.8)#4 | 64.8%(-60.0)#57 |
| 58. | Barboursville | 4.9% | 66.9%(-62.0)#5 | 64.8%(-59.9)#58 |
| 59. | Cold Bay | 5.3% | 66.3%(-60.9)#2 | 64.8%(-59.5)#59 |
| 60. | Idalia | 5.4% | 66.2%(-60.8)#1 | 64.8%(-59.4)#60 |
| 61. | Notre Dame | 5.7% | 70.1%(-64.4)#1 | 64.8%(-59.1)#61 |
| 62. | Startex | 5.9% | 70.9%(-65.0)#1 | 64.8%(-58.9)#62 |
| 63. | Seven Springs Borough | 5.9% | 69.2%(-63.3)#1 | 64.8%(-58.9)#63 |
| 64. | Neskowin | 6.7% | 63.2%(-56.5)#1 | 64.8%(-58.1)#64 |
| 65. | Glendale | 6.7% | 66.2%(-59.4)#2 | 64.8%(-58.1)#65 |
| 66. | Goodville | 6.8% | 69.2%(-62.4)#2 | 64.8%(-58.0)#66 |
| 67. | Evergreen | 6.9% | 67.6%(-60.7)#5 | 64.8%(-57.9)#67 |
| 68. | Marlborough | 6.9% | 67.6%(-60.7)#6 | 64.8%(-57.9)#68 |
| 69. | Lewis | 7.0% | 70.1%(-63.1)#2 | 64.8%(-57.8)#69 |
| 70. | Marina Del Rey | 7.0% | 55.6%(-48.6)#9 | 64.8%(-57.8)#70 |
| 71. | Little Eagle | 7.1% | 68.4%(-61.3)#1 | 64.8%(-57.7)#71 |
| 72. | Haverford College | 7.2% | 69.2%(-61.9)#3 | 64.8%(-57.6)#72 |
| 73. | Allen | 7.2% | 68.4%(-61.2)#2 | 64.8%(-57.6)#73 |
| 74. | March Arb | 7.4% | 55.6%(-48.2)#10 | 64.8%(-57.4)#74 |
| 75. | Cobbtown | 7.4% | 66.9%(-59.5)#3 | 64.8%(-57.4)#75 |
| 76. | Acton | 7.5% | 69.0%(-61.5)#2 | 64.8%(-57.3)#76 |
| 77. | Calcium | 7.5% | 54.3%(-46.8)#3 | 64.8%(-57.3)#77 |
| 78. | Two Strike | 7.7% | 68.4%(-60.7)#3 | 64.8%(-57.1)#78 |
| 79. | Page Park | 8.0% | 66.9%(-58.8)#4 | 64.8%(-56.8)#79 |
| 80. | Ak Chin Village | 8.1% | 66.3%(-58.1)#1 | 64.8%(-56.7)#80 |
| 81. | Stateline | 8.1% | 58.4%(-50.3)#2 | 64.8%(-56.7)#81 |
| 82. | Boys Town | 8.3% | 66.5%(-58.2)#2 | 64.8%(-56.5)#82 |
| 83. | Franklin | 8.4% | 67.5%(-59.0)#4 | 64.8%(-56.4)#83 |
| 84. | West Canaveral Groves | 9.2% | 66.9%(-57.7)#5 | 64.8%(-55.7)#84 |
| 85. | Fallsburg | 9.3% | 54.3%(-45.0)#4 | 64.8%(-55.5)#85 |
| 86. | Lane | 9.3% | 66.7%(-57.4)#1 | 64.8%(-55.5)#86 |
| 87. | Whitesville | 9.3% | 66.9%(-57.6)#6 | 64.8%(-55.5)#87 |
| 88. | Cullowhee | 9.3% | 66.2%(-56.9)#1 | 64.8%(-55.5)#88 |
| 89. | Kimball | 9.4% | 74.2%(-64.8)#1 | 64.8%(-55.4)#89 |
| 90. | Glendora | 9.4% | 69.2%(-59.7)#1 | 64.8%(-55.4)#90 |
| 91. | Coleville | 9.5% | 55.6%(-46.1)#11 | 64.8%(-55.3)#91 |
| 92. | Panther Burn | 9.5% | 69.2%(-59.6)#2 | 64.8%(-55.3)#92 |
| 93. | Homewood At Martinsburg | 9.6% | 69.2%(-59.6)#4 | 64.8%(-55.2)#93 |
| 94. | Penney Farms | 9.9% | 66.9%(-57.0)#6 | 64.8%(-55.0)#94 |
| 95. | Villa De Sabana | 9.9% | 68.0%(-58.1)#1 | 64.8%(-54.9)#95 |
| 96. | Eldora | 10.0% | 66.2%(-56.2)#3 | 64.8%(-54.9)#96 |
| 97. | Industry | 10.0% | 55.6%(-45.6)#12 | 64.8%(-54.8)#97 |
| 98. | Kickapoo Site 7 | 10.0% | 66.9%(-56.9)#2 | 64.8%(-54.8)#98 |
| 99. | Audubon Park Borough | 10.1% | 63.9%(-53.7)#3 | 64.8%(-54.7)#99 |
| 100. | Jardine | 10.3% | 69.0%(-58.8)#3 | 64.8%(-54.6)#100 |
Common Questions
What are the Top 10 Cities with the Lowest Percentage of Owner-Occupied Units in the United States?
Top 10 Cities with the Lowest Percentage of Owner-Occupied Units in the United States are:
#1
0.17%
#2
0.22%
#3
0.24%
#4
0.24%
#5
0.28%
#6
0.31%
#7
0.50%
#8
0.56%
#9
0.64%
#10
0.66%
What city has the Lowest Percentage of Owner-Occupied Units in the United States?
Fort Stewart has the Lowest Percentage of Owner-Occupied Units in the United States with 0.17%.
What is the Percentage of Owner-Occupied Units in the United States?
Percentage of Owner-Occupied Units in the United States is 64.8%.