Cities with the Lowest Percentage of Owner-Occupied Units in Illinois
RELATED REPORTS & OPTIONS
Lowest Owner-Occupied
Illinois
Compare Cities
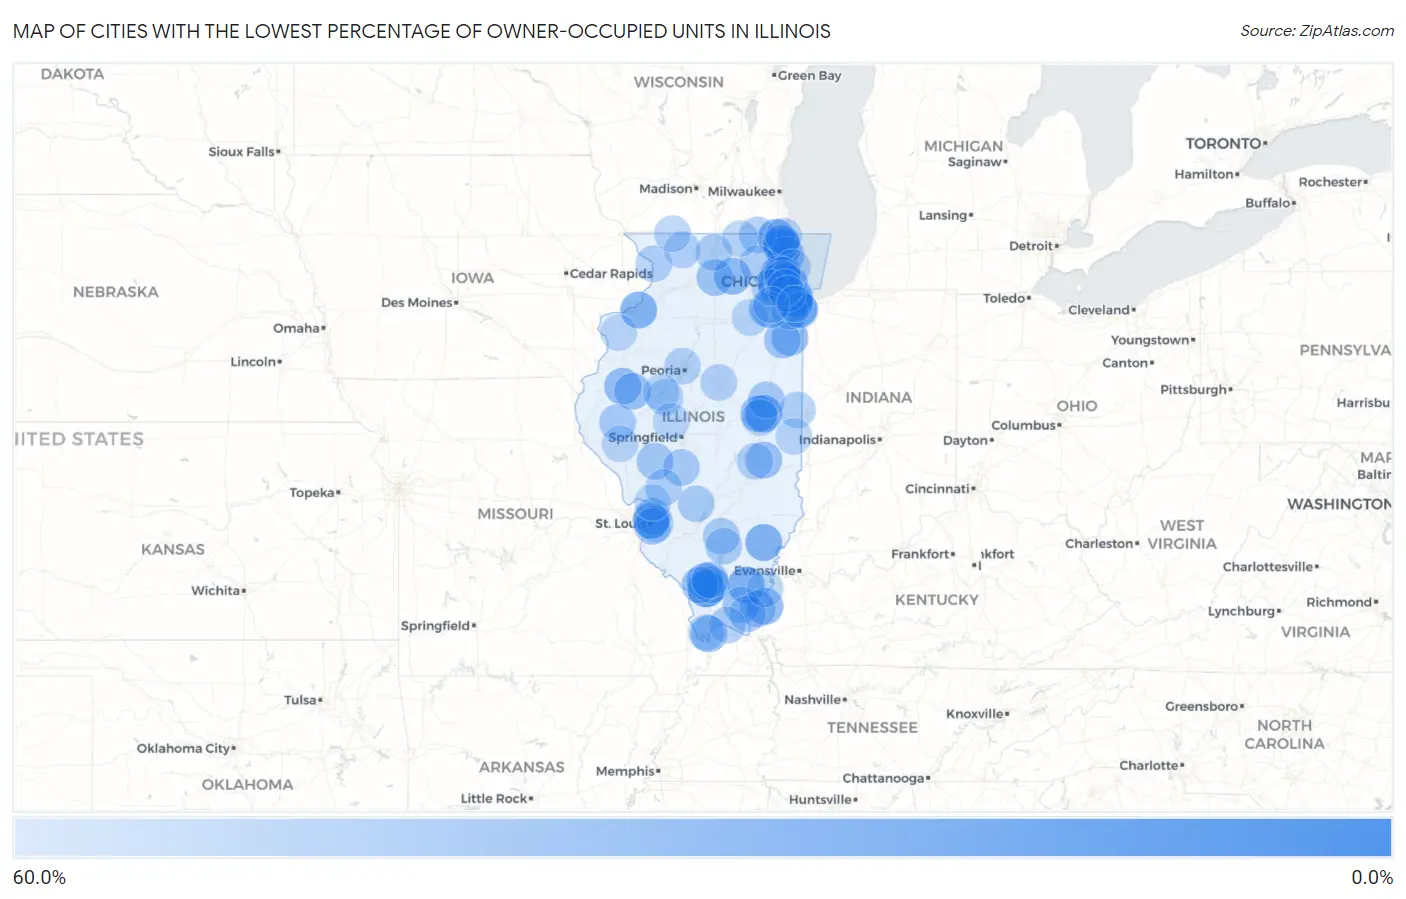
Map of Cities with the Lowest Percentage of Owner-Occupied Units in Illinois
60.0%
0.0%
Cities with the Lowest Percentage of Owner-Occupied Units in Illinois
| City | % Owner-Occupied | vs State | vs National | |
| 1. | Lane | 9.3% | 66.7%(-57.4)#1 | 64.8%(-55.5)#86 |
| 2. | Janesville | 16.7% | 66.7%(-50.0)#2 | 64.8%(-48.1)#159 |
| 3. | Serena | 21.7% | 66.7%(-44.9)#3 | 64.8%(-43.1)#247 |
| 4. | Rosemont | 22.1% | 66.7%(-44.5)#4 | 64.8%(-42.7)#256 |
| 5. | Carbondale | 25.7% | 66.7%(-41.0)#5 | 64.8%(-39.2)#333 |
| 6. | Oakbrook Terrace | 27.6% | 66.7%(-39.1)#6 | 64.8%(-37.2)#386 |
| 7. | North Chicago | 31.7% | 66.7%(-35.0)#7 | 64.8%(-33.1)#556 |
| 8. | Urbana | 32.8% | 66.7%(-33.8)#8 | 64.8%(-32.0)#605 |
| 9. | Custer Park | 34.8% | 66.7%(-31.9)#9 | 64.8%(-30.0)#703 |
| 10. | Muddy | 37.5% | 66.7%(-29.2)#10 | 64.8%(-27.3)#920 |
| 11. | Golden Gate | 37.9% | 66.7%(-28.7)#11 | 64.8%(-26.9)#949 |
| 12. | Ford Heights | 38.0% | 66.7%(-28.7)#12 | 64.8%(-26.9)#950 |
| 13. | Old Mill Creek | 38.2% | 66.7%(-28.5)#13 | 64.8%(-26.6)#967 |
| 14. | Cambria | 41.8% | 66.7%(-24.9)#14 | 64.8%(-23.0)#1,331 |
| 15. | Dekalb | 42.1% | 66.7%(-24.6)#15 | 64.8%(-22.7)#1,367 |
| 16. | Cave In Rock | 43.3% | 66.7%(-23.4)#16 | 64.8%(-21.5)#1,530 |
| 17. | De Soto | 43.8% | 66.7%(-22.8)#17 | 64.8%(-21.0)#1,615 |
| 18. | Cahokia Heights | 44.4% | 66.7%(-22.3)#18 | 64.8%(-20.4)#1,690 |
| 19. | Mound City | 44.4% | 66.7%(-22.3)#19 | 64.8%(-20.4)#1,692 |
| 20. | Champaign | 45.4% | 66.7%(-21.3)#20 | 64.8%(-19.4)#1,855 |
| 21. | Macomb | 45.4% | 66.7%(-21.3)#21 | 64.8%(-19.4)#1,859 |
| 22. | Chicago | 45.6% | 66.7%(-21.1)#22 | 64.8%(-19.2)#1,890 |
| 23. | Sun River Terrace | 46.2% | 66.7%(-20.5)#23 | 64.8%(-18.7)#1,975 |
| 24. | Rockdale | 46.7% | 66.7%(-20.0)#24 | 64.8%(-18.1)#2,084 |
| 25. | Cameron | 46.8% | 66.7%(-19.9)#25 | 64.8%(-18.1)#2,097 |
| 26. | Adair | 47.0% | 66.7%(-19.7)#26 | 64.8%(-17.8)#2,143 |
| 27. | Calumet Park | 47.0% | 66.7%(-19.7)#27 | 64.8%(-17.8)#2,152 |
| 28. | Venice | 47.1% | 66.7%(-19.6)#28 | 64.8%(-17.7)#2,172 |
| 29. | Charleston | 47.4% | 66.7%(-19.3)#29 | 64.8%(-17.5)#2,213 |
| 30. | Murphysboro | 47.7% | 66.7%(-19.0)#30 | 64.8%(-17.1)#2,294 |
| 31. | Blue Island | 48.7% | 66.7%(-18.0)#31 | 64.8%(-16.2)#2,509 |
| 32. | Waukegan | 48.9% | 66.7%(-17.8)#32 | 64.8%(-15.9)#2,574 |
| 33. | Kankakee | 48.9% | 66.7%(-17.8)#33 | 64.8%(-15.9)#2,585 |
| 34. | Riverdale | 49.2% | 66.7%(-17.4)#34 | 64.8%(-15.6)#2,671 |
| 35. | Rochelle | 49.4% | 66.7%(-17.2)#35 | 64.8%(-15.4)#2,719 |
| 36. | Harvey | 49.7% | 66.7%(-17.0)#36 | 64.8%(-15.2)#2,772 |
| 37. | Scottville | 50.0% | 66.7%(-16.7)#37 | 64.8%(-14.8)#2,885 |
| 38. | Eddyville | 50.0% | 66.7%(-16.7)#38 | 64.8%(-14.8)#2,889 |
| 39. | Highwood | 50.3% | 66.7%(-16.4)#39 | 64.8%(-14.5)#2,962 |
| 40. | Richton Park | 50.5% | 66.7%(-16.2)#40 | 64.8%(-14.3)#3,021 |
| 41. | Elizabethtown | 52.0% | 66.7%(-14.7)#41 | 64.8%(-12.9)#3,433 |
| 42. | Mount Sterling | 52.1% | 66.7%(-14.6)#42 | 64.8%(-12.7)#3,477 |
| 43. | Rantoul | 52.2% | 66.7%(-14.5)#43 | 64.8%(-12.6)#3,514 |
| 44. | Westmont | 52.3% | 66.7%(-14.4)#44 | 64.8%(-12.5)#3,544 |
| 45. | Madison | 52.3% | 66.7%(-14.3)#45 | 64.8%(-12.5)#3,556 |
| 46. | Hurst | 52.3% | 66.7%(-14.3)#46 | 64.8%(-12.5)#3,557 |
| 47. | East St Louis | 52.4% | 66.7%(-14.3)#47 | 64.8%(-12.5)#3,567 |
| 48. | Greenville | 52.5% | 66.7%(-14.2)#48 | 64.8%(-12.3)#3,610 |
| 49. | Dix | 52.7% | 66.7%(-14.0)#49 | 64.8%(-12.1)#3,676 |
| 50. | Waggoner | 52.7% | 66.7%(-14.0)#50 | 64.8%(-12.1)#3,680 |
| 51. | Justice | 52.8% | 66.7%(-13.9)#51 | 64.8%(-12.0)#3,711 |
| 52. | Sauget | 52.9% | 66.7%(-13.7)#52 | 64.8%(-11.9)#3,770 |
| 53. | Bensenville | 53.1% | 66.7%(-13.6)#53 | 64.8%(-11.8)#3,807 |
| 54. | Golconda | 53.2% | 66.7%(-13.4)#54 | 64.8%(-11.6)#3,862 |
| 55. | Richmond | 53.3% | 66.7%(-13.4)#55 | 64.8%(-11.5)#3,879 |
| 56. | Edgington | 54.1% | 66.7%(-12.6)#56 | 64.8%(-10.8)#4,132 |
| 57. | Rockford | 54.1% | 66.7%(-12.6)#57 | 64.8%(-10.7)#4,149 |
| 58. | Mount Vernon | 54.1% | 66.7%(-12.5)#58 | 64.8%(-10.7)#4,154 |
| 59. | Stone Park | 54.2% | 66.7%(-12.4)#59 | 64.8%(-10.6)#4,182 |
| 60. | Park City | 54.3% | 66.7%(-12.4)#60 | 64.8%(-10.6)#4,195 |
| 61. | Ridgewood | 54.3% | 66.7%(-12.3)#61 | 64.8%(-10.5)#4,222 |
| 62. | Carbon Cliff | 54.5% | 66.7%(-12.2)#62 | 64.8%(-10.3)#4,261 |
| 63. | Joppa | 54.5% | 66.7%(-12.1)#63 | 64.8%(-10.3)#4,282 |
| 64. | Cicero | 54.6% | 66.7%(-12.1)#64 | 64.8%(-10.2)#4,312 |
| 65. | West Dundee | 55.0% | 66.7%(-11.7)#65 | 64.8%(-9.82)#4,449 |
| 66. | Mattoon | 55.0% | 66.7%(-11.7)#66 | 64.8%(-9.82)#4,450 |
| 67. | Melrose Park | 55.1% | 66.7%(-11.6)#67 | 64.8%(-9.74)#4,478 |
| 68. | Forest Park | 55.2% | 66.7%(-11.5)#68 | 64.8%(-9.63)#4,524 |
| 69. | Savanna | 55.3% | 66.7%(-11.4)#69 | 64.8%(-9.55)#4,551 |
| 70. | Royal Lakes | 55.4% | 66.7%(-11.2)#70 | 64.8%(-9.37)#4,619 |
| 71. | Normal | 55.8% | 66.7%(-10.9)#71 | 64.8%(-9.02)#4,755 |
| 72. | Zion | 55.9% | 66.7%(-10.8)#72 | 64.8%(-8.90)#4,787 |
| 73. | Evanston | 55.9% | 66.7%(-10.8)#73 | 64.8%(-8.89)#4,789 |
| 74. | Marley | 56.0% | 66.7%(-10.7)#74 | 64.8%(-8.82)#4,822 |
| 75. | Danville | 56.0% | 66.7%(-10.7)#75 | 64.8%(-8.80)#4,825 |
| 76. | Topeka | 56.2% | 66.7%(-10.4)#76 | 64.8%(-8.57)#4,923 |
| 77. | Peoria | 56.3% | 66.7%(-10.4)#77 | 64.8%(-8.54)#4,933 |
| 78. | Sauk Village | 56.3% | 66.7%(-10.4)#78 | 64.8%(-8.52)#4,940 |
| 79. | Preston Heights | 56.3% | 66.7%(-10.4)#79 | 64.8%(-8.52)#4,943 |
| 80. | Brooklyn | 56.4% | 66.7%(-10.3)#80 | 64.8%(-8.44)#4,981 |
| 81. | Silvis | 56.7% | 66.7%(-9.98)#81 | 64.8%(-8.12)#5,105 |
| 82. | Lisle | 56.7% | 66.7%(-9.96)#82 | 64.8%(-8.10)#5,113 |
| 83. | Freeport | 56.9% | 66.7%(-9.79)#83 | 64.8%(-7.93)#5,176 |
| 84. | Winslow | 57.1% | 66.7%(-9.53)#84 | 64.8%(-7.67)#5,282 |
| 85. | Schiller Park | 57.2% | 66.7%(-9.52)#85 | 64.8%(-7.66)#5,306 |
| 86. | Alton | 57.3% | 66.7%(-9.33)#86 | 64.8%(-7.47)#5,378 |
| 87. | Savoy | 57.4% | 66.7%(-9.27)#87 | 64.8%(-7.41)#5,399 |
| 88. | Shawneetown | 57.4% | 66.7%(-9.25)#88 | 64.8%(-7.39)#5,415 |
| 89. | Summit | 57.6% | 66.7%(-9.12)#89 | 64.8%(-7.26)#5,462 |
| 90. | Harvard | 57.6% | 66.7%(-9.11)#90 | 64.8%(-7.25)#5,468 |
| 91. | Liverpool | 57.7% | 66.7%(-8.98)#91 | 64.8%(-7.12)#5,522 |
| 92. | Morris | 57.9% | 66.7%(-8.79)#92 | 64.8%(-6.94)#5,603 |
| 93. | Chicago Ridge | 57.9% | 66.7%(-8.76)#93 | 64.8%(-6.90)#5,625 |
| 94. | Chrisman | 58.3% | 66.7%(-8.42)#94 | 64.8%(-6.56)#5,763 |
| 95. | Fairmont | 58.3% | 66.7%(-8.39)#95 | 64.8%(-6.54)#5,775 |
| 96. | Griggsville | 58.4% | 66.7%(-8.26)#96 | 64.8%(-6.40)#5,825 |
| 97. | Mounds | 58.4% | 66.7%(-8.24)#97 | 64.8%(-6.38)#5,834 |
| 98. | Petersburg | 58.5% | 66.7%(-8.19)#98 | 64.8%(-6.34)#5,846 |
| 99. | Aledo | 58.5% | 66.7%(-8.16)#99 | 64.8%(-6.31)#5,863 |
| 100. | East Hazel Crest | 58.5% | 66.7%(-8.16)#100 | 64.8%(-6.30)#5,865 |
Common Questions
What are the Top 10 Cities with the Lowest Percentage of Owner-Occupied Units in Illinois?
Top 10 Cities with the Lowest Percentage of Owner-Occupied Units in Illinois are:
#1
22.1%
#2
25.7%
#3
27.6%
#4
31.7%
#5
32.8%
#6
37.5%
#7
37.9%
#8
38.0%
#9
38.2%
#10
41.8%
What city has the Lowest Percentage of Owner-Occupied Units in Illinois?
Rosemont has the Lowest Percentage of Owner-Occupied Units in Illinois with 22.1%.
What is the Percentage of Owner-Occupied Units in the State of Illinois?
Percentage of Owner-Occupied Units in Illinois is 66.7%.
What is the Percentage of Owner-Occupied Units in the United States?
Percentage of Owner-Occupied Units in the United States is 64.8%.