Cities with the Lowest Percentage of Owner-Occupied Units in Maryland
RELATED REPORTS & OPTIONS
Lowest Owner-Occupied
Maryland
Compare Cities
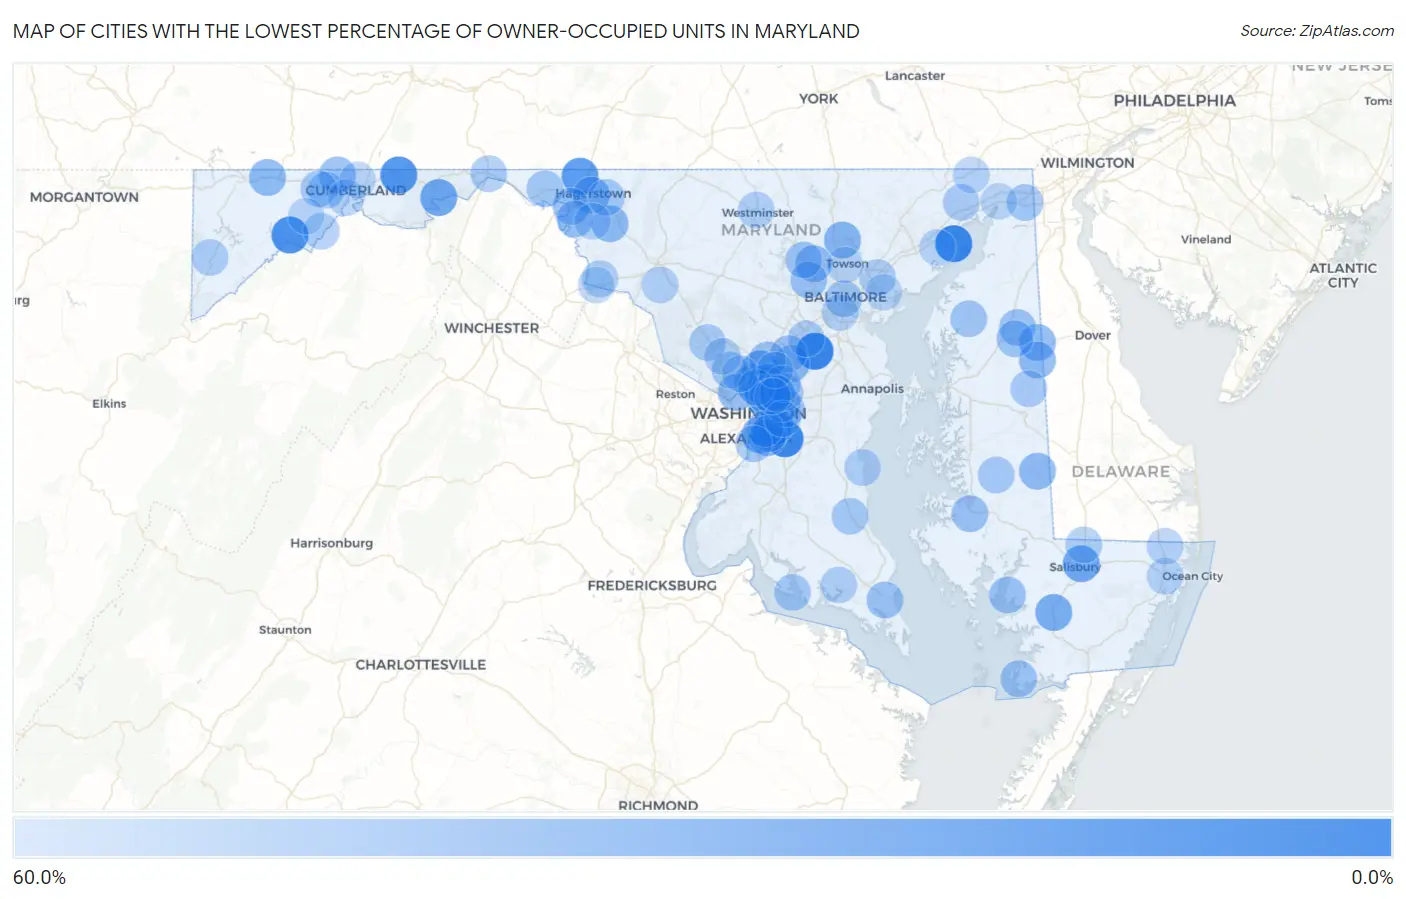
Map of Cities with the Lowest Percentage of Owner-Occupied Units in Maryland
60.0%
0.0%
Cities with the Lowest Percentage of Owner-Occupied Units in Maryland
| City | % Owner-Occupied | vs State | vs National | |
| 1. | Fort Meade | 0.24% | 67.5%(-67.2)#1 | 64.8%(-64.6)#4 |
| 2. | Andrews Afb | 1.0% | 67.5%(-66.4)#2 | 64.8%(-63.8)#21 |
| 3. | Aberdeen Proving Ground | 1.3% | 67.5%(-66.2)#3 | 64.8%(-63.5)#28 |
| 4. | Franklin | 8.4% | 67.5%(-59.0)#4 | 64.8%(-56.4)#83 |
| 5. | Flintstone | 11.4% | 67.5%(-56.1)#5 | 64.8%(-53.5)#110 |
| 6. | Cearfoss | 16.8% | 67.5%(-50.7)#6 | 64.8%(-48.0)#160 |
| 7. | Bladensburg | 19.0% | 67.5%(-48.5)#7 | 64.8%(-45.9)#191 |
| 8. | Langley Park | 22.8% | 67.5%(-44.6)#8 | 64.8%(-42.0)#271 |
| 9. | Silver Hill | 23.3% | 67.5%(-44.2)#9 | 64.8%(-41.5)#281 |
| 10. | Little Orleans | 24.0% | 67.5%(-43.5)#10 | 64.8%(-40.8)#291 |
| 11. | Mount Rainier | 25.5% | 67.5%(-42.0)#11 | 64.8%(-39.4)#327 |
| 12. | Salisbury | 25.8% | 67.5%(-41.7)#12 | 64.8%(-39.1)#336 |
| 13. | White Oak | 26.8% | 67.5%(-40.6)#13 | 64.8%(-38.0)#361 |
| 14. | Princess Anne | 30.2% | 67.5%(-37.3)#14 | 64.8%(-34.6)#485 |
| 15. | Glassmanor | 31.9% | 67.5%(-35.6)#15 | 64.8%(-33.0)#565 |
| 16. | Cockeysville | 35.4% | 67.5%(-32.1)#16 | 64.8%(-29.4)#749 |
| 17. | Suitland | 35.9% | 67.5%(-31.6)#17 | 64.8%(-28.9)#786 |
| 18. | Temple Hills | 36.2% | 67.5%(-31.3)#18 | 64.8%(-28.6)#804 |
| 19. | Silver Spring | 37.7% | 67.5%(-29.7)#19 | 64.8%(-27.1)#936 |
| 20. | Grantsville | 38.8% | 67.5%(-28.6)#20 | 64.8%(-26.0)#1,030 |
| 21. | Templeville | 38.9% | 67.5%(-28.6)#21 | 64.8%(-25.9)#1,036 |
| 22. | Mapleville | 39.9% | 67.5%(-27.6)#22 | 64.8%(-25.0)#1,119 |
| 23. | Friendship Heights Village | 39.9% | 67.5%(-27.5)#23 | 64.8%(-24.9)#1,125 |
| 24. | Henderson | 40.0% | 67.5%(-27.5)#24 | 64.8%(-24.8)#1,136 |
| 25. | Federalsburg | 40.1% | 67.5%(-27.4)#25 | 64.8%(-24.7)#1,155 |
| 26. | South Laurel | 40.1% | 67.5%(-27.3)#26 | 64.8%(-24.7)#1,157 |
| 27. | Hagerstown | 40.2% | 67.5%(-27.3)#27 | 64.8%(-24.6)#1,160 |
| 28. | Garrison | 40.5% | 67.5%(-27.0)#28 | 64.8%(-24.3)#1,190 |
| 29. | College Park | 40.9% | 67.5%(-26.6)#29 | 64.8%(-23.9)#1,235 |
| 30. | Williamsport | 41.2% | 67.5%(-26.3)#30 | 64.8%(-23.7)#1,264 |
| 31. | Chillum | 41.5% | 67.5%(-26.0)#31 | 64.8%(-23.3)#1,300 |
| 32. | Adelphi | 42.0% | 67.5%(-25.5)#32 | 64.8%(-22.8)#1,356 |
| 33. | Barrelville | 42.9% | 67.5%(-24.6)#33 | 64.8%(-22.0)#1,484 |
| 34. | Downsville | 43.6% | 67.5%(-23.8)#34 | 64.8%(-21.2)#1,583 |
| 35. | Brentwood | 44.0% | 67.5%(-23.5)#35 | 64.8%(-20.8)#1,636 |
| 36. | Cambridge | 44.2% | 67.5%(-23.3)#36 | 64.8%(-20.6)#1,658 |
| 37. | Laurel | 44.3% | 67.5%(-23.1)#37 | 64.8%(-20.5)#1,680 |
| 38. | Milford Mill | 44.6% | 67.5%(-22.9)#38 | 64.8%(-20.2)#1,731 |
| 39. | Marlow Heights | 44.9% | 67.5%(-22.6)#39 | 64.8%(-20.0)#1,777 |
| 40. | Summerfield | 44.9% | 67.5%(-22.6)#40 | 64.8%(-19.9)#1,782 |
| 41. | Lexington Park | 45.2% | 67.5%(-22.3)#41 | 64.8%(-19.6)#1,828 |
| 42. | Sudlersville | 45.2% | 67.5%(-22.3)#42 | 64.8%(-19.6)#1,831 |
| 43. | Nanticoke | 45.7% | 67.5%(-21.7)#43 | 64.8%(-19.1)#1,913 |
| 44. | Landover | 45.9% | 67.5%(-21.6)#44 | 64.8%(-19.0)#1,928 |
| 45. | Barclay | 46.1% | 67.5%(-21.4)#45 | 64.8%(-18.8)#1,955 |
| 46. | Fairland | 46.2% | 67.5%(-21.2)#46 | 64.8%(-18.6)#1,987 |
| 47. | Crisfield | 46.8% | 67.5%(-20.7)#47 | 64.8%(-18.0)#2,103 |
| 48. | Chestertown | 47.1% | 67.5%(-20.3)#48 | 64.8%(-17.7)#2,176 |
| 49. | Owings Mills | 47.7% | 67.5%(-19.7)#49 | 64.8%(-17.1)#2,302 |
| 50. | Baltimore | 47.8% | 67.5%(-19.7)#50 | 64.8%(-17.1)#2,307 |
| 51. | Elkton | 48.2% | 67.5%(-19.3)#51 | 64.8%(-16.6)#2,397 |
| 52. | New Carrollton | 48.2% | 67.5%(-19.2)#52 | 64.8%(-16.6)#2,402 |
| 53. | Eckhart Mines | 48.5% | 67.5%(-19.0)#53 | 64.8%(-16.4)#2,453 |
| 54. | Hillcrest Heights | 48.5% | 67.5%(-19.0)#54 | 64.8%(-16.3)#2,469 |
| 55. | National Harbor | 48.9% | 67.5%(-18.5)#55 | 64.8%(-15.9)#2,592 |
| 56. | North Bethesda | 49.2% | 67.5%(-18.3)#56 | 64.8%(-15.6)#2,668 |
| 57. | Clear Spring | 49.4% | 67.5%(-18.1)#57 | 64.8%(-15.4)#2,707 |
| 58. | Robinwood | 49.6% | 67.5%(-17.9)#58 | 64.8%(-15.2)#2,755 |
| 59. | Choptank | 50.0% | 67.5%(-17.5)#59 | 64.8%(-14.8)#2,882 |
| 60. | Rock Point | 50.0% | 67.5%(-17.5)#60 | 64.8%(-14.8)#2,884 |
| 61. | Prince Frederick | 50.2% | 67.5%(-17.3)#61 | 64.8%(-14.6)#2,944 |
| 62. | Hyattsville | 50.5% | 67.5%(-17.0)#62 | 64.8%(-14.3)#3,014 |
| 63. | Frostburg | 50.8% | 67.5%(-16.7)#63 | 64.8%(-14.0)#3,086 |
| 64. | Riverdale Park | 51.0% | 67.5%(-16.5)#64 | 64.8%(-13.8)#3,138 |
| 65. | Gaithersburg | 51.0% | 67.5%(-16.4)#65 | 64.8%(-13.8)#3,159 |
| 66. | Greenbelt | 51.3% | 67.5%(-16.1)#66 | 64.8%(-13.5)#3,247 |
| 67. | Takoma Park | 51.3% | 67.5%(-16.1)#67 | 64.8%(-13.5)#3,248 |
| 68. | Hancock | 51.7% | 67.5%(-15.8)#68 | 64.8%(-13.1)#3,351 |
| 69. | Cedar Heights | 52.2% | 67.5%(-15.3)#69 | 64.8%(-12.7)#3,495 |
| 70. | Greensboro | 52.2% | 67.5%(-15.2)#70 | 64.8%(-12.6)#3,520 |
| 71. | Jessup | 52.6% | 67.5%(-14.9)#71 | 64.8%(-12.3)#3,633 |
| 72. | Port Deposit | 52.6% | 67.5%(-14.8)#72 | 64.8%(-12.2)#3,655 |
| 73. | Oakland | 52.8% | 67.5%(-14.7)#73 | 64.8%(-12.0)#3,700 |
| 74. | Delmar | 52.9% | 67.5%(-14.5)#74 | 64.8%(-11.9)#3,774 |
| 75. | Rossville | 53.2% | 67.5%(-14.3)#75 | 64.8%(-11.6)#3,855 |
| 76. | Danville | 53.3% | 67.5%(-14.2)#76 | 64.8%(-11.5)#3,877 |
| 77. | East Riverdale | 53.4% | 67.5%(-14.1)#77 | 64.8%(-11.4)#3,922 |
| 78. | Leonardtown | 53.7% | 67.5%(-13.8)#78 | 64.8%(-11.1)#3,996 |
| 79. | Westminster | 53.8% | 67.5%(-13.7)#79 | 64.8%(-11.0)#4,021 |
| 80. | North Beach | 53.8% | 67.5%(-13.7)#80 | 64.8%(-11.0)#4,028 |
| 81. | Garretts Mill | 54.2% | 67.5%(-13.2)#81 | 64.8%(-10.6)#4,186 |
| 82. | Buckeystown | 54.5% | 67.5%(-13.0)#82 | 64.8%(-10.3)#4,268 |
| 83. | Rockville | 54.6% | 67.5%(-12.9)#83 | 64.8%(-10.2)#4,302 |
| 84. | Walker Mill | 54.9% | 67.5%(-12.5)#84 | 64.8%(-9.89)#4,428 |
| 85. | Bowling Green | 55.0% | 67.5%(-12.5)#85 | 64.8%(-9.82)#4,452 |
| 86. | Breathedsville | 55.6% | 67.5%(-11.9)#86 | 64.8%(-9.26)#4,656 |
| 87. | Baltimore Highlands | 56.0% | 67.5%(-11.5)#87 | 64.8%(-8.82)#4,817 |
| 88. | Berlin | 56.2% | 67.5%(-11.3)#88 | 64.8%(-8.64)#4,885 |
| 89. | Bishopville | 56.3% | 67.5%(-11.1)#89 | 64.8%(-8.49)#4,957 |
| 90. | Rising Sun | 56.4% | 67.5%(-11.1)#90 | 64.8%(-8.43)#4,989 |
| 91. | Perryman | 56.8% | 67.5%(-10.7)#91 | 64.8%(-8.04)#5,140 |
| 92. | Beltsville | 57.3% | 67.5%(-10.2)#92 | 64.8%(-7.50)#5,362 |
| 93. | Towson | 57.5% | 67.5%(-9.98)#93 | 64.8%(-7.32)#5,435 |
| 94. | Edmonston | 57.7% | 67.5%(-9.79)#94 | 64.8%(-7.13)#5,515 |
| 95. | Sandy Hook | 57.7% | 67.5%(-9.74)#95 | 64.8%(-7.08)#5,537 |
| 96. | North East | 57.8% | 67.5%(-9.70)#96 | 64.8%(-7.04)#5,560 |
| 97. | Kensington | 57.8% | 67.5%(-9.66)#97 | 64.8%(-7.01)#5,570 |
| 98. | Lonaconing | 57.9% | 67.5%(-9.56)#98 | 64.8%(-6.91)#5,623 |
| 99. | Bowmans Addition | 58.0% | 67.5%(-9.50)#99 | 64.8%(-6.85)#5,646 |
| 100. | Essex | 58.0% | 67.5%(-9.50)#100 | 64.8%(-6.84)#5,651 |
Common Questions
What are the Top 10 Cities with the Lowest Percentage of Owner-Occupied Units in Maryland?
Top 10 Cities with the Lowest Percentage of Owner-Occupied Units in Maryland are:
#1
0.24%
#2
1.0%
#3
1.3%
#4
8.4%
#5
11.4%
#6
16.8%
#7
19.0%
#8
22.8%
#9
23.3%
#10
24.0%
What city has the Lowest Percentage of Owner-Occupied Units in Maryland?
Fort Meade has the Lowest Percentage of Owner-Occupied Units in Maryland with 0.24%.
What is the Percentage of Owner-Occupied Units in the State of Maryland?
Percentage of Owner-Occupied Units in Maryland is 67.5%.
What is the Percentage of Owner-Occupied Units in the United States?
Percentage of Owner-Occupied Units in the United States is 64.8%.