Cities with the Lowest Percentage of Owner-Occupied Units in Oklahoma
RELATED REPORTS & OPTIONS
Lowest Owner-Occupied
Oklahoma
Compare Cities
Map of Cities with the Lowest Percentage of Owner-Occupied Units in Oklahoma
60.0%
0.0%
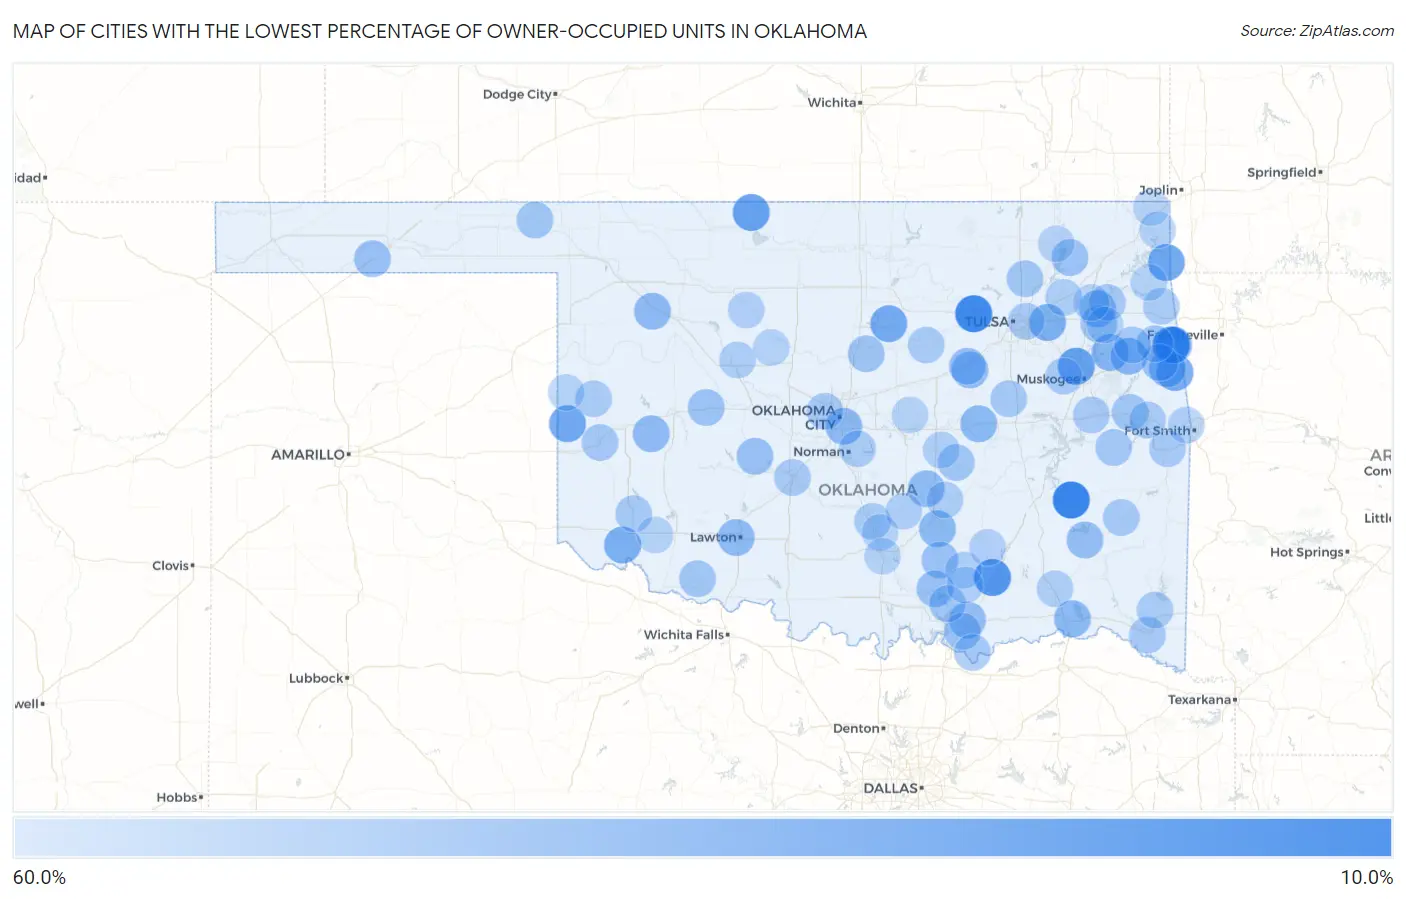
Cities with the Lowest Percentage of Owner-Occupied Units in Oklahoma
| City | % Owner-Occupied | vs State | vs National | |
| 1. | Gowen | 20.0% | 65.9% (-45.9)#1 | 64.8% (-44.8)#212 |
| 2. | Old Green | 20.4% | 65.9% (-45.6)#2 | 64.8% (-44.5)#220 |
| 3. | Oak Grove | 22.6% | 65.9% (-43.4)#3 | 64.8% (-42.2)#265 |
| 4. | Lake Ellsworth Addition | 27.3% | 65.9% (-38.7)#4 | 64.8% (-37.5)#374 |
| 5. | Tushka | 28.4% | 65.9% (-37.5)#5 | 64.8% (-36.4)#411 |
| 6. | Bowring | 29.3% | 65.9% (-36.7)#6 | 64.8% (-35.5)#448 |
| 7. | Lakeside | 29.5% | 65.9% (-36.5)#7 | 64.8% (-35.3)#457 |
| 8. | Tullahassee | 33.3% | 65.9% (-32.6)#8 | 64.8% (-31.5)#638 |
| 9. | Amorita | 33.3% | 65.9% (-32.6)#9 | 64.8% (-31.5)#641 |
| 10. | Dodge | 35.0% | 65.9% (-30.9)#10 | 64.8% (-29.8)#716 |
| 11. | Sweetwater | 36.1% | 65.9% (-29.8)#11 | 64.8% (-28.7)#800 |
| 12. | Elm Grove | 37.0% | 65.9% (-28.9)#12 | 64.8% (-27.8)#874 |
| 13. | Stillwater | 37.4% | 65.9% (-28.5)#13 | 64.8% (-27.4)#910 |
| 14. | Olustee | 39.2% | 65.9% (-26.7)#14 | 64.8% (-25.6)#1,061 |
| 15. | Fair Oaks | 39.6% | 65.9% (-26.4)#15 | 64.8% (-25.2)#1,095 |
| 16. | Tonkawa Tribal Housing | 41.4% | 65.9% (-24.5)#16 | 64.8% (-23.4)#1,295 |
| 17. | Nashoba | 41.7% | 65.9% (-24.3)#17 | 64.8% (-23.1)#1,316 |
| 18. | Hulbert | 41.9% | 65.9% (-24.0)#18 | 64.8% (-22.9)#1,344 |
| 19. | Tahlequah | 42.5% | 65.9% (-23.5)#19 | 64.8% (-22.4)#1,428 |
| 20. | Stilwell | 43.3% | 65.9% (-22.6)#20 | 64.8% (-21.5)#1,531 |
| 21. | Ada | 43.6% | 65.9% (-22.3)#21 | 64.8% (-21.2)#1,582 |
| 22. | Hugo | 43.6% | 65.9% (-22.3)#22 | 64.8% (-21.2)#1,584 |
| 23. | Sportsmen Acres | 44.0% | 65.9% (-21.9)#23 | 64.8% (-20.8)#1,637 |
| 24. | Okemah | 44.0% | 65.9% (-21.9)#24 | 64.8% (-20.8)#1,639 |
| 25. | Valley Brook | 44.3% | 65.9% (-21.6)#25 | 64.8% (-20.5)#1,674 |
| 26. | Mutual | 44.4% | 65.9% (-21.5)#26 | 64.8% (-20.4)#1,712 |
| 27. | Lawton | 44.7% | 65.9% (-21.2)#27 | 64.8% (-20.1)#1,747 |
| 28. | Westville | 45.1% | 65.9% (-20.9)#28 | 64.8% (-19.8)#1,811 |
| 29. | Burns Flat | 45.2% | 65.9% (-20.8)#29 | 64.8% (-19.7)#1,824 |
| 30. | Konawa | 45.3% | 65.9% (-20.6)#30 | 64.8% (-19.5)#1,848 |
| 31. | Slick | 45.5% | 65.9% (-20.5)#31 | 64.8% (-19.4)#1,872 |
| 32. | Durant | 45.8% | 65.9% (-20.1)#32 | 64.8% (-19.0)#1,925 |
| 33. | Milfay | 46.2% | 65.9% (-19.8)#33 | 64.8% (-18.7)#1,979 |
| 34. | Clayton | 46.8% | 65.9% (-19.2)#34 | 64.8% (-18.1)#2,096 |
| 35. | Mulberry | 47.4% | 65.9% (-18.6)#35 | 64.8% (-17.4)#2,220 |
| 36. | Bristow | 47.6% | 65.9% (-18.4)#36 | 64.8% (-17.2)#2,262 |
| 37. | Connerville | 47.6% | 65.9% (-18.3)#37 | 64.8% (-17.2)#2,276 |
| 38. | Goodwell | 47.8% | 65.9% (-18.2)#38 | 64.8% (-17.0)#2,312 |
| 39. | Gracemont | 47.9% | 65.9% (-18.1)#39 | 64.8% (-16.9)#2,334 |
| 40. | Tishomingo | 47.9% | 65.9% (-18.0)#40 | 64.8% (-16.9)#2,348 |
| 41. | Weatherford | 48.7% | 65.9% (-17.3)#41 | 64.8% (-16.1)#2,514 |
| 42. | Calera | 48.7% | 65.9% (-17.2)#42 | 64.8% (-16.1)#2,523 |
| 43. | New Alluwe | 48.7% | 65.9% (-17.2)#43 | 64.8% (-16.1)#2,526 |
| 44. | Langston | 49.1% | 65.9% (-16.9)#44 | 64.8% (-15.8)#2,630 |
| 45. | Proctor | 50.0% | 65.9% (-15.9)#45 | 64.8% (-14.8)#2,871 |
| 46. | Bee | 50.0% | 65.9% (-15.9)#46 | 64.8% (-14.8)#2,877 |
| 47. | Murphy | 50.0% | 65.9% (-15.9)#47 | 64.8% (-14.8)#2,878 |
| 48. | Reagan | 50.0% | 65.9% (-15.9)#48 | 64.8% (-14.8)#2,899 |
| 49. | Knowles | 50.0% | 65.9% (-15.9)#49 | 64.8% (-14.8)#2,912 |
| 50. | Loveland | 50.0% | 65.9% (-15.9)#50 | 64.8% (-14.8)#2,916 |
| 51. | Wewoka | 50.0% | 65.9% (-15.9)#51 | 64.8% (-14.8)#2,925 |
| 52. | Vera | 50.3% | 65.9% (-15.6)#52 | 64.8% (-14.5)#2,960 |
| 53. | Vian | 50.3% | 65.9% (-15.6)#53 | 64.8% (-14.5)#2,963 |
| 54. | Oak Hill-Piney | 50.9% | 65.9% (-15.1)#54 | 64.8% (-13.9)#3,107 |
| 55. | Kemp | 50.9% | 65.9% (-15.0)#55 | 64.8% (-13.9)#3,126 |
| 56. | Steely Hollow | 51.0% | 65.9% (-15.0)#56 | 64.8% (-13.8)#3,132 |
| 57. | Stigler | 51.0% | 65.9% (-14.9)#57 | 64.8% (-13.8)#3,152 |
| 58. | Sayre | 51.2% | 65.9% (-14.8)#58 | 64.8% (-13.7)#3,192 |
| 59. | Blair | 51.3% | 65.9% (-14.6)#59 | 64.8% (-13.5)#3,251 |
| 60. | Okmulgee | 51.3% | 65.9% (-14.6)#60 | 64.8% (-13.5)#3,252 |
| 61. | Talihina | 51.7% | 65.9% (-14.3)#61 | 64.8% (-13.1)#3,346 |
| 62. | Spiro | 51.9% | 65.9% (-14.1)#62 | 64.8% (-13.0)#3,401 |
| 63. | Taft | 51.9% | 65.9% (-14.0)#63 | 64.8% (-12.9)#3,426 |
| 64. | Chickasha | 52.0% | 65.9% (-13.9)#64 | 64.8% (-12.8)#3,452 |
| 65. | Bethany | 52.1% | 65.9% (-13.8)#65 | 64.8% (-12.7)#3,479 |
| 66. | Salina | 52.2% | 65.9% (-13.8)#66 | 64.8% (-12.7)#3,496 |
| 67. | Idabel | 52.2% | 65.9% (-13.7)#67 | 64.8% (-12.6)#3,521 |
| 68. | Tulsa | 52.3% | 65.9% (-13.7)#68 | 64.8% (-12.6)#3,535 |
| 69. | Warner | 52.3% | 65.9% (-13.7)#69 | 64.8% (-12.5)#3,538 |
| 70. | Norman | 52.4% | 65.9% (-13.6)#70 | 64.8% (-12.4)#3,571 |
| 71. | Cushing | 52.4% | 65.9% (-13.5)#71 | 64.8% (-12.4)#3,597 |
| 72. | Colcord | 52.5% | 65.9% (-13.5)#72 | 64.8% (-12.3)#3,613 |
| 73. | Broken Bow | 52.5% | 65.9% (-13.4)#73 | 64.8% (-12.3)#3,622 |
| 74. | Cheyenne | 52.6% | 65.9% (-13.3)#74 | 64.8% (-12.2)#3,647 |
| 75. | Sallisaw | 52.7% | 65.9% (-13.3)#75 | 64.8% (-12.1)#3,670 |
| 76. | Pauls Valley | 52.8% | 65.9% (-13.2)#76 | 64.8% (-12.0)#3,704 |
| 77. | Francis | 53.2% | 65.9% (-12.7)#77 | 64.8% (-11.6)#3,854 |
| 78. | Watonga | 53.4% | 65.9% (-12.5)#78 | 64.8% (-11.4)#3,920 |
| 79. | Wapanucka | 53.5% | 65.9% (-12.4)#79 | 64.8% (-11.3)#3,950 |
| 80. | Coleman | 53.6% | 65.9% (-12.4)#80 | 64.8% (-11.2)#3,962 |
| 81. | Seminole | 53.9% | 65.9% (-12.1)#81 | 64.8% (-10.9)#4,062 |
| 82. | Antlers | 53.9% | 65.9% (-12.0)#82 | 64.8% (-10.9)#4,078 |
| 83. | Claremore | 54.0% | 65.9% (-11.9)#83 | 64.8% (-10.8)#4,119 |
| 84. | Stratford | 54.1% | 65.9% (-11.8)#84 | 64.8% (-10.7)#4,160 |
| 85. | Coalgate | 54.4% | 65.9% (-11.5)#85 | 64.8% (-10.4)#4,237 |
| 86. | Isabella | 54.5% | 65.9% (-11.4)#86 | 64.8% (-10.3)#4,287 |
| 87. | Moffett | 54.5% | 65.9% (-11.4)#87 | 64.8% (-10.3)#4,288 |
| 88. | Wynnewood | 54.8% | 65.9% (-11.2)#88 | 64.8% (-10.0)#4,379 |
| 89. | Davis | 54.8% | 65.9% (-11.1)#89 | 64.8% (-10.0)#4,384 |
| 90. | Loyal | 54.8% | 65.9% (-11.1)#90 | 64.8% (-9.98)#4,401 |
| 91. | Reydon | 54.9% | 65.9% (-11.0)#91 | 64.8% (-9.89)#4,432 |
| 92. | Headrick | 55.0% | 65.9% (-10.9)#92 | 64.8% (-9.82)#4,462 |
| 93. | Jay | 55.1% | 65.9% (-10.9)#93 | 64.8% (-9.75)#4,477 |
| 94. | Cedar Crest | 55.1% | 65.9% (-10.9)#94 | 64.8% (-9.73)#4,484 |
| 95. | Hanson | 55.1% | 65.9% (-10.8)#95 | 64.8% (-9.71)#4,491 |
| 96. | Pryor Creek | 55.1% | 65.9% (-10.8)#96 | 64.8% (-9.71)#4,495 |
| 97. | Wyandotte | 55.1% | 65.9% (-10.8)#97 | 64.8% (-9.69)#4,501 |
| 98. | Meeker | 55.3% | 65.9% (-10.6)#98 | 64.8% (-9.49)#4,571 |
| 99. | Nowata | 55.4% | 65.9% (-10.6)#99 | 64.8% (-9.44)#4,592 |
| 100. | Quapaw | 55.6% | 65.9% (-10.3)#100 | 64.8% (-9.19)#4,684 |
Common Questions
What are the Top 10 Cities with the Lowest Percentage of Owner-Occupied Units in Oklahoma?
Top 10 Cities with the Lowest Percentage of Owner-Occupied Units in Oklahoma are:
#1
20.0%
#2
20.4%
#3
22.6%
#4
28.4%
#5
33.3%
#6
33.3%
#7
35.0%
#8
36.1%
#9
37.0%
#10
37.4%
What city has the Lowest Percentage of Owner-Occupied Units in Oklahoma?
Gowen has the Lowest Percentage of Owner-Occupied Units in Oklahoma with 20.0%.
What is the Percentage of Owner-Occupied Units in the State of Oklahoma?
Percentage of Owner-Occupied Units in Oklahoma is 65.9%.
What is the Percentage of Owner-Occupied Units in the United States?
Percentage of Owner-Occupied Units in the United States is 64.8%.