Cities with the Lowest Percentage of Owner-Occupied Units in Ohio
RELATED REPORTS & OPTIONS
Lowest Owner-Occupied
Ohio
Compare Cities
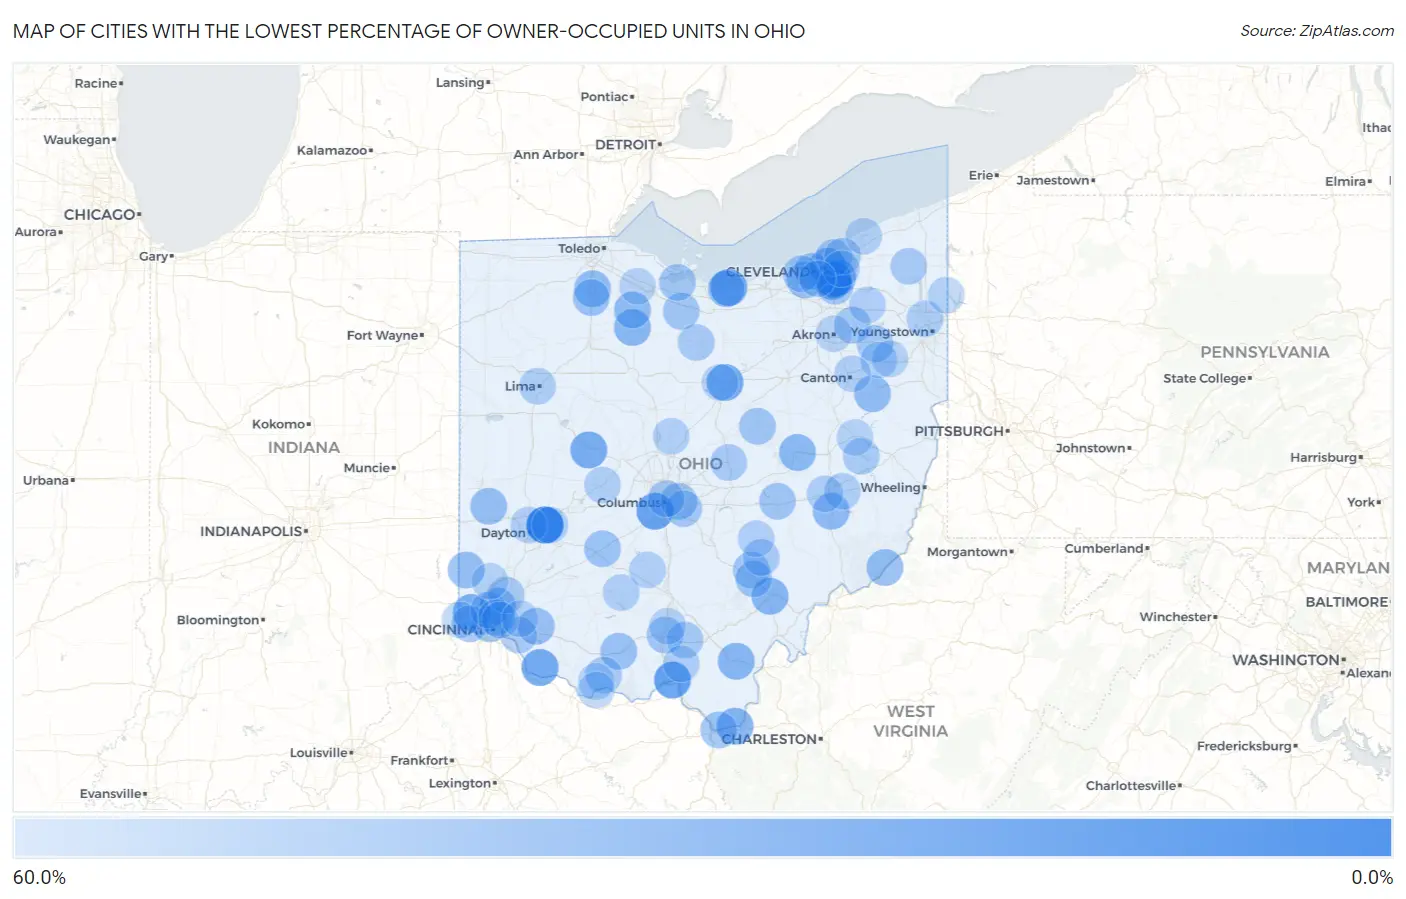
Map of Cities with the Lowest Percentage of Owner-Occupied Units in Ohio
60.0%
0.0%
Cities with the Lowest Percentage of Owner-Occupied Units in Ohio
| City | % Owner-Occupied | vs State | vs National | |
| 1. | Wright Patterson Afb | 0.73% | 66.8%(-66.1)#1 | 64.8%(-64.1)#13 |
| 2. | Urbancrest | 19.3% | 66.8%(-47.5)#2 | 64.8%(-45.5)#195 |
| 3. | Beulah Beach | 22.9% | 66.8%(-44.0)#3 | 64.8%(-42.0)#274 |
| 4. | Felicity | 24.4% | 66.8%(-42.5)#4 | 64.8%(-40.5)#297 |
| 5. | Lincoln Heights | 24.5% | 66.8%(-42.3)#5 | 64.8%(-40.3)#301 |
| 6. | North Randall | 25.3% | 66.8%(-41.6)#6 | 64.8%(-39.6)#322 |
| 7. | Valley Hi | 26.3% | 66.8%(-40.5)#7 | 64.8%(-38.5)#346 |
| 8. | Woodmere | 26.8% | 66.8%(-40.0)#8 | 64.8%(-38.0)#359 |
| 9. | Miamitown | 27.2% | 66.8%(-39.6)#9 | 64.8%(-37.6)#369 |
| 10. | Birmingham | 28.7% | 66.8%(-38.1)#10 | 64.8%(-36.1)#427 |
| 11. | Highland Hills | 28.9% | 66.8%(-37.9)#11 | 64.8%(-35.9)#435 |
| 12. | Proctorville | 30.2% | 66.8%(-36.7)#12 | 64.8%(-34.7)#482 |
| 13. | New Boston | 30.8% | 66.8%(-36.0)#13 | 64.8%(-34.0)#521 |
| 14. | East Cleveland | 30.9% | 66.8%(-35.9)#14 | 64.8%(-33.9)#525 |
| 15. | Rio Grande | 32.2% | 66.8%(-34.6)#15 | 64.8%(-32.6)#572 |
| 16. | Athens | 32.2% | 66.8%(-34.6)#16 | 64.8%(-32.6)#574 |
| 17. | Bascom | 32.6% | 66.8%(-34.3)#17 | 64.8%(-32.3)#589 |
| 18. | Canal Lewisville | 33.5% | 66.8%(-33.3)#18 | 64.8%(-31.3)#645 |
| 19. | Pleasant City | 35.6% | 66.8%(-31.2)#19 | 64.8%(-29.2)#762 |
| 20. | Bowling Green | 35.8% | 66.8%(-31.1)#20 | 64.8%(-29.1)#776 |
| 21. | Kansas | 35.8% | 66.8%(-31.0)#21 | 64.8%(-29.0)#783 |
| 22. | South Mount Vernon | 36.1% | 66.8%(-30.8)#22 | 64.8%(-28.8)#797 |
| 23. | Malvern | 36.5% | 66.8%(-30.3)#23 | 64.8%(-28.3)#834 |
| 24. | Woodlawn | 37.0% | 66.8%(-29.8)#24 | 64.8%(-27.8)#872 |
| 25. | Matamoras | 37.1% | 66.8%(-29.7)#25 | 64.8%(-27.7)#879 |
| 26. | Oxford | 38.1% | 66.8%(-28.7)#26 | 64.8%(-26.7)#959 |
| 27. | Mitiwanga | 38.1% | 66.8%(-28.7)#27 | 64.8%(-26.7)#965 |
| 28. | Ithaca | 38.2% | 66.8%(-28.6)#28 | 64.8%(-26.6)#968 |
| 29. | Linndale | 38.2% | 66.8%(-28.6)#29 | 64.8%(-26.6)#972 |
| 30. | Owensville | 38.4% | 66.8%(-28.4)#30 | 64.8%(-26.4)#994 |
| 31. | Warrensville Heights | 38.5% | 66.8%(-28.3)#31 | 64.8%(-26.3)#1,004 |
| 32. | Portage | 39.1% | 66.8%(-27.7)#32 | 64.8%(-25.7)#1,053 |
| 33. | Cincinnati | 39.3% | 66.8%(-27.5)#33 | 64.8%(-25.5)#1,075 |
| 34. | Peebles | 39.5% | 66.8%(-27.3)#34 | 64.8%(-25.3)#1,087 |
| 35. | Jeffersonville | 40.5% | 66.8%(-26.3)#35 | 64.8%(-24.3)#1,195 |
| 36. | Burlington | 40.6% | 66.8%(-26.3)#36 | 64.8%(-24.2)#1,204 |
| 37. | Cleveland | 40.9% | 66.8%(-25.9)#37 | 64.8%(-23.9)#1,243 |
| 38. | Addyston | 41.2% | 66.8%(-25.6)#38 | 64.8%(-23.6)#1,267 |
| 39. | Whitehall | 41.2% | 66.8%(-25.6)#39 | 64.8%(-23.6)#1,272 |
| 40. | Flat Rock | 42.1% | 66.8%(-24.8)#40 | 64.8%(-22.8)#1,362 |
| 41. | Zanesville | 42.1% | 66.8%(-24.7)#41 | 64.8%(-22.7)#1,377 |
| 42. | Gann Brinkhaven | 42.3% | 66.8%(-24.6)#42 | 64.8%(-22.6)#1,394 |
| 43. | Carbon Hill | 42.3% | 66.8%(-24.5)#43 | 64.8%(-22.5)#1,405 |
| 44. | Whites Landing | 42.6% | 66.8%(-24.2)#44 | 64.8%(-22.2)#1,447 |
| 45. | Piketon | 42.7% | 66.8%(-24.2)#45 | 64.8%(-22.2)#1,453 |
| 46. | Kent | 42.7% | 66.8%(-24.1)#46 | 64.8%(-22.1)#1,464 |
| 47. | New Springfield | 42.8% | 66.8%(-24.0)#47 | 64.8%(-22.0)#1,473 |
| 48. | Nelsonville | 42.8% | 66.8%(-24.0)#48 | 64.8%(-22.0)#1,475 |
| 49. | Atwater | 43.2% | 66.8%(-23.6)#49 | 64.8%(-21.6)#1,515 |
| 50. | Brice | 43.2% | 66.8%(-23.6)#50 | 64.8%(-21.6)#1,516 |
| 51. | Bedford Heights | 43.6% | 66.8%(-23.2)#51 | 64.8%(-21.2)#1,570 |
| 52. | Euclid | 43.7% | 66.8%(-23.1)#52 | 64.8%(-21.1)#1,594 |
| 53. | Lakewood | 43.8% | 66.8%(-23.0)#53 | 64.8%(-21.0)#1,608 |
| 54. | Beaver | 44.0% | 66.8%(-22.8)#54 | 64.8%(-20.8)#1,638 |
| 55. | Willoughby Hills | 44.3% | 66.8%(-22.5)#55 | 64.8%(-20.5)#1,673 |
| 56. | Columbus | 44.7% | 66.8%(-22.1)#56 | 64.8%(-20.1)#1,752 |
| 57. | Bolton | 44.8% | 66.8%(-22.0)#57 | 64.8%(-20.0)#1,763 |
| 58. | Hemlock | 44.9% | 66.8%(-21.9)#58 | 64.8%(-19.9)#1,780 |
| 59. | Mount Healthy | 45.1% | 66.8%(-21.8)#59 | 64.8%(-19.8)#1,810 |
| 60. | Utica | 45.3% | 66.8%(-21.5)#60 | 64.8%(-19.5)#1,842 |
| 61. | Mayfield Heights | 45.3% | 66.8%(-21.5)#61 | 64.8%(-19.5)#1,845 |
| 62. | Celeryville | 45.3% | 66.8%(-21.5)#62 | 64.8%(-19.5)#1,847 |
| 63. | West Union | 45.3% | 66.8%(-21.5)#63 | 64.8%(-19.5)#1,849 |
| 64. | Withamsville | 45.4% | 66.8%(-21.4)#64 | 64.8%(-19.4)#1,864 |
| 65. | Orwell | 45.4% | 66.8%(-21.4)#65 | 64.8%(-19.4)#1,866 |
| 66. | Elmwood Place | 45.7% | 66.8%(-21.1)#66 | 64.8%(-19.1)#1,909 |
| 67. | Newburgh Heights | 45.8% | 66.8%(-21.0)#67 | 64.8%(-19.0)#1,920 |
| 68. | Olde West Chester | 46.0% | 66.8%(-20.8)#68 | 64.8%(-18.8)#1,949 |
| 69. | Tippecanoe | 46.3% | 66.8%(-20.5)#69 | 64.8%(-18.5)#2,005 |
| 70. | Norwood | 46.4% | 66.8%(-20.4)#70 | 64.8%(-18.4)#2,014 |
| 71. | Lima | 46.6% | 66.8%(-20.2)#71 | 64.8%(-18.2)#2,062 |
| 72. | Mckinley Heights | 46.7% | 66.8%(-20.2)#72 | 64.8%(-18.2)#2,069 |
| 73. | Portsmouth | 47.5% | 66.8%(-19.3)#73 | 64.8%(-17.3)#2,251 |
| 74. | Minford | 47.6% | 66.8%(-19.2)#74 | 64.8%(-17.2)#2,272 |
| 75. | Mechanicsburg | 47.8% | 66.8%(-19.1)#75 | 64.8%(-17.0)#2,309 |
| 76. | Old Washington | 47.8% | 66.8%(-19.0)#76 | 64.8%(-17.0)#2,314 |
| 77. | Cambridge | 47.9% | 66.8%(-19.0)#77 | 64.8%(-17.0)#2,331 |
| 78. | Alliance | 48.0% | 66.8%(-18.8)#78 | 64.8%(-16.8)#2,355 |
| 79. | Greenfield | 48.1% | 66.8%(-18.7)#79 | 64.8%(-16.7)#2,377 |
| 80. | Painesville | 48.2% | 66.8%(-18.6)#80 | 64.8%(-16.6)#2,399 |
| 81. | Canton | 48.2% | 66.8%(-18.6)#81 | 64.8%(-16.6)#2,400 |
| 82. | Ashley | 48.3% | 66.8%(-18.5)#82 | 64.8%(-16.5)#2,426 |
| 83. | Dayton | 48.4% | 66.8%(-18.5)#83 | 64.8%(-16.5)#2,433 |
| 84. | Fairborn | 48.6% | 66.8%(-18.3)#84 | 64.8%(-16.3)#2,482 |
| 85. | Clarksburg | 48.7% | 66.8%(-18.1)#85 | 64.8%(-16.1)#2,525 |
| 86. | New Lexington | 48.9% | 66.8%(-17.9)#86 | 64.8%(-15.9)#2,571 |
| 87. | Mantua | 48.9% | 66.8%(-17.9)#87 | 64.8%(-15.9)#2,586 |
| 88. | West Logan | 49.0% | 66.8%(-17.9)#88 | 64.8%(-15.9)#2,603 |
| 89. | Milford | 49.0% | 66.8%(-17.8)#89 | 64.8%(-15.8)#2,609 |
| 90. | Sebring | 49.1% | 66.8%(-17.7)#90 | 64.8%(-15.7)#2,646 |
| 91. | Bentonville | 49.2% | 66.8%(-17.6)#91 | 64.8%(-15.6)#2,667 |
| 92. | Orangeville | 49.2% | 66.8%(-17.6)#92 | 64.8%(-15.6)#2,672 |
| 93. | Dennison | 49.3% | 66.8%(-17.5)#93 | 64.8%(-15.5)#2,679 |
| 94. | Manchester | 49.4% | 66.8%(-17.5)#94 | 64.8%(-15.5)#2,700 |
| 95. | New Miami | 49.7% | 66.8%(-17.1)#95 | 64.8%(-15.1)#2,782 |
| 96. | Waverly | 49.9% | 66.8%(-17.0)#96 | 64.8%(-15.0)#2,820 |
| 97. | Elizabethtown | 50.0% | 66.8%(-16.8)#97 | 64.8%(-14.8)#2,862 |
| 98. | Hessville | 50.0% | 66.8%(-16.8)#98 | 64.8%(-14.8)#2,890 |
| 99. | Akron | 50.0% | 66.8%(-16.8)#99 | 64.8%(-14.8)#2,924 |
| 100. | Mansfield | 50.2% | 66.8%(-16.7)#100 | 64.8%(-14.7)#2,939 |
Common Questions
What are the Top 10 Cities with the Lowest Percentage of Owner-Occupied Units in Ohio?
Top 10 Cities with the Lowest Percentage of Owner-Occupied Units in Ohio are:
#1
0.73%
#2
19.3%
#3
22.9%
#4
24.4%
#5
24.5%
#6
25.3%
#7
26.3%
#8
26.8%
#9
27.2%
#10
28.9%
What city has the Lowest Percentage of Owner-Occupied Units in Ohio?
Wright Patterson AFB has the Lowest Percentage of Owner-Occupied Units in Ohio with 0.73%.
What is the Percentage of Owner-Occupied Units in the State of Ohio?
Percentage of Owner-Occupied Units in Ohio is 66.8%.
What is the Percentage of Owner-Occupied Units in the United States?
Percentage of Owner-Occupied Units in the United States is 64.8%.