Cities with the Lowest Percentage of Owner-Occupied Units in Connecticut
RELATED REPORTS & OPTIONS
Lowest Owner-Occupied
Connecticut
Compare Cities
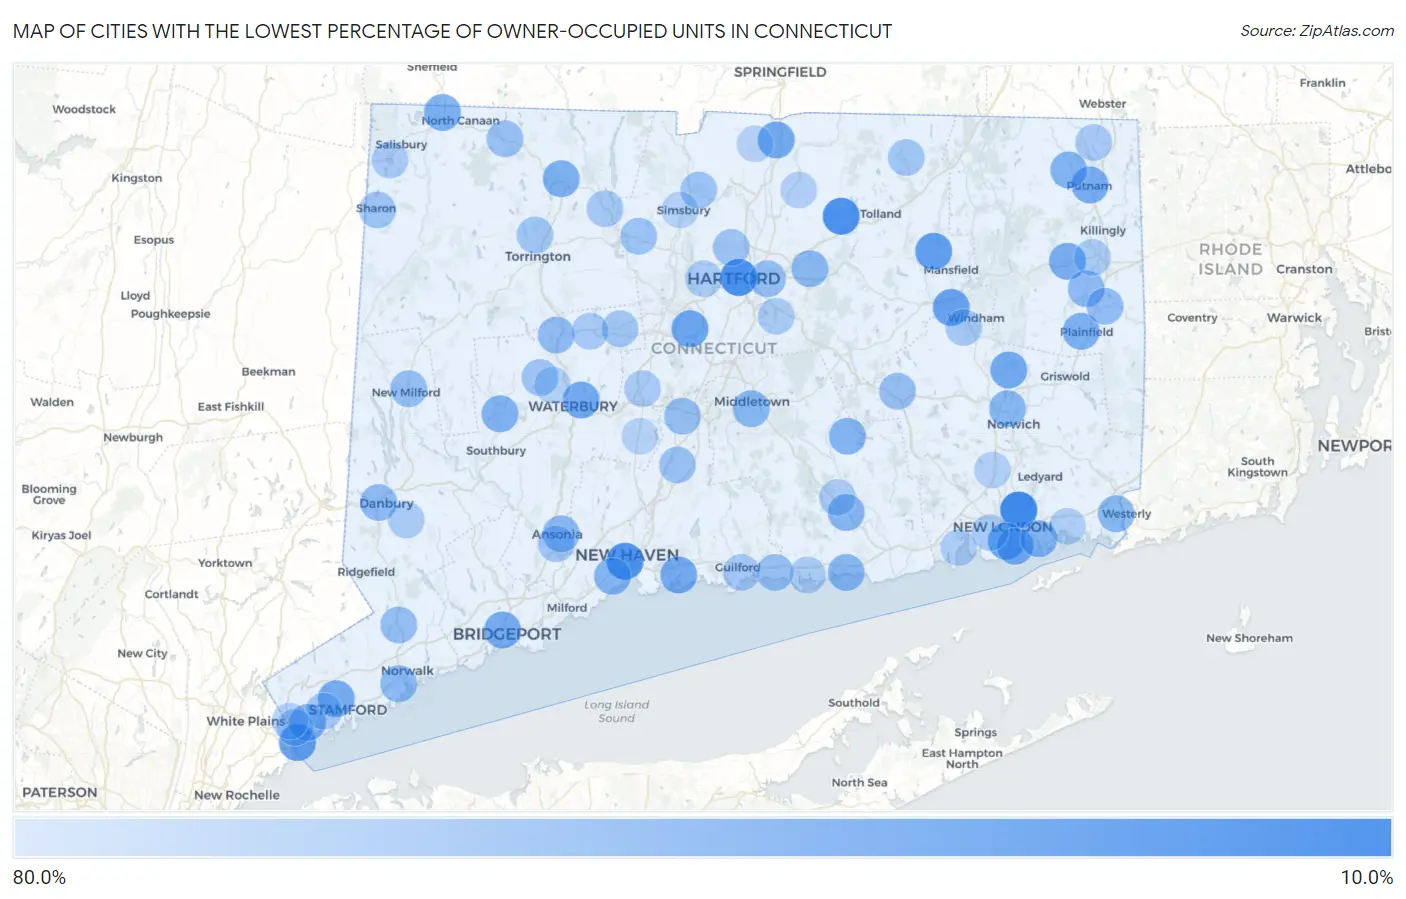
Map of Cities with the Lowest Percentage of Owner-Occupied Units in Connecticut
80.0%
0.0%
Cities with the Lowest Percentage of Owner-Occupied Units in Connecticut
| City | % Owner-Occupied | vs State | vs National | |
| 1. | Branchville | 17.7% | 66.2%(-48.4)#1 | 64.8%(-47.1)#173 |
| 2. | Conning Towers Nautilus Park | 21.4% | 66.2%(-44.7)#2 | 64.8%(-43.4)#240 |
| 3. | Hartford | 25.6% | 66.2%(-40.5)#3 | 64.8%(-39.2)#332 |
| 4. | Rockville | 26.9% | 66.2%(-39.2)#4 | 64.8%(-37.9)#363 |
| 5. | New Haven | 28.6% | 66.2%(-37.5)#5 | 64.8%(-36.2)#424 |
| 6. | Jewett City Borough | 35.6% | 66.2%(-30.6)#6 | 64.8%(-29.2)#761 |
| 7. | Storrs | 36.3% | 66.2%(-29.8)#7 | 64.8%(-28.5)#811 |
| 8. | Byram | 36.8% | 66.2%(-29.4)#8 | 64.8%(-28.0)#850 |
| 9. | Willimantic | 39.2% | 66.2%(-27.0)#9 | 64.8%(-25.6)#1,060 |
| 10. | Danielson Borough | 40.3% | 66.2%(-25.8)#10 | 64.8%(-24.5)#1,181 |
| 11. | New London | 41.1% | 66.2%(-25.1)#11 | 64.8%(-23.7)#1,261 |
| 12. | New Britain | 41.3% | 66.2%(-24.8)#12 | 64.8%(-23.5)#1,285 |
| 13. | Bantam Borough | 42.8% | 66.2%(-23.4)#13 | 64.8%(-22.0)#1,468 |
| 14. | Thompsonville | 43.6% | 66.2%(-22.6)#14 | 64.8%(-21.2)#1,572 |
| 15. | Baltic | 43.8% | 66.2%(-22.3)#15 | 64.8%(-21.0)#1,609 |
| 16. | Mechanicsville | 43.8% | 66.2%(-22.3)#16 | 64.8%(-21.0)#1,616 |
| 17. | Waterbury | 43.8% | 66.2%(-22.3)#17 | 64.8%(-21.0)#1,618 |
| 18. | Branford Center | 44.9% | 66.2%(-21.2)#18 | 64.8%(-19.9)#1,791 |
| 19. | Bridgeport | 45.2% | 66.2%(-20.9)#19 | 64.8%(-19.6)#1,837 |
| 20. | Groton | 45.3% | 66.2%(-20.9)#20 | 64.8%(-19.5)#1,841 |
| 21. | Sherman | 45.5% | 66.2%(-20.7)#21 | 64.8%(-19.4)#1,876 |
| 22. | Stamford | 46.0% | 66.2%(-20.1)#22 | 64.8%(-18.8)#1,954 |
| 23. | Brooklyn | 46.3% | 66.2%(-19.8)#23 | 64.8%(-18.5)#2,002 |
| 24. | Putnam | 46.3% | 66.2%(-19.8)#24 | 64.8%(-18.5)#2,004 |
| 25. | Dayville | 46.9% | 66.2%(-19.3)#25 | 64.8%(-17.9)#2,118 |
| 26. | Hawleyville | 47.4% | 66.2%(-18.8)#26 | 64.8%(-17.4)#2,219 |
| 27. | Winsted | 48.5% | 66.2%(-17.7)#27 | 64.8%(-16.4)#2,458 |
| 28. | Canaan | 48.6% | 66.2%(-17.6)#28 | 64.8%(-16.2)#2,491 |
| 29. | Plainfield Village | 48.7% | 66.2%(-17.5)#29 | 64.8%(-16.1)#2,511 |
| 30. | Woodbury Center | 49.9% | 66.2%(-16.2)#30 | 64.8%(-14.9)#2,835 |
| 31. | West Cornwall | 50.0% | 66.2%(-16.2)#31 | 64.8%(-14.8)#2,892 |
| 32. | Greenwich | 50.8% | 66.2%(-15.3)#32 | 64.8%(-14.0)#3,091 |
| 33. | South Woodstock | 50.9% | 66.2%(-15.3)#33 | 64.8%(-14.0)#3,102 |
| 34. | Poquonock Bridge | 51.5% | 66.2%(-14.7)#34 | 64.8%(-13.3)#3,295 |
| 35. | West Haven | 52.1% | 66.2%(-14.1)#35 | 64.8%(-12.7)#3,469 |
| 36. | Moodus | 52.4% | 66.2%(-13.8)#36 | 64.8%(-12.5)#3,565 |
| 37. | Stonington Borough | 52.9% | 66.2%(-13.2)#37 | 64.8%(-11.9)#3,765 |
| 38. | Deep River Center | 53.1% | 66.2%(-13.1)#38 | 64.8%(-11.7)#3,818 |
| 39. | Westbrook Center | 53.2% | 66.2%(-12.9)#39 | 64.8%(-11.6)#3,864 |
| 40. | Manchester | 53.8% | 66.2%(-12.4)#40 | 64.8%(-11.0)#4,025 |
| 41. | Ansonia | 53.9% | 66.2%(-12.2)#41 | 64.8%(-10.9)#4,067 |
| 42. | Pawcatuck | 53.9% | 66.2%(-12.2)#42 | 64.8%(-10.9)#4,084 |
| 43. | Middletown | 54.1% | 66.2%(-12.0)#43 | 64.8%(-10.7)#4,158 |
| 44. | Norwich | 54.3% | 66.2%(-11.8)#44 | 64.8%(-10.5)#4,227 |
| 45. | Norwalk | 54.8% | 66.2%(-11.3)#45 | 64.8%(-9.97)#4,403 |
| 46. | Danbury | 55.9% | 66.2%(-10.2)#46 | 64.8%(-8.90)#4,788 |
| 47. | Thomaston | 56.5% | 66.2%(-9.68)#47 | 64.8%(-8.35)#5,031 |
| 48. | Wauregan | 56.8% | 66.2%(-9.37)#48 | 64.8%(-8.03)#5,141 |
| 49. | Route 7 Gateway | 57.5% | 66.2%(-8.69)#49 | 64.8%(-7.36)#5,424 |
| 50. | Moosup | 58.3% | 66.2%(-7.84)#50 | 64.8%(-6.50)#5,788 |
| 51. | Wilton Center | 59.1% | 66.2%(-7.04)#51 | 64.8%(-5.70)#6,127 |
| 52. | Pleasant Valley | 59.2% | 66.2%(-6.93)#52 | 64.8%(-5.59)#6,168 |
| 53. | New Milford | 59.3% | 66.2%(-6.82)#53 | 64.8%(-5.48)#6,229 |
| 54. | Meriden | 59.5% | 66.2%(-6.68)#54 | 64.8%(-5.35)#6,299 |
| 55. | East Hartford | 59.5% | 66.2%(-6.67)#55 | 64.8%(-5.33)#6,312 |
| 56. | Colchester | 59.9% | 66.2%(-6.26)#56 | 64.8%(-4.93)#6,504 |
| 57. | Madison Center | 60.7% | 66.2%(-5.47)#57 | 64.8%(-4.14)#6,894 |
| 58. | Norfolk | 60.8% | 66.2%(-5.32)#58 | 64.8%(-3.99)#6,959 |
| 59. | Wallingford Center | 61.3% | 66.2%(-4.85)#59 | 64.8%(-3.51)#7,179 |
| 60. | Tariffville | 62.1% | 66.2%(-4.06)#60 | 64.8%(-2.73)#7,543 |
| 61. | Canton Valley | 62.2% | 66.2%(-3.91)#61 | 64.8%(-2.58)#7,630 |
| 62. | Lake Chaffee | 62.9% | 66.2%(-3.29)#62 | 64.8%(-1.96)#7,964 |
| 63. | Sharon | 63.4% | 66.2%(-2.73)#63 | 64.8%(-1.39)#8,277 |
| 64. | Blue Hills | 63.5% | 66.2%(-2.68)#64 | 64.8%(-1.34)#8,313 |
| 65. | Watertown | 63.6% | 66.2%(-2.59)#65 | 64.8%(-1.26)#8,358 |
| 66. | Derby | 63.8% | 66.2%(-2.35)#66 | 64.8%(-1.01)#8,488 |
| 67. | Torrington | 64.0% | 66.2%(-2.15)#67 | 64.8%(-0.815)#8,621 |
| 68. | Bristol | 65.0% | 66.2%(-1.11)#68 | 64.8%(+0.223)#9,169 |
| 69. | Stafford Springs | 65.1% | 66.2%(-1.02)#69 | 64.8%(+0.310)#9,217 |
| 70. | Cornwall Bridge | 65.5% | 66.2%(-0.696)#70 | 64.8%(+0.638)#9,410 |
| 71. | New Canaan | 65.6% | 66.2%(-0.510)#71 | 64.8%(+0.824)#9,501 |
| 72. | Naugatuck Borough | 66.0% | 66.2%(-0.188)#72 | 64.8%(+1.15)#9,682 |
| 73. | Cos Cob | 66.0% | 66.2%(-0.110)#73 | 64.8%(+1.22)#9,725 |
| 74. | Guilford Center | 66.1% | 66.2%(-0.074)#74 | 64.8%(+1.26)#9,744 |
| 75. | Pemberwick | 66.5% | 66.2%(+0.311)#75 | 64.8%(+1.64)#9,943 |
| 76. | New Hartford Center | 66.6% | 66.2%(+0.405)#76 | 64.8%(+1.74)#9,986 |
| 77. | South Windham | 67.4% | 66.2%(+1.22)#77 | 64.8%(+2.56)#10,527 |
| 78. | Terryville | 67.8% | 66.2%(+1.65)#78 | 64.8%(+2.99)#10,789 |
| 79. | Lakeville | 67.8% | 66.2%(+1.70)#79 | 64.8%(+3.03)#10,818 |
| 80. | Plantsville | 68.0% | 66.2%(+1.89)#80 | 64.8%(+3.22)#10,924 |
| 81. | North Grosvenor Dale | 68.2% | 66.2%(+2.06)#81 | 64.8%(+3.39)#11,026 |
| 82. | Bogus Hill | 68.3% | 66.2%(+2.14)#82 | 64.8%(+3.48)#11,072 |
| 83. | Glastonbury Center | 68.5% | 66.2%(+2.36)#83 | 64.8%(+3.70)#11,208 |
| 84. | Waterford | 68.6% | 66.2%(+2.43)#84 | 64.8%(+3.77)#11,248 |
| 85. | West Hartford | 68.6% | 66.2%(+2.45)#85 | 64.8%(+3.79)#11,257 |
| 86. | Bethel | 68.7% | 66.2%(+2.52)#86 | 64.8%(+3.85)#11,286 |
| 87. | Chester Center | 68.7% | 66.2%(+2.55)#87 | 64.8%(+3.88)#11,308 |
| 88. | East Brooklyn | 68.7% | 66.2%(+2.59)#88 | 64.8%(+3.93)#11,332 |
| 89. | Clinton | 68.8% | 66.2%(+2.63)#89 | 64.8%(+3.96)#11,356 |
| 90. | Niantic | 69.5% | 66.2%(+3.30)#90 | 64.8%(+4.64)#11,789 |
| 91. | Mystic | 70.5% | 66.2%(+4.31)#91 | 64.8%(+5.64)#12,436 |
| 92. | Stratford Downtown | 70.5% | 66.2%(+4.35)#92 | 64.8%(+5.68)#12,464 |
| 93. | Broad Brook | 71.2% | 66.2%(+5.06)#93 | 64.8%(+6.39)#12,966 |
| 94. | Oxoboxo River | 71.7% | 66.2%(+5.59)#94 | 64.8%(+6.92)#13,317 |
| 95. | Glenville | 72.1% | 66.2%(+5.93)#95 | 64.8%(+7.26)#13,541 |
| 96. | Oakville | 72.5% | 66.2%(+6.33)#96 | 64.8%(+7.67)#13,818 |
| 97. | Simsbury Center | 73.0% | 66.2%(+6.81)#97 | 64.8%(+8.14)#14,143 |
| 98. | Cheshire Village | 73.0% | 66.2%(+6.86)#98 | 64.8%(+8.19)#14,185 |
| 99. | South Wilton | 73.4% | 66.2%(+7.27)#99 | 64.8%(+8.61)#14,469 |
| 100. | Suffield Depot | 73.5% | 66.2%(+7.35)#100 | 64.8%(+8.68)#14,519 |
Common Questions
What are the Top 10 Cities with the Lowest Percentage of Owner-Occupied Units in Connecticut?
Top 10 Cities with the Lowest Percentage of Owner-Occupied Units in Connecticut are:
#1
21.4%
#2
25.6%
#3
26.9%
#4
28.6%
#5
36.3%
#6
36.8%
#7
39.2%
#8
41.1%
#9
41.3%
#10
43.6%
What city has the Lowest Percentage of Owner-Occupied Units in Connecticut?
Conning Towers Nautilus Park has the Lowest Percentage of Owner-Occupied Units in Connecticut with 21.4%.
What is the Percentage of Owner-Occupied Units in the State of Connecticut?
Percentage of Owner-Occupied Units in Connecticut is 66.2%.
What is the Percentage of Owner-Occupied Units in the United States?
Percentage of Owner-Occupied Units in the United States is 64.8%.