Cities with the Largest South African Community in Pennsylvania
RELATED REPORTS & OPTIONS
South African
Pennsylvania
Compare Cities
Map of Cities with the Largest South African Community in Pennsylvania
0
250
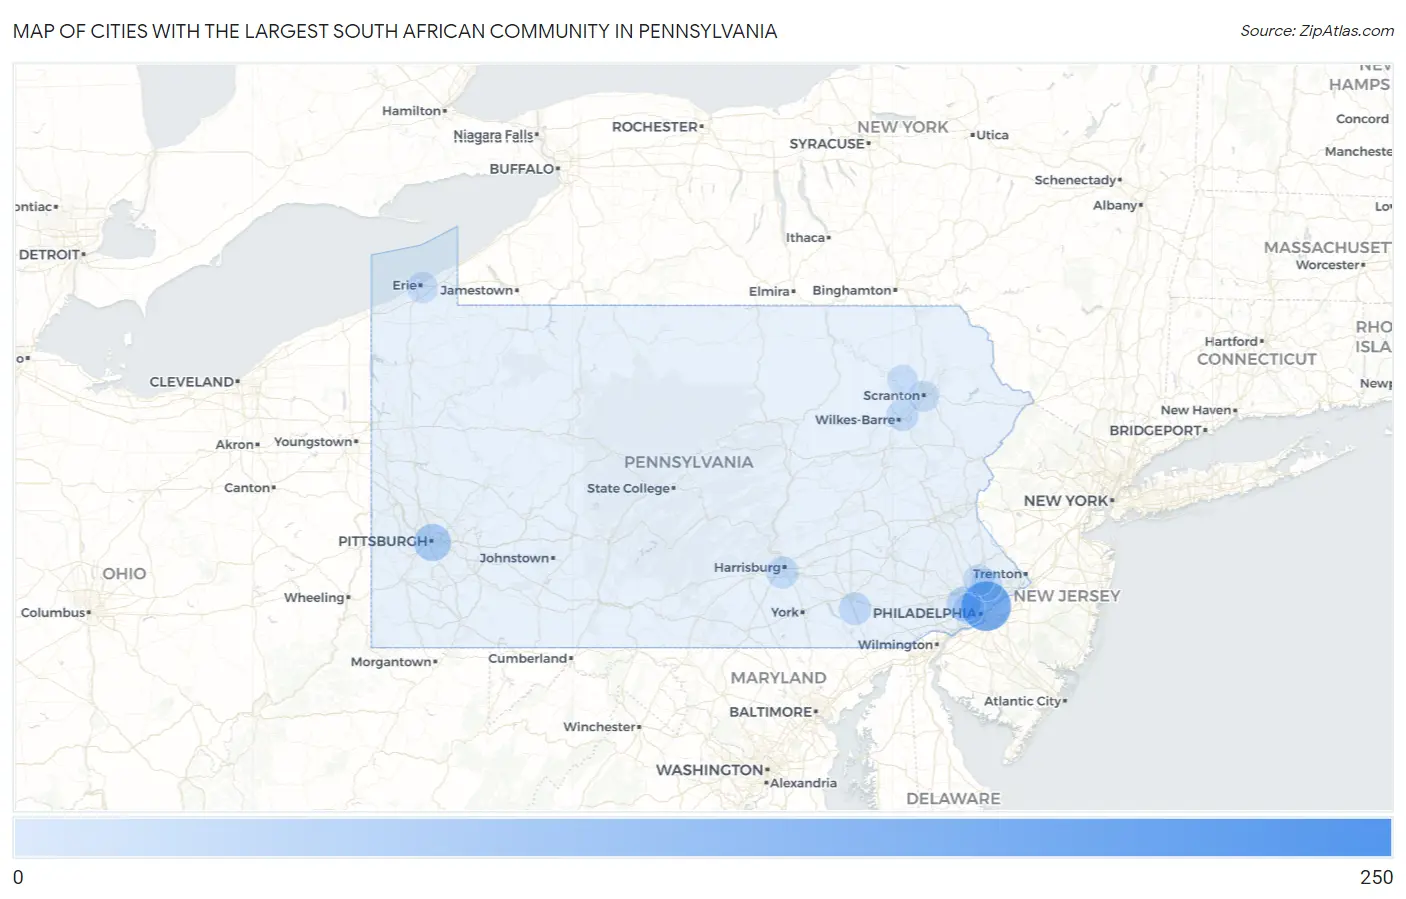
Cities with the Largest South African Community in Pennsylvania
| City | South African | vs State | vs National | |
| 1. | Ambler Borough | 213 | 2,193(9.71%)#1 | 79,446(0.27%)#34 |
| 2. | Philadelphia | 150 | 2,193(6.84%)#2 | 79,446(0.19%)#67 |
| 3. | Rosemont | 77 | 2,193(3.51%)#3 | 79,446(0.10%)#202 |
| 4. | Pittsburgh | 53 | 2,193(2.42%)#4 | 79,446(0.07%)#295 |
| 5. | Plum Borough | 46 | 2,193(2.10%)#5 | 79,446(0.06%)#337 |
| 6. | West Chester Borough | 41 | 2,193(1.87%)#6 | 79,446(0.05%)#377 |
| 7. | Wyomissing Borough | 40 | 2,193(1.82%)#7 | 79,446(0.05%)#386 |
| 8. | Franklin Park Borough | 35 | 2,193(1.60%)#8 | 79,446(0.04%)#443 |
| 9. | Bryn Mawr | 33 | 2,193(1.50%)#9 | 79,446(0.04%)#470 |
| 10. | Bala Cynwyd | 28 | 2,193(1.28%)#10 | 79,446(0.04%)#535 |
| 11. | St. Davids | 25 | 2,193(1.14%)#11 | 79,446(0.03%)#589 |
| 12. | Carlisle Borough | 21 | 2,193(0.96%)#12 | 79,446(0.03%)#653 |
| 13. | Willow Street | 19 | 2,193(0.87%)#13 | 79,446(0.02%)#692 |
| 14. | Forest Hills Borough | 19 | 2,193(0.87%)#14 | 79,446(0.02%)#694 |
| 15. | Gettysburg Borough | 17 | 2,193(0.78%)#15 | 79,446(0.02%)#744 |
| 16. | Lower Allen | 16 | 2,193(0.73%)#16 | 79,446(0.02%)#775 |
| 17. | Willow Grove | 15 | 2,193(0.68%)#17 | 79,446(0.02%)#805 |
| 18. | Elizabethtown Borough | 15 | 2,193(0.68%)#18 | 79,446(0.02%)#808 |
| 19. | Plains | 15 | 2,193(0.68%)#19 | 79,446(0.02%)#815 |
| 20. | Dormont Borough | 13 | 2,193(0.59%)#20 | 79,446(0.02%)#877 |
| 21. | West View Borough | 11 | 2,193(0.50%)#21 | 79,446(0.01%)#961 |
| 22. | Penn Wynne | 11 | 2,193(0.50%)#22 | 79,446(0.01%)#962 |
| 23. | Maple Glen | 9 | 2,193(0.41%)#23 | 79,446(0.01%)#1,047 |
| 24. | Harmony Borough | 9 | 2,193(0.41%)#24 | 79,446(0.01%)#1,056 |
| 25. | Erie | 8 | 2,193(0.36%)#25 | 79,446(0.01%)#1,064 |
| 26. | Dunmore Borough | 7 | 2,193(0.32%)#26 | 79,446(0.01%)#1,122 |
| 27. | Grove City Borough | 7 | 2,193(0.32%)#27 | 79,446(0.01%)#1,129 |
| 28. | Scranton | 6 | 2,193(0.27%)#28 | 79,446(0.01%)#1,149 |
| 29. | Oakmont Borough | 5 | 2,193(0.23%)#29 | 79,446(0.01%)#1,211 |
| 30. | Stewartstown Borough | 4 | 2,193(0.18%)#30 | 79,446(0.01%)#1,255 |
| 31. | East Bangor Borough | 4 | 2,193(0.18%)#31 | 79,446(0.01%)#1,265 |
| 32. | Lake Winola | 4 | 2,193(0.18%)#32 | 79,446(0.01%)#1,271 |
| 33. | Franklintown Borough | 4 | 2,193(0.18%)#33 | 79,446(0.01%)#1,275 |
| 34. | Emlenton Borough | 3 | 2,193(0.14%)#34 | 79,446(0.00%)#1,318 |
| 35. | Cooperstown Borough | 2 | 2,193(0.09%)#35 | 79,446(0.00%)#1,353 |
Common Questions
What are the Top 10 Cities with the Largest South African Community in Pennsylvania?
Top 10 Cities with the Largest South African Community in Pennsylvania are:
#1
150
#2
53
#3
33
#4
19
#5
16
#6
15
#7
15
#8
11
#9
9
#10
8
What city has the Largest South African Community in Pennsylvania?
Philadelphia has the Largest South African Community in Pennsylvania with 150.
What is the Total South African Population in the State of Pennsylvania?
Total South African Population in Pennsylvania is 2,193.
What is the Total South African Population in the United States?
Total South African Population in the United States is 79,446.