Cities with the Largest Korean Community in New York
RELATED REPORTS & OPTIONS
Korean
New York
Compare Cities
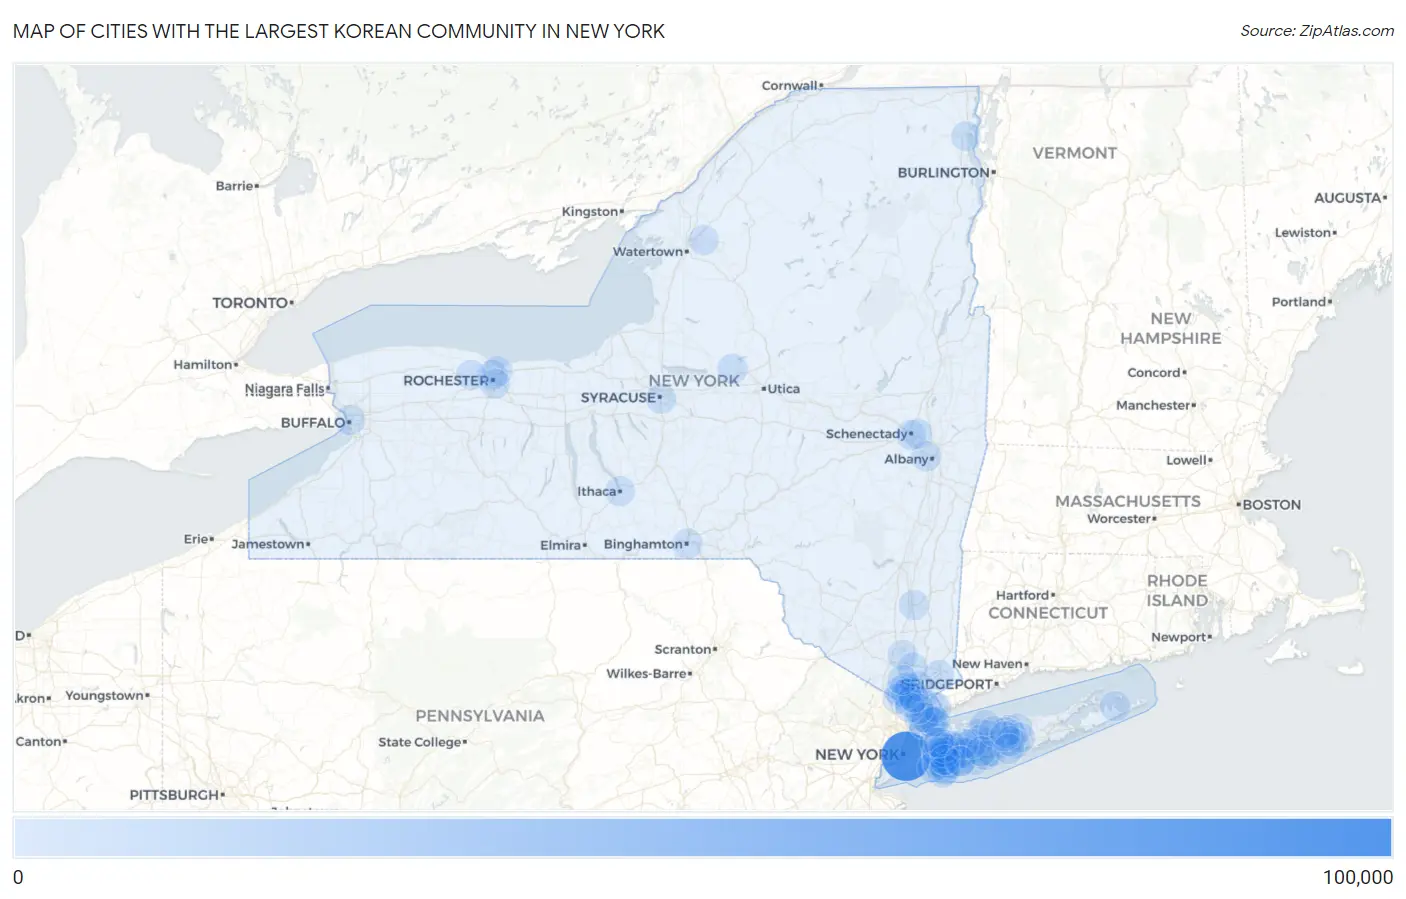
Map of Cities with the Largest Korean Community in New York
0
100,000
Cities with the Largest Korean Community in New York
| City | Korean | vs State | vs National | |
| 1. | New York | 94,904 | 159,585(59.47%)#1 | 4,337,256(2.19%)#2 |
| 2. | Yonkers | 3,224 | 159,585(2.02%)#2 | 4,337,256(0.07%)#205 |
| 3. | Valley Stream | 1,328 | 159,585(0.83%)#3 | 4,337,256(0.03%)#470 |
| 4. | New Rochelle | 1,157 | 159,585(0.73%)#4 | 4,337,256(0.03%)#540 |
| 5. | Franklin Square | 1,130 | 159,585(0.71%)#5 | 4,337,256(0.03%)#552 |
| 6. | Long Beach | 1,083 | 159,585(0.68%)#6 | 4,337,256(0.02%)#572 |
| 7. | New City | 996 | 159,585(0.62%)#7 | 4,337,256(0.02%)#612 |
| 8. | East Meadow | 979 | 159,585(0.61%)#8 | 4,337,256(0.02%)#621 |
| 9. | Albany | 946 | 159,585(0.59%)#9 | 4,337,256(0.02%)#637 |
| 10. | Elmont | 712 | 159,585(0.45%)#10 | 4,337,256(0.02%)#811 |
| 11. | Rochester | 683 | 159,585(0.43%)#11 | 4,337,256(0.02%)#837 |
| 12. | Buffalo | 600 | 159,585(0.38%)#12 | 4,337,256(0.01%)#933 |
| 13. | Port Washington | 578 | 159,585(0.36%)#13 | 4,337,256(0.01%)#965 |
| 14. | Hicksville | 570 | 159,585(0.36%)#14 | 4,337,256(0.01%)#977 |
| 15. | White Plains | 566 | 159,585(0.35%)#15 | 4,337,256(0.01%)#983 |
| 16. | Fort Drum | 564 | 159,585(0.35%)#16 | 4,337,256(0.01%)#987 |
| 17. | Valley Cottage | 556 | 159,585(0.35%)#17 | 4,337,256(0.01%)#999 |
| 18. | Levittown | 530 | 159,585(0.33%)#18 | 4,337,256(0.01%)#1,039 |
| 19. | Mineola | 523 | 159,585(0.33%)#19 | 4,337,256(0.01%)#1,051 |
| 20. | Centereach | 440 | 159,585(0.28%)#20 | 4,337,256(0.01%)#1,202 |
| 21. | Albertson | 431 | 159,585(0.27%)#21 | 4,337,256(0.01%)#1,223 |
| 22. | Eastchester | 423 | 159,585(0.27%)#22 | 4,337,256(0.01%)#1,242 |
| 23. | Brentwood | 422 | 159,585(0.26%)#23 | 4,337,256(0.01%)#1,243 |
| 24. | Tarrytown | 416 | 159,585(0.26%)#24 | 4,337,256(0.01%)#1,253 |
| 25. | Nanuet | 415 | 159,585(0.26%)#25 | 4,337,256(0.01%)#1,257 |
| 26. | West Hempstead | 415 | 159,585(0.26%)#26 | 4,337,256(0.01%)#1,258 |
| 27. | Congers | 403 | 159,585(0.25%)#27 | 4,337,256(0.01%)#1,280 |
| 28. | Hewlett | 390 | 159,585(0.24%)#28 | 4,337,256(0.01%)#1,310 |
| 29. | Lynbrook | 379 | 159,585(0.24%)#29 | 4,337,256(0.01%)#1,330 |
| 30. | North Valley Stream | 373 | 159,585(0.23%)#30 | 4,337,256(0.01%)#1,343 |
| 31. | Salisbury | 367 | 159,585(0.23%)#31 | 4,337,256(0.01%)#1,364 |
| 32. | Bedford Hills | 363 | 159,585(0.23%)#32 | 4,337,256(0.01%)#1,379 |
| 33. | Westbury | 355 | 159,585(0.22%)#33 | 4,337,256(0.01%)#1,403 |
| 34. | South Farmingdale | 353 | 159,585(0.22%)#34 | 4,337,256(0.01%)#1,409 |
| 35. | Coram | 350 | 159,585(0.22%)#35 | 4,337,256(0.01%)#1,416 |
| 36. | Commack | 348 | 159,585(0.22%)#36 | 4,337,256(0.01%)#1,419 |
| 37. | Baldwin | 340 | 159,585(0.21%)#37 | 4,337,256(0.01%)#1,444 |
| 38. | Bay Shore | 336 | 159,585(0.21%)#38 | 4,337,256(0.01%)#1,461 |
| 39. | Irondequoit | 333 | 159,585(0.21%)#39 | 4,337,256(0.01%)#1,469 |
| 40. | Floral Park | 333 | 159,585(0.21%)#40 | 4,337,256(0.01%)#1,471 |
| 41. | Oceanside | 330 | 159,585(0.21%)#41 | 4,337,256(0.01%)#1,476 |
| 42. | Mount Vernon | 325 | 159,585(0.20%)#42 | 4,337,256(0.01%)#1,496 |
| 43. | Niskayuna | 322 | 159,585(0.20%)#43 | 4,337,256(0.01%)#1,509 |
| 44. | Elwood | 305 | 159,585(0.19%)#44 | 4,337,256(0.01%)#1,566 |
| 45. | Latham | 304 | 159,585(0.19%)#45 | 4,337,256(0.01%)#1,570 |
| 46. | Syracuse | 298 | 159,585(0.19%)#46 | 4,337,256(0.01%)#1,588 |
| 47. | Ossining | 291 | 159,585(0.18%)#47 | 4,337,256(0.01%)#1,620 |
| 48. | Hillcrest | 290 | 159,585(0.18%)#48 | 4,337,256(0.01%)#1,626 |
| 49. | Farmingville | 283 | 159,585(0.18%)#49 | 4,337,256(0.01%)#1,657 |
| 50. | Binghamton | 275 | 159,585(0.17%)#50 | 4,337,256(0.01%)#1,684 |
| 51. | Roessleville | 267 | 159,585(0.17%)#51 | 4,337,256(0.01%)#1,723 |
| 52. | Medford | 265 | 159,585(0.17%)#52 | 4,337,256(0.01%)#1,731 |
| 53. | Dix Hills | 264 | 159,585(0.17%)#53 | 4,337,256(0.01%)#1,738 |
| 54. | Seaford | 259 | 159,585(0.16%)#54 | 4,337,256(0.01%)#1,762 |
| 55. | Copiague | 245 | 159,585(0.15%)#55 | 4,337,256(0.01%)#1,835 |
| 56. | North Patchogue | 242 | 159,585(0.15%)#56 | 4,337,256(0.01%)#1,849 |
| 57. | Plainedge | 236 | 159,585(0.15%)#57 | 4,337,256(0.01%)#1,875 |
| 58. | Larchmont | 234 | 159,585(0.15%)#58 | 4,337,256(0.01%)#1,886 |
| 59. | Islip | 228 | 159,585(0.14%)#59 | 4,337,256(0.01%)#1,921 |
| 60. | Lake Grove | 224 | 159,585(0.14%)#60 | 4,337,256(0.01%)#1,946 |
| 61. | Holbrook | 217 | 159,585(0.14%)#61 | 4,337,256(0.01%)#1,978 |
| 62. | Schenectady | 214 | 159,585(0.13%)#62 | 4,337,256(0.00%)#1,996 |
| 63. | Great Neck Plaza | 208 | 159,585(0.13%)#63 | 4,337,256(0.00%)#2,029 |
| 64. | Tuckahoe | 207 | 159,585(0.13%)#64 | 4,337,256(0.00%)#2,039 |
| 65. | West Islip | 206 | 159,585(0.13%)#65 | 4,337,256(0.00%)#2,046 |
| 66. | Melville | 205 | 159,585(0.13%)#66 | 4,337,256(0.00%)#2,063 |
| 67. | Freeport | 204 | 159,585(0.13%)#67 | 4,337,256(0.00%)#2,074 |
| 68. | Rome | 202 | 159,585(0.13%)#68 | 4,337,256(0.00%)#2,089 |
| 69. | Fort Salonga | 199 | 159,585(0.12%)#69 | 4,337,256(0.00%)#2,117 |
| 70. | Inwood | 193 | 159,585(0.12%)#70 | 4,337,256(0.00%)#2,170 |
| 71. | Harrison | 190 | 159,585(0.12%)#71 | 4,337,256(0.00%)#2,191 |
| 72. | Mamaroneck | 190 | 159,585(0.12%)#72 | 4,337,256(0.00%)#2,194 |
| 73. | Orangeburg | 190 | 159,585(0.12%)#73 | 4,337,256(0.00%)#2,199 |
| 74. | Chestnut Ridge | 185 | 159,585(0.12%)#74 | 4,337,256(0.00%)#2,234 |
| 75. | Garden City | 184 | 159,585(0.12%)#75 | 4,337,256(0.00%)#2,241 |
| 76. | West Point | 184 | 159,585(0.12%)#76 | 4,337,256(0.00%)#2,246 |
| 77. | Plattsburgh | 181 | 159,585(0.11%)#77 | 4,337,256(0.00%)#2,259 |
| 78. | Springs | 181 | 159,585(0.11%)#78 | 4,337,256(0.00%)#2,268 |
| 79. | Bardonia | 181 | 159,585(0.11%)#79 | 4,337,256(0.00%)#2,270 |
| 80. | Smithtown | 180 | 159,585(0.11%)#80 | 4,337,256(0.00%)#2,272 |
| 81. | North Babylon | 177 | 159,585(0.11%)#81 | 4,337,256(0.00%)#2,305 |
| 82. | Lake Ronkonkoma | 175 | 159,585(0.11%)#82 | 4,337,256(0.00%)#2,322 |
| 83. | Poughkeepsie | 171 | 159,585(0.11%)#83 | 4,337,256(0.00%)#2,357 |
| 84. | Rochester Institute Of Technology | 171 | 159,585(0.11%)#84 | 4,337,256(0.00%)#2,363 |
| 85. | Brighton | 170 | 159,585(0.11%)#85 | 4,337,256(0.00%)#2,367 |
| 86. | Peekskill | 170 | 159,585(0.11%)#86 | 4,337,256(0.00%)#2,371 |
| 87. | Barnum Island | 168 | 159,585(0.11%)#87 | 4,337,256(0.00%)#2,406 |
| 88. | Ithaca | 166 | 159,585(0.10%)#88 | 4,337,256(0.00%)#2,418 |
| 89. | Williston Park | 165 | 159,585(0.10%)#89 | 4,337,256(0.00%)#2,434 |
| 90. | Dobbs Ferry | 164 | 159,585(0.10%)#90 | 4,337,256(0.00%)#2,443 |
| 91. | Spencerport | 164 | 159,585(0.10%)#91 | 4,337,256(0.00%)#2,450 |
| 92. | Plainview | 163 | 159,585(0.10%)#92 | 4,337,256(0.00%)#2,454 |
| 93. | Tappan | 161 | 159,585(0.10%)#93 | 4,337,256(0.00%)#2,476 |
| 94. | Rockville Centre | 154 | 159,585(0.10%)#94 | 4,337,256(0.00%)#2,547 |
| 95. | Manhasset | 154 | 159,585(0.10%)#95 | 4,337,256(0.00%)#2,555 |
| 96. | De Witt | 153 | 159,585(0.10%)#96 | 4,337,256(0.00%)#2,568 |
| 97. | Sayville | 152 | 159,585(0.10%)#97 | 4,337,256(0.00%)#2,579 |
| 98. | Nyack | 152 | 159,585(0.10%)#98 | 4,337,256(0.00%)#2,583 |
| 99. | Wantagh | 151 | 159,585(0.09%)#99 | 4,337,256(0.00%)#2,589 |
| 100. | Thiells | 151 | 159,585(0.09%)#100 | 4,337,256(0.00%)#2,596 |
Common Questions
What are the Top 10 Cities with the Largest Korean Community in New York?
Top 10 Cities with the Largest Korean Community in New York are:
#1
94,904
#2
3,224
#3
1,328
#4
1,157
#5
1,130
#6
1,083
#7
996
#8
979
#9
946
#10
712
What city has the Largest Korean Community in New York?
New York has the Largest Korean Community in New York with 94,904.
What is the Total Korean Population in the State of New York?
Total Korean Population in New York is 159,585.
What is the Total Korean Population in the United States?
Total Korean Population in the United States is 4,337,256.