Cities with the Lowest Unemployment Rate Amomg Seniors Over the Age of 65 in Indiana
RELATED REPORTS & OPTIONS
Lowest Unemployment | Senior > 65
Indiana
Compare Cities
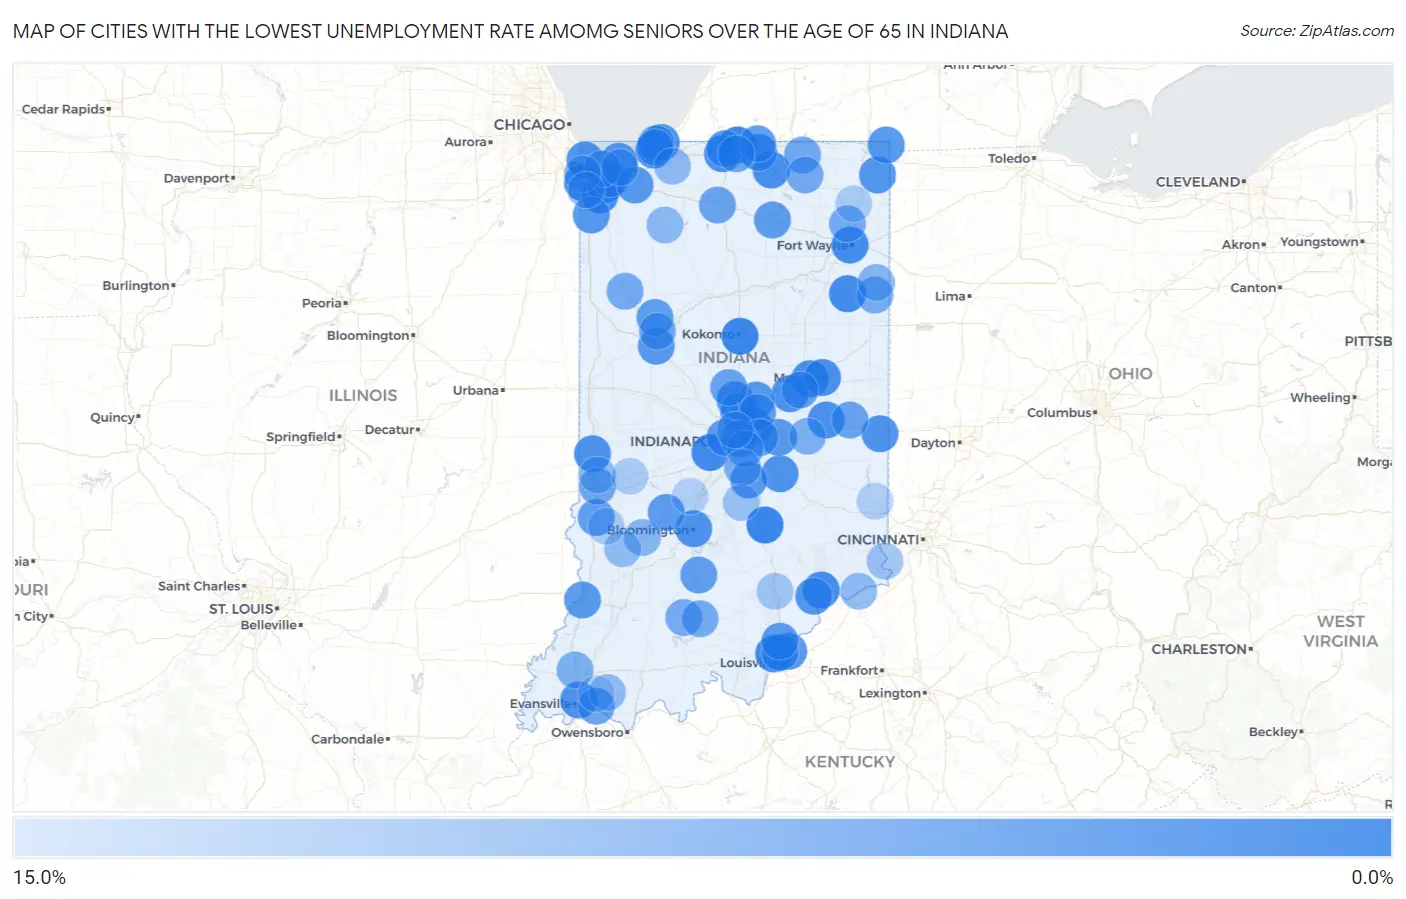
Map of Cities with the Lowest Unemployment Rate Amomg Seniors Over the Age of 65 in Indiana
15.0%
0.0%
Cities with the Lowest Unemployment Rate Amomg Seniors Over the Age of 65 in Indiana
| City | Senior Unemployment | vs State | vs National | |
| 1. | Columbus | 0.50% | 2.9%(-2.40)#1 | 3.9%(-3.40)#51 |
| 2. | Kokomo | 0.70% | 2.9%(-2.20)#2 | 3.9%(-3.20)#107 |
| 3. | Granger | 0.70% | 2.9%(-2.20)#3 | 3.9%(-3.20)#119 |
| 4. | Plainfield | 1.2% | 2.9%(-1.70)#4 | 3.9%(-2.70)#291 |
| 5. | Dyer | 1.2% | 2.9%(-1.70)#5 | 3.9%(-2.70)#312 |
| 6. | New Albany | 1.3% | 2.9%(-1.60)#6 | 3.9%(-2.60)#344 |
| 7. | Crown Point | 1.5% | 2.9%(-1.40)#7 | 3.9%(-2.40)#452 |
| 8. | Michigan City | 1.5% | 2.9%(-1.40)#8 | 3.9%(-2.40)#454 |
| 9. | Bluffton | 1.5% | 2.9%(-1.40)#9 | 3.9%(-2.40)#476 |
| 10. | Fort Wayne | 1.6% | 2.9%(-1.30)#10 | 3.9%(-2.30)#485 |
| 11. | Merrillville | 1.7% | 2.9%(-1.20)#11 | 3.9%(-2.20)#561 |
| 12. | Madison | 1.8% | 2.9%(-1.10)#12 | 3.9%(-2.10)#649 |
| 13. | Yorktown | 1.8% | 2.9%(-1.10)#13 | 3.9%(-2.10)#651 |
| 14. | Goshen | 1.9% | 2.9%(-1.000)#14 | 3.9%(-2.00)#686 |
| 15. | Hobart | 2.1% | 2.9%(-0.800)#15 | 3.9%(-1.80)#813 |
| 16. | South Bend | 2.2% | 2.9%(-0.700)#16 | 3.9%(-1.70)#868 |
| 17. | Anderson | 2.2% | 2.9%(-0.700)#17 | 3.9%(-1.70)#872 |
| 18. | Muncie | 2.3% | 2.9%(-0.600)#18 | 3.9%(-1.60)#941 |
| 19. | New Castle | 2.3% | 2.9%(-0.600)#19 | 3.9%(-1.60)#964 |
| 20. | Westfield | 2.4% | 2.9%(-0.500)#20 | 3.9%(-1.50)#1,018 |
| 21. | Shelbyville | 2.4% | 2.9%(-0.500)#21 | 3.9%(-1.50)#1,039 |
| 22. | Fairview Park | 2.4% | 2.9%(-0.500)#22 | 3.9%(-1.50)#1,075 |
| 23. | Evansville | 2.5% | 2.9%(-0.400)#23 | 3.9%(-1.40)#1,082 |
| 24. | Bloomington | 2.5% | 2.9%(-0.400)#24 | 3.9%(-1.40)#1,085 |
| 25. | Hammond | 2.5% | 2.9%(-0.400)#25 | 3.9%(-1.40)#1,086 |
| 26. | Michiana Shores | 2.5% | 2.9%(-0.400)#26 | 3.9%(-1.40)#1,155 |
| 27. | Elkhart | 2.6% | 2.9%(-0.300)#27 | 3.9%(-1.30)#1,168 |
| 28. | Richmond | 2.6% | 2.9%(-0.300)#28 | 3.9%(-1.30)#1,174 |
| 29. | Roseland | 2.9% | 2.9%(=0.000)#29 | 3.9%(-1.00)#1,450 |
| 30. | Lawrence | 3.0% | 2.9%(+0.100)#30 | 3.9%(-0.900)#1,466 |
| 31. | Hamilton | 3.0% | 2.9%(+0.100)#31 | 3.9%(-0.900)#1,521 |
| 32. | Carmel | 3.1% | 2.9%(+0.200)#32 | 3.9%(-0.800)#1,535 |
| 33. | Hanover | 3.1% | 2.9%(+0.200)#33 | 3.9%(-0.800)#1,596 |
| 34. | Ogden Dunes | 3.1% | 2.9%(+0.200)#34 | 3.9%(-0.800)#1,609 |
| 35. | Clear Lake | 3.1% | 2.9%(+0.200)#35 | 3.9%(-0.800)#1,615 |
| 36. | Jeffersonville | 3.3% | 2.9%(+0.400)#36 | 3.9%(-0.600)#1,718 |
| 37. | Clarksville | 3.3% | 2.9%(+0.400)#37 | 3.9%(-0.600)#1,733 |
| 38. | Lafayette | 3.4% | 2.9%(+0.500)#38 | 3.9%(-0.500)#1,791 |
| 39. | Noblesville | 3.4% | 2.9%(+0.500)#39 | 3.9%(-0.500)#1,792 |
| 40. | Valparaiso | 3.4% | 2.9%(+0.500)#40 | 3.9%(-0.500)#1,799 |
| 41. | Lowell | 3.4% | 2.9%(+0.500)#41 | 3.9%(-0.500)#1,824 |
| 42. | Franklin | 3.5% | 2.9%(+0.600)#42 | 3.9%(-0.400)#1,885 |
| 43. | Greenfield | 3.5% | 2.9%(+0.600)#43 | 3.9%(-0.400)#1,888 |
| 44. | Vincennes | 3.6% | 2.9%(+0.700)#44 | 3.9%(-0.300)#1,960 |
| 45. | Speedway | 3.6% | 2.9%(+0.700)#45 | 3.9%(-0.300)#1,963 |
| 46. | Sellersburg | 3.7% | 2.9%(+0.800)#46 | 3.9%(-0.200)#2,038 |
| 47. | Spencer | 3.9% | 2.9%(+1.00)#47 | 3.9%(=0.000)#2,220 |
| 48. | Warsaw | 4.0% | 2.9%(+1.10)#48 | 3.9%(+0.100)#2,266 |
| 49. | Simonton Lake | 4.0% | 2.9%(+1.10)#49 | 3.9%(+0.100)#2,291 |
| 50. | Brookston | 4.0% | 2.9%(+1.10)#50 | 3.9%(+0.100)#2,304 |
| 51. | Bedford | 4.2% | 2.9%(+1.30)#51 | 3.9%(+0.300)#2,421 |
| 52. | Farmersburg | 4.2% | 2.9%(+1.30)#52 | 3.9%(+0.300)#2,456 |
| 53. | Fishers | 4.3% | 2.9%(+1.40)#53 | 3.9%(+0.400)#2,470 |
| 54. | Cumberland | 4.6% | 2.9%(+1.70)#54 | 3.9%(+0.700)#2,749 |
| 55. | Long Beach | 4.7% | 2.9%(+1.80)#55 | 3.9%(+0.800)#2,838 |
| 56. | Newburgh | 4.8% | 2.9%(+1.90)#56 | 3.9%(+0.900)#2,880 |
| 57. | Chesterfield | 4.9% | 2.9%(+2.00)#57 | 3.9%(+1.00)#2,945 |
| 58. | Plymouth | 5.0% | 2.9%(+2.10)#58 | 3.9%(+1.10)#2,993 |
| 59. | Hagerstown | 5.0% | 2.9%(+2.10)#59 | 3.9%(+1.10)#3,008 |
| 60. | Sheridan | 5.1% | 2.9%(+2.20)#60 | 3.9%(+1.20)#3,065 |
| 61. | Indianapolis | 5.2% | 2.9%(+2.30)#61 | 3.9%(+1.30)#3,092 |
| 62. | Pottawattamie Park | 5.2% | 2.9%(+2.30)#62 | 3.9%(+1.30)#3,154 |
| 63. | Beech Grove | 5.3% | 2.9%(+2.40)#63 | 3.9%(+1.40)#3,196 |
| 64. | Gary | 5.4% | 2.9%(+2.50)#64 | 3.9%(+1.50)#3,230 |
| 65. | Mishawaka | 5.4% | 2.9%(+2.50)#65 | 3.9%(+1.50)#3,232 |
| 66. | Terre Haute | 5.7% | 2.9%(+2.80)#66 | 3.9%(+1.80)#3,392 |
| 67. | Shipshewana | 5.8% | 2.9%(+2.90)#67 | 3.9%(+1.90)#3,478 |
| 68. | Portage | 6.0% | 2.9%(+3.10)#68 | 3.9%(+2.10)#3,547 |
| 69. | Topeka | 6.0% | 2.9%(+3.10)#69 | 3.9%(+2.10)#3,583 |
| 70. | Monroe | 6.2% | 2.9%(+3.30)#70 | 3.9%(+2.30)#3,692 |
| 71. | West Baden Springs | 6.2% | 2.9%(+3.30)#71 | 3.9%(+2.30)#3,698 |
| 72. | Huntertown | 6.3% | 2.9%(+3.40)#72 | 3.9%(+2.40)#3,723 |
| 73. | Paoli | 6.3% | 2.9%(+3.40)#73 | 3.9%(+2.40)#3,734 |
| 74. | Battle Ground | 6.3% | 2.9%(+3.40)#74 | 3.9%(+2.40)#3,736 |
| 75. | Remington | 6.3% | 2.9%(+3.40)#75 | 3.9%(+2.40)#3,738 |
| 76. | Knightstown | 6.9% | 2.9%(+4.00)#76 | 3.9%(+3.00)#4,039 |
| 77. | Haubstadt | 6.9% | 2.9%(+4.00)#77 | 3.9%(+3.00)#4,040 |
| 78. | Rocky Ripple | 7.1% | 2.9%(+4.20)#78 | 3.9%(+3.20)#4,120 |
| 79. | Greenwood | 7.2% | 2.9%(+4.30)#79 | 3.9%(+3.30)#4,137 |
| 80. | Munster | 7.6% | 2.9%(+4.70)#80 | 3.9%(+3.70)#4,285 |
| 81. | Decatur | 7.7% | 2.9%(+4.80)#81 | 3.9%(+3.80)#4,338 |
| 82. | Worthington | 7.9% | 2.9%(+5.00)#82 | 3.9%(+4.00)#4,428 |
| 83. | North Judson | 8.2% | 2.9%(+5.30)#83 | 3.9%(+4.30)#4,528 |
| 84. | Vevay | 8.3% | 2.9%(+5.40)#84 | 3.9%(+4.40)#4,558 |
| 85. | North Terre Haute | 8.5% | 2.9%(+5.60)#85 | 3.9%(+4.60)#4,631 |
| 86. | La Porte | 8.6% | 2.9%(+5.70)#86 | 3.9%(+4.70)#4,655 |
| 87. | St John | 8.6% | 2.9%(+5.70)#87 | 3.9%(+4.70)#4,656 |
| 88. | Boonville | 8.7% | 2.9%(+5.80)#88 | 3.9%(+4.80)#4,698 |
| 89. | Linton | 8.9% | 2.9%(+6.00)#89 | 3.9%(+5.00)#4,752 |
| 90. | Prince S Lakes | 9.5% | 2.9%(+6.60)#90 | 3.9%(+5.60)#4,963 |
| 91. | Rising Sun | 9.6% | 2.9%(+6.70)#91 | 3.9%(+5.70)#4,995 |
| 92. | Austin | 10.2% | 2.9%(+7.30)#92 | 3.9%(+6.30)#5,156 |
| 93. | Floyds Knobs | 10.5% | 2.9%(+7.60)#93 | 3.9%(+6.60)#5,232 |
| 94. | Hymera | 11.1% | 2.9%(+8.20)#94 | 3.9%(+7.20)#5,362 |
| 95. | Knightsville | 11.1% | 2.9%(+8.20)#95 | 3.9%(+7.20)#5,367 |
| 96. | Garrett | 11.3% | 2.9%(+8.40)#96 | 3.9%(+7.40)#5,407 |
| 97. | Barbee | 11.3% | 2.9%(+8.40)#97 | 3.9%(+7.40)#5,414 |
| 98. | Cedar Grove | 11.5% | 2.9%(+8.60)#98 | 3.9%(+7.60)#5,458 |
| 99. | Paragon | 11.7% | 2.9%(+8.80)#99 | 3.9%(+7.80)#5,493 |
| 100. | Chandler | 12.3% | 2.9%(+9.40)#100 | 3.9%(+8.40)#5,573 |
Common Questions
What are the Top 10 Cities with the Lowest Unemployment Rate Amomg Seniors Over the Age of 65 in Indiana?
Top 10 Cities with the Lowest Unemployment Rate Amomg Seniors Over the Age of 65 in Indiana are:
#1
0.50%
#2
0.70%
#3
0.70%
#4
1.2%
#5
1.2%
#6
1.3%
#7
1.5%
#8
1.5%
#9
1.5%
#10
1.6%
What city has the Lowest Unemployment Rate Amomg Seniors Over the Age of 65 in Indiana?
Columbus has the Lowest Unemployment Rate Amomg Seniors Over the Age of 65 in Indiana with 0.50%.
What is the Unemployment Rate Amomg Seniors Over the Age of 65 in the State of Indiana?
Unemployment Rate Amomg Seniors Over the Age of 65 in Indiana is 2.9%.
What is the Unemployment Rate Amomg Seniors Over the Age of 65 in the United States?
Unemployment Rate Amomg Seniors Over the Age of 65 in the United States is 3.9%.