Cities with the Lowest Unemployment Rate Amomg Seniors Over the Age of 65 in Pennsylvania
RELATED REPORTS & OPTIONS
Lowest Unemployment | Senior > 65
Pennsylvania
Compare Cities
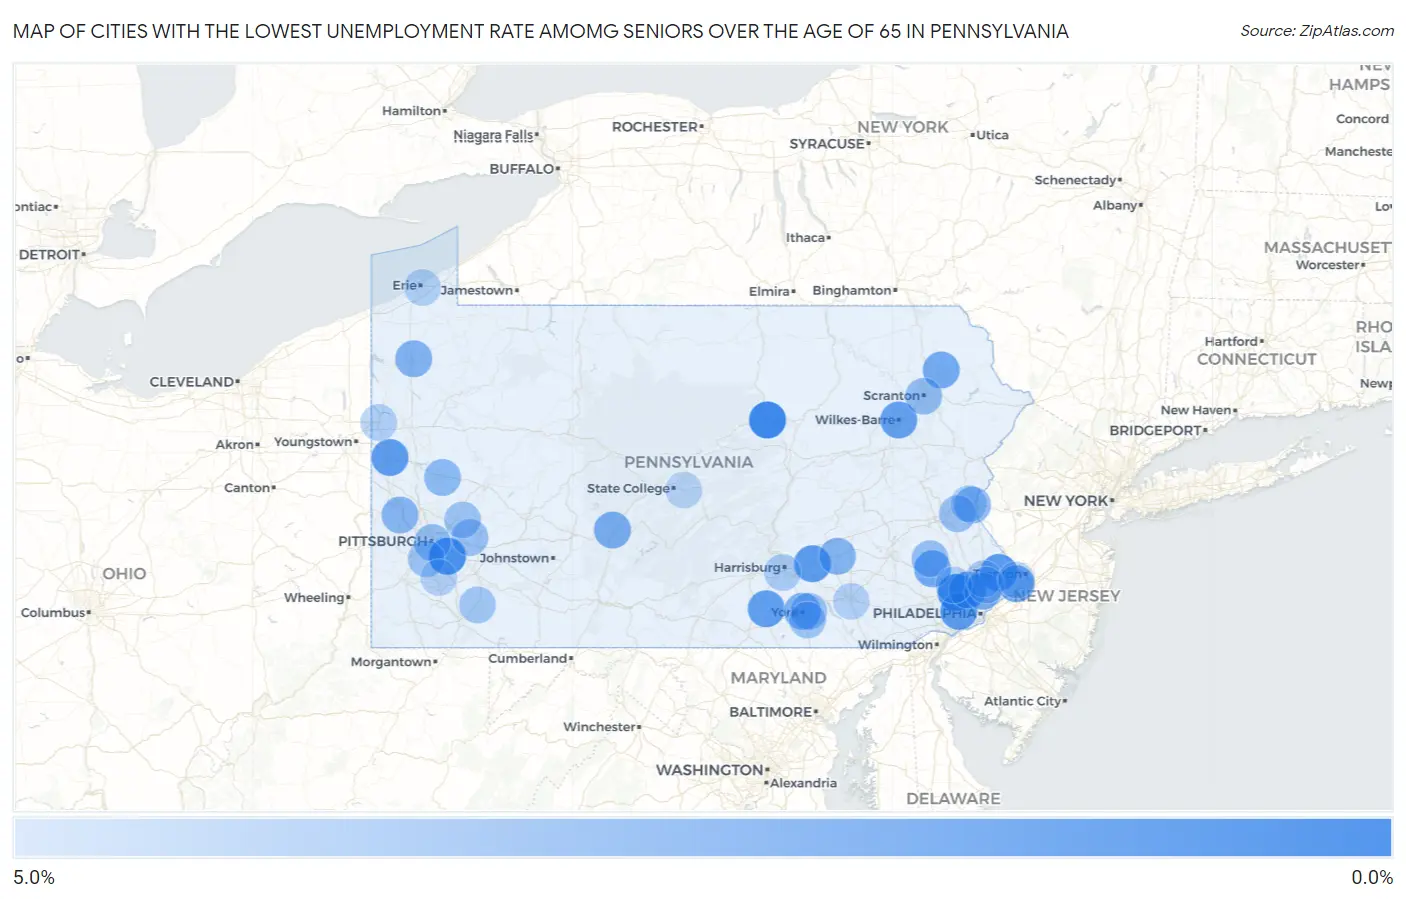
Map of Cities with the Lowest Unemployment Rate Amomg Seniors Over the Age of 65 in Pennsylvania
5.0%
0.0%
Cities with the Lowest Unemployment Rate Amomg Seniors Over the Age of 65 in Pennsylvania
| City | Senior Unemployment | vs State | vs National | |
| 1. | Media Borough | 0.40% | 4.2%(-3.80)#1 | 3.9%(-3.50)#44 |
| 2. | Williamsport | 0.60% | 4.2%(-3.60)#2 | 3.9%(-3.30)#85 |
| 3. | King Of Prussia | 0.60% | 4.2%(-3.60)#3 | 3.9%(-3.30)#89 |
| 4. | Plymouth Borough | 0.70% | 4.2%(-3.50)#4 | 3.9%(-3.20)#128 |
| 5. | Lewistown Borough | 0.90% | 4.2%(-3.30)#5 | 3.9%(-3.00)#189 |
| 6. | Mckeesport | 1.0% | 4.2%(-3.20)#6 | 3.9%(-2.90)#216 |
| 7. | Swissvale Borough | 1.2% | 4.2%(-3.00)#7 | 3.9%(-2.70)#326 |
| 8. | Dormont Borough | 1.4% | 4.2%(-2.80)#8 | 3.9%(-2.50)#426 |
| 9. | Hershey | 1.5% | 4.2%(-2.70)#9 | 3.9%(-2.40)#468 |
| 10. | Broomall | 1.5% | 4.2%(-2.70)#10 | 3.9%(-2.40)#475 |
| 11. | Richboro | 1.5% | 4.2%(-2.70)#11 | 3.9%(-2.40)#478 |
| 12. | Saxonburg Borough | 1.5% | 4.2%(-2.70)#12 | 3.9%(-2.40)#484 |
| 13. | New Castle | 1.6% | 4.2%(-2.60)#13 | 3.9%(-2.30)#510 |
| 14. | Canonsburg Borough | 1.6% | 4.2%(-2.60)#14 | 3.9%(-2.30)#531 |
| 15. | Honey Brook Borough | 1.6% | 4.2%(-2.60)#15 | 3.9%(-2.30)#541 |
| 16. | Pottstown Borough | 1.7% | 4.2%(-2.50)#16 | 3.9%(-2.20)#573 |
| 17. | Carnegie Borough | 1.7% | 4.2%(-2.50)#17 | 3.9%(-2.20)#591 |
| 18. | Hellertown Borough | 1.7% | 4.2%(-2.50)#18 | 3.9%(-2.20)#595 |
| 19. | Lake Meade | 1.7% | 4.2%(-2.50)#19 | 3.9%(-2.20)#599 |
| 20. | Wilkes Barre | 1.8% | 4.2%(-2.40)#20 | 3.9%(-2.10)#620 |
| 21. | Plymouth Meeting | 1.8% | 4.2%(-2.40)#21 | 3.9%(-2.10)#664 |
| 22. | Downingtown Borough | 2.0% | 4.2%(-2.20)#22 | 3.9%(-1.90)#783 |
| 23. | Levittown | 2.1% | 4.2%(-2.10)#23 | 3.9%(-1.80)#804 |
| 24. | Elverson Borough | 2.1% | 4.2%(-2.10)#24 | 3.9%(-1.80)#857 |
| 25. | Plum Borough | 2.2% | 4.2%(-2.00)#25 | 3.9%(-1.70)#883 |
| 26. | Sanatoga | 2.2% | 4.2%(-2.00)#26 | 3.9%(-1.70)#909 |
| 27. | Edgeworth Borough | 2.2% | 4.2%(-2.00)#27 | 3.9%(-1.70)#925 |
| 28. | Carbondale | 2.3% | 4.2%(-1.90)#28 | 3.9%(-1.60)#979 |
| 29. | Glenside | 2.3% | 4.2%(-1.90)#29 | 3.9%(-1.60)#983 |
| 30. | Altoona | 2.4% | 4.2%(-1.80)#30 | 3.9%(-1.50)#1,021 |
| 31. | Chambersburg Borough | 2.4% | 4.2%(-1.80)#31 | 3.9%(-1.50)#1,034 |
| 32. | Latrobe Borough | 2.4% | 4.2%(-1.80)#32 | 3.9%(-1.50)#1,064 |
| 33. | Evans City Borough | 2.4% | 4.2%(-1.80)#33 | 3.9%(-1.50)#1,072 |
| 34. | Shoemakersville Borough | 2.4% | 4.2%(-1.80)#34 | 3.9%(-1.50)#1,073 |
| 35. | Nescopeck Borough | 2.4% | 4.2%(-1.80)#35 | 3.9%(-1.50)#1,074 |
| 36. | York | 2.5% | 4.2%(-1.70)#36 | 3.9%(-1.40)#1,099 |
| 37. | West Chester Borough | 2.5% | 4.2%(-1.70)#37 | 3.9%(-1.40)#1,116 |
| 38. | Red Hill Borough | 2.5% | 4.2%(-1.70)#38 | 3.9%(-1.40)#1,142 |
| 39. | Avoca Borough | 2.5% | 4.2%(-1.70)#39 | 3.9%(-1.40)#1,145 |
| 40. | Clarks Green Borough | 2.5% | 4.2%(-1.70)#40 | 3.9%(-1.40)#1,148 |
| 41. | Bear Creek Village Borough | 2.5% | 4.2%(-1.70)#41 | 3.9%(-1.40)#1,156 |
| 42. | Lansdale Borough | 2.6% | 4.2%(-1.60)#42 | 3.9%(-1.30)#1,186 |
| 43. | Birdsboro Borough | 2.6% | 4.2%(-1.60)#43 | 3.9%(-1.30)#1,207 |
| 44. | Meadville | 2.7% | 4.2%(-1.50)#44 | 3.9%(-1.20)#1,266 |
| 45. | Lebanon | 2.8% | 4.2%(-1.40)#45 | 3.9%(-1.10)#1,319 |
| 46. | Southmont Borough | 2.8% | 4.2%(-1.40)#46 | 3.9%(-1.10)#1,359 |
| 47. | Jacobus Borough | 2.8% | 4.2%(-1.40)#47 | 3.9%(-1.10)#1,360 |
| 48. | Harrisville Borough | 2.8% | 4.2%(-1.40)#48 | 3.9%(-1.10)#1,368 |
| 49. | Easton | 2.9% | 4.2%(-1.30)#49 | 3.9%(-1.00)#1,400 |
| 50. | Elizabethtown Borough | 2.9% | 4.2%(-1.30)#50 | 3.9%(-1.00)#1,418 |
| 51. | Aliquippa | 2.9% | 4.2%(-1.30)#51 | 3.9%(-1.00)#1,424 |
| 52. | New Cumberland Borough | 2.9% | 4.2%(-1.30)#52 | 3.9%(-1.00)#1,427 |
| 53. | St. Davids | 2.9% | 4.2%(-1.30)#53 | 3.9%(-1.00)#1,435 |
| 54. | Butler | 3.0% | 4.2%(-1.20)#54 | 3.9%(-0.900)#1,494 |
| 55. | Bristol Borough | 3.1% | 4.2%(-1.10)#55 | 3.9%(-0.800)#1,578 |
| 56. | Huntingdon Borough | 3.1% | 4.2%(-1.10)#56 | 3.9%(-0.800)#1,590 |
| 57. | Churchill Borough | 3.1% | 4.2%(-1.10)#57 | 3.9%(-0.800)#1,597 |
| 58. | Pittsburgh | 3.2% | 4.2%(-1.00)#58 | 3.9%(-0.700)#1,618 |
| 59. | Scranton | 3.2% | 4.2%(-1.00)#59 | 3.9%(-0.700)#1,633 |
| 60. | West Wyoming Borough | 3.2% | 4.2%(-1.00)#60 | 3.9%(-0.700)#1,685 |
| 61. | St Lawrence Borough | 3.2% | 4.2%(-1.00)#61 | 3.9%(-0.700)#1,689 |
| 62. | East Stroudsburg Borough | 3.3% | 4.2%(-0.900)#62 | 3.9%(-0.600)#1,757 |
| 63. | Collingdale Borough | 3.3% | 4.2%(-0.900)#63 | 3.9%(-0.600)#1,758 |
| 64. | Gilbertsville | 3.3% | 4.2%(-0.900)#64 | 3.9%(-0.600)#1,765 |
| 65. | Bethlehem | 3.4% | 4.2%(-0.800)#65 | 3.9%(-0.500)#1,790 |
| 66. | Murrysville | 3.4% | 4.2%(-0.800)#66 | 3.9%(-0.500)#1,810 |
| 67. | East York | 3.4% | 4.2%(-0.800)#67 | 3.9%(-0.500)#1,828 |
| 68. | Bethel Park | 3.5% | 4.2%(-0.700)#68 | 3.9%(-0.400)#1,881 |
| 69. | Kingston Borough | 3.5% | 4.2%(-0.700)#69 | 3.9%(-0.400)#1,898 |
| 70. | Lower Burrell | 3.5% | 4.2%(-0.700)#70 | 3.9%(-0.400)#1,900 |
| 71. | Perkasie Borough | 3.5% | 4.2%(-0.700)#71 | 3.9%(-0.400)#1,908 |
| 72. | Meyersdale Borough | 3.5% | 4.2%(-0.700)#72 | 3.9%(-0.400)#1,921 |
| 73. | Hatboro Borough | 3.6% | 4.2%(-0.600)#73 | 3.9%(-0.300)#1,977 |
| 74. | Spry | 3.6% | 4.2%(-0.600)#74 | 3.9%(-0.300)#1,989 |
| 75. | New Britain Borough | 3.6% | 4.2%(-0.600)#75 | 3.9%(-0.300)#1,993 |
| 76. | Lansdowne Borough | 3.7% | 4.2%(-0.500)#76 | 3.9%(-0.200)#2,036 |
| 77. | Souderton Borough | 3.7% | 4.2%(-0.500)#77 | 3.9%(-0.200)#2,044 |
| 78. | Connellsville | 3.7% | 4.2%(-0.500)#78 | 3.9%(-0.200)#2,046 |
| 79. | Indian Lake Borough | 3.8% | 4.2%(-0.400)#79 | 3.9%(-0.100)#2,145 |
| 80. | Horsham | 3.9% | 4.2%(-0.300)#80 | 3.9%(=0.000)#2,190 |
| 81. | Bridgeville Borough | 3.9% | 4.2%(-0.300)#81 | 3.9%(=0.000)#2,209 |
| 82. | Liberty Borough Allegheny County | 3.9% | 4.2%(-0.300)#82 | 3.9%(=0.000)#2,222 |
| 83. | West Mifflin Borough | 4.0% | 4.2%(-0.200)#83 | 3.9%(+0.100)#2,263 |
| 84. | Yeadon Borough | 4.0% | 4.2%(-0.200)#84 | 3.9%(+0.100)#2,277 |
| 85. | Lower Allen | 4.0% | 4.2%(-0.200)#85 | 3.9%(+0.100)#2,286 |
| 86. | Delmont Borough | 4.0% | 4.2%(-0.200)#86 | 3.9%(+0.100)#2,299 |
| 87. | Erie | 4.1% | 4.2%(-0.100)#87 | 3.9%(+0.200)#2,325 |
| 88. | Hermitage | 4.1% | 4.2%(-0.100)#88 | 3.9%(+0.200)#2,351 |
| 89. | Trooper | 4.1% | 4.2%(-0.100)#89 | 3.9%(+0.200)#2,366 |
| 90. | Narberth Borough | 4.1% | 4.2%(-0.100)#90 | 3.9%(+0.200)#2,369 |
| 91. | Mount Pleasant Borough | 4.1% | 4.2%(-0.100)#91 | 3.9%(+0.200)#2,370 |
| 92. | Palmer Heights | 4.1% | 4.2%(-0.100)#92 | 3.9%(+0.200)#2,373 |
| 93. | Galeton Borough | 4.1% | 4.2%(-0.100)#93 | 3.9%(+0.200)#2,388 |
| 94. | Lancaster | 4.2% | 4.2%(=0.000)#94 | 3.9%(+0.300)#2,405 |
| 95. | Willow Grove | 4.2% | 4.2%(=0.000)#95 | 3.9%(+0.300)#2,422 |
| 96. | Fairless Hills | 4.2% | 4.2%(=0.000)#96 | 3.9%(+0.300)#2,432 |
| 97. | Bala Cynwyd | 4.2% | 4.2%(=0.000)#97 | 3.9%(+0.300)#2,433 |
| 98. | Monongahela | 4.2% | 4.2%(=0.000)#98 | 3.9%(+0.300)#2,444 |
| 99. | Boalsburg | 4.3% | 4.2%(+0.100)#99 | 3.9%(+0.400)#2,513 |
| 100. | North Charleroi Borough | 4.3% | 4.2%(+0.100)#100 | 3.9%(+0.400)#2,525 |
Common Questions
What are the Top 10 Cities with the Lowest Unemployment Rate Amomg Seniors Over the Age of 65 in Pennsylvania?
Top 10 Cities with the Lowest Unemployment Rate Amomg Seniors Over the Age of 65 in Pennsylvania are:
#1
0.60%
#2
0.60%
#3
1.0%
#4
1.5%
#5
1.5%
#6
1.5%
#7
1.6%
#8
1.7%
#9
1.8%
#10
1.8%
What city has the Lowest Unemployment Rate Amomg Seniors Over the Age of 65 in Pennsylvania?
Williamsport has the Lowest Unemployment Rate Amomg Seniors Over the Age of 65 in Pennsylvania with 0.60%.
What is the Unemployment Rate Amomg Seniors Over the Age of 65 in the State of Pennsylvania?
Unemployment Rate Amomg Seniors Over the Age of 65 in Pennsylvania is 4.2%.
What is the Unemployment Rate Amomg Seniors Over the Age of 65 in the United States?
Unemployment Rate Amomg Seniors Over the Age of 65 in the United States is 3.9%.