Cities with the Lowest Unemployment Rate Amomg Seniors Over the Age of 65 in Utah

RELATED REPORTS & OPTIONS

Lowest Unemployment | Senior > 65
Population
Families and Households
Female Fertility
Female Fertility (Unmarried)
Race (Community Size)
Race (Percentage)
Ancestry (Community Size)
AfghanAfricanAlaska NativeAlaskan AthabascanAlbanianAleutAlsatianAmericanApacheArabArapahoArgentineanArmenianAssyrian / Chaldean / SyriacAustralianAustrianBahamianBangladeshiBarbadianBasqueBelgianBelizeanBermudanBhutaneseBlackfeetBolivianBrazilianBritishBritish West IndianBulgarianBurmeseCajunCambodianCanadianCape VerdeanCarpatho RusynCelticCentral AmericanCentral American IndianCherokeeCheyenneChickasawChileanChineseChippewaChoctawColombianColvilleComancheCosta RicanCreeCreekCroatianCrowCubanCypriotCzechCzechoslovakianDanishDelawareDominicanDutchDutch West IndianEastern EuropeanEcuadorianEgyptianEnglishEstonianEthiopianEuropeanFijianFilipinoFinnishFrenchFrench American IndianFrench CanadianGermanGerman RussianGhanaianGreekGuamanian / ChamorroGuatemalanGuyaneseHaitianHmongHonduranHopiHoumaHungarianIcelanderIndian (Asian)IndonesianInupiatIranianIraqiIrishIroquoisIsraeliItalianJamaicanJapaneseJordanianKenyanKiowaKoreanLaotianLatvianLebaneseLiberianLithuanianLumbeeLuxembourgerMacedonianMalaysianMalteseMarshalleseMenomineeMexicanMexican American IndianMongolianMoroccanNative HawaiianNavajoNepaleseNew ZealanderNicaraguanNigerianNorthern EuropeanNorwegianOkinawanOsageOttawaPaiutePakistaniPalestinianPanamanianParaguayanPennsylvania GermanPeruvianPimaPolishPortuguesePotawatomiPuebloPuerto RicanPuget Sound SalishRomanianRussianSalvadoranSamoanScandinavianScotch-IrishScottishSeminoleSenegaleseSerbianShoshoneSierra LeoneanSiouxSlavicSlovakSloveneSomaliSouth AfricanSouth AmericanSouth American IndianSoviet UnionSpaniardSpanishSpanish AmericanSpanish American IndianSri LankanSubsaharan AfricanSudaneseSwedishSwissSyrianTaiwaneseThaiTlingit-HaidaTohono O'OdhamTonganTrinidadian and TobagonianTsimshianTurkishU.S. Virgin IslanderUgandanUkrainianUruguayanUteVenezuelanVietnameseWelshWest IndianYakamaYaquiYugoslavianYumanYup'ikZimbabwean
Ancestry (Percentage)
AfghanAfricanAlaska NativeAlaskan AthabascanAlbanianAleutAlsatianAmericanApacheArabArapahoArgentineanArmenianAssyrian / Chaldean / SyriacAustralianAustrianBahamianBangladeshiBarbadianBasqueBelgianBelizeanBermudanBhutaneseBlackfeetBolivianBrazilianBritishBritish West IndianBulgarianBurmeseCajunCambodianCanadianCape VerdeanCarpatho RusynCelticCentral AmericanCentral American IndianCherokeeCheyenneChickasawChileanChineseChippewaChoctawColombianColvilleComancheCosta RicanCreeCreekCroatianCrowCubanCypriotCzechCzechoslovakianDanishDelawareDominicanDutchDutch West IndianEastern EuropeanEcuadorianEgyptianEnglishEstonianEthiopianEuropeanFijianFilipinoFinnishFrenchFrench American IndianFrench CanadianGermanGerman RussianGhanaianGreekGuamanian / ChamorroGuatemalanGuyaneseHaitianHmongHonduranHopiHoumaHungarianIcelanderIndian (Asian)IndonesianInupiatIranianIraqiIrishIroquoisIsraeliItalianJamaicanJapaneseJordanianKenyanKiowaKoreanLaotianLatvianLebaneseLiberianLithuanianLumbeeLuxembourgerMacedonianMalaysianMalteseMarshalleseMenomineeMexicanMexican American IndianMongolianMoroccanNative HawaiianNavajoNepaleseNew ZealanderNicaraguanNigerianNorthern EuropeanNorwegianOkinawanOsageOttawaPaiutePakistaniPalestinianPanamanianParaguayanPennsylvania GermanPeruvianPimaPolishPortuguesePotawatomiPuebloPuerto RicanPuget Sound SalishRomanianRussianSalvadoranSamoanScandinavianScotch-IrishScottishSeminoleSenegaleseSerbianShoshoneSierra LeoneanSiouxSlavicSlovakSloveneSomaliSouth AfricanSouth AmericanSouth American IndianSoviet UnionSpaniardSpanishSpanish AmericanSpanish American IndianSri LankanSubsaharan AfricanSudaneseSwedishSwissSyrianTaiwaneseThaiTlingit-HaidaTohono O'OdhamTonganTrinidadian and TobagonianTsimshianTurkishU.S. Virgin IslanderUgandanUkrainianUruguayanUteVenezuelanVietnameseWelshWest IndianYakamaYaquiYugoslavianYumanYup'ikZimbabwean
Immigrant Origin (Total)
AfghanistanAfricaAlbaniaArgentinaArmeniaAsiaAustraliaAustriaAzoresBahamasBangladeshBarbadosBelarusBelgiumBelizeBoliviaBosnia and HerzegovinaBrazilBulgariaBurma / MyanmarCabo VerdeCambodiaCameroonCanadaCaribbeanCentral AmericaChileChinaColombiaCongoCosta RicaCroatiaCubaCzechoslovakiaDenmarkDominicaDominican RepublicEastern AfricaEastern AsiaEastern EuropeEcuadorEgyptEl SalvadorEnglandEritreaEthiopiaEuropeFijiFranceGermanyGhanaGreeceGrenadaGuatemalaGuyanaHaitiHondurasHong KongHungaryIndiaIndonesiaIranIraqIrelandIsraelItalyJamaicaJapanJordanKazakhstanKenyaKoreaKuwaitLaosLatin AmericaLatviaLebanonLiberiaLithuaniaMalaysiaMexicoMicronesiaMiddle AfricaMoldovaMoroccoNepalNetherlandsNicaraguaNigeriaNorth MacedoniaNorthern AfricaNorthern EuropeNorwayOceaniaPakistanPanamaPeruPhilippinesPolandPortugalRomaniaRussiaSaudi ArabiaScotlandSenegalSerbiaSierra LeoneSingaporeSomaliaSouth AfricaSouth AmericaSouth Central AsiaSouth Eastern AsiaSouthern EuropeSpainSri LankaSt. Vincent and the GrenadinesSudanSwedenSwitzerlandSyriaTaiwanThailandTrinidad and TobagoTurkeyUgandaUkraineUruguayUzbekistanVenezuelaVietnamWest IndiesWestern AfricaWestern AsiaWestern EuropeYemenZaireZimbabwe
Immigrant Origin (Percentage)
AfghanistanAfricaAlbaniaArgentinaArmeniaAsiaAustraliaAustriaAzoresBahamasBangladeshBarbadosBelarusBelgiumBelizeBoliviaBosnia and HerzegovinaBrazilBulgariaBurma / MyanmarCabo VerdeCambodiaCameroonCanadaCaribbeanCentral AmericaChileChinaColombiaCongoCosta RicaCroatiaCubaCzechoslovakiaDenmarkDominicaDominican RepublicEastern AfricaEastern AsiaEastern EuropeEcuadorEgyptEl SalvadorEnglandEritreaEthiopiaEuropeFijiFranceGermanyGhanaGreeceGrenadaGuatemalaGuyanaHaitiHondurasHong KongHungaryIndiaIndonesiaIranIraqIrelandIsraelItalyJamaicaJapanJordanKazakhstanKenyaKoreaKuwaitLaosLatin AmericaLatviaLebanonLiberiaLithuaniaMalaysiaMexicoMicronesiaMiddle AfricaMoldovaMoroccoNepalNetherlandsNicaraguaNigeriaNorth MacedoniaNorthern AfricaNorthern EuropeNorwayOceaniaPakistanPanamaPeruPhilippinesPolandPortugalRomaniaRussiaSaudi ArabiaScotlandSenegalSerbiaSierra LeoneSingaporeSomaliaSouth AfricaSouth AmericaSouth Central AsiaSouth Eastern AsiaSouthern EuropeSpainSri LankaSt. Vincent and the GrenadinesSudanSwedenSwitzerlandSyriaTaiwanThailandTrinidad and TobagoTurkeyUgandaUkraineUruguayUzbekistanVenezuelaVietnamWest IndiesWestern AfricaWestern AsiaWestern EuropeYemenZaireZimbabwe
Income
Income (Families)
Income (Households)
Poverty
Poverty (Families)
Unemployment
Employment Occupations
Employment Industries
Employer Class
Commute Time
Commute Means
School Enrollment
Education by Degree Field
Occupancy
Finances
Physical Characteristics
Utah
Compare Cities
Comparison Subject

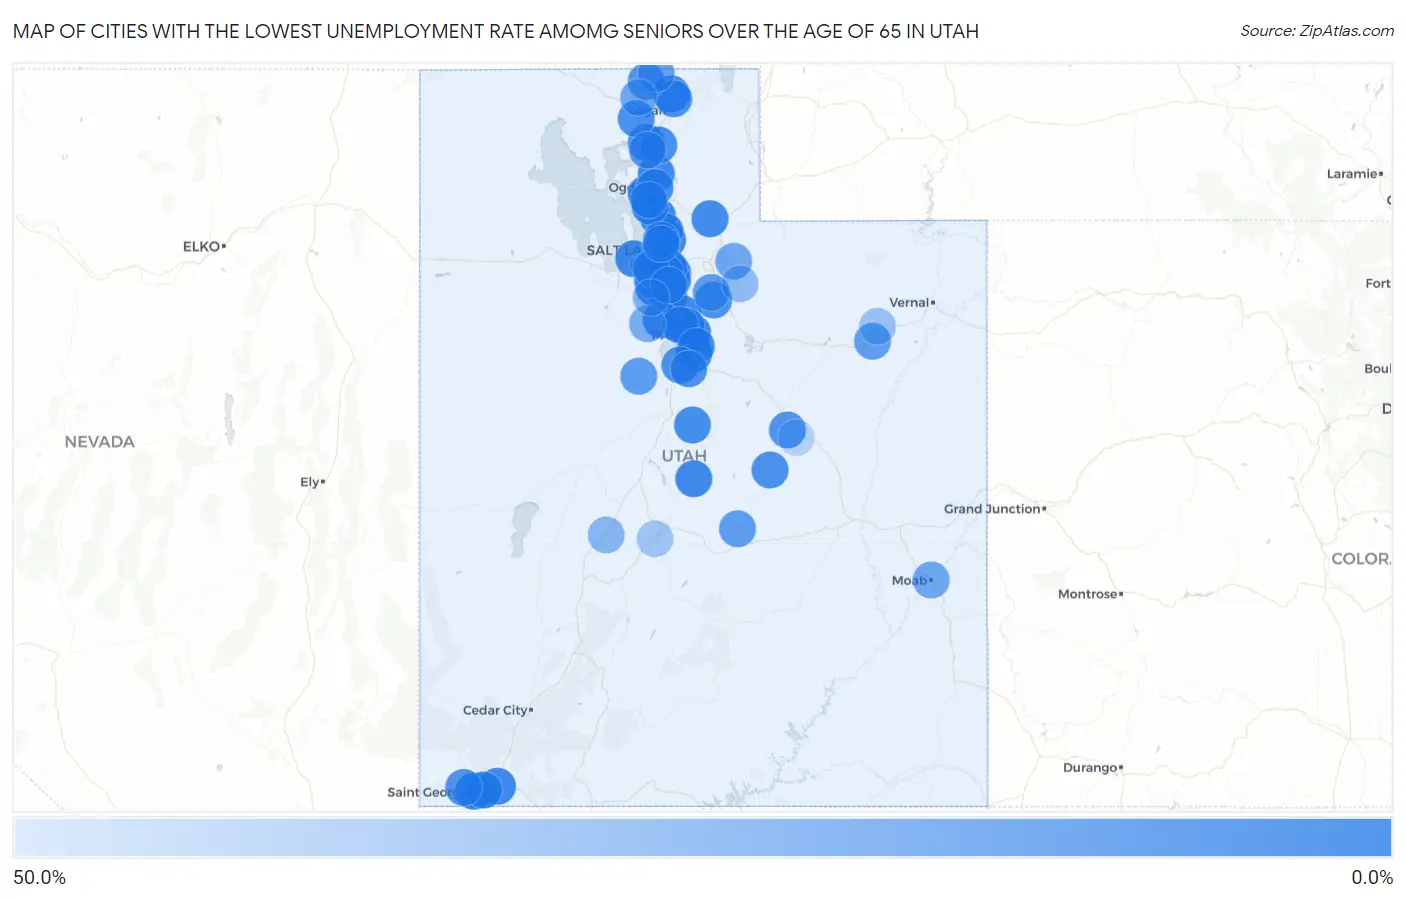
Map of Cities with the Lowest Unemployment Rate Amomg Seniors Over the Age of 65 in Utah

50.0%
0.0%
Cities with the Lowest Unemployment Rate Amomg Seniors Over the Age of 65 in Utah Map

Cities with the Lowest Unemployment Rate Amomg Seniors Over the Age of 65 in Utah

City Senior Unemployment vs State vs National
1.Provo0.40%2.4%(-2.00)#13.9%(-3.50)#25
2.Bountiful0.40%2.4%(-2.00)#23.9%(-3.50)#30
3.Spanish Fork0.40%2.4%(-2.00)#33.9%(-3.50)#31
4.Kaysville0.90%2.4%(-1.50)#43.9%(-3.00)#165
5.Centerville1.0%2.4%(-1.40)#53.9%(-2.90)#217
6.Draper1.1%2.4%(-1.30)#63.9%(-2.80)#243
7.Holladay1.3%2.4%(-1.10)#73.9%(-2.60)#350
8.St George1.4%2.4%(-1.00)#83.9%(-2.50)#388
9.Salt Lake City1.5%2.4%(-0.900)#93.9%(-2.40)#436
10.Taylorsville1.6%2.4%(-0.800)#103.9%(-2.30)#492
11.Roy1.6%2.4%(-0.800)#113.9%(-2.30)#498
12.Clearfield1.8%2.4%(-0.600)#123.9%(-2.10)#628
13.South Jordan2.3%2.4%(-0.100)#133.9%(-1.60)#936
14.West Jordan2.5%2.4%(+0.100)#143.9%(-1.40)#1,083
15.Magna2.5%2.4%(+0.100)#153.9%(-1.40)#1,107
16.Pleasant Grove2.6%2.4%(+0.200)#163.9%(-1.30)#1,172
17.Cottonwood Heights2.7%2.4%(+0.300)#173.9%(-1.20)#1,241
18.Millcreek2.8%2.4%(+0.400)#183.9%(-1.10)#1,309
19.Manti2.9%2.4%(+0.500)#193.9%(-1.00)#1,436
20.Orem3.0%2.4%(+0.600)#203.9%(-0.900)#1,457
21.Murray3.0%2.4%(+0.600)#213.9%(-0.900)#1,464
22.Hurricane3.0%2.4%(+0.600)#223.9%(-0.900)#1,484
23.Saratoga Springs3.1%2.4%(+0.700)#233.9%(-0.800)#1,547
24.North Ogden3.1%2.4%(+0.700)#243.9%(-0.800)#1,560
25.Vineyard3.3%2.4%(+0.900)#253.9%(-0.600)#1,748
26.Washington3.4%2.4%(+1.00)#263.9%(-0.500)#1,801
27.West Valley City3.6%2.4%(+1.20)#273.9%(-0.300)#1,932
28.Springville4.1%2.4%(+1.70)#283.9%(+0.200)#2,339
29.Henefer4.1%2.4%(+1.70)#293.9%(+0.200)#2,391
30.Sandy4.5%2.4%(+2.10)#303.9%(+0.600)#2,611
31.Smithfield4.6%2.4%(+2.20)#313.9%(+0.700)#2,736
32.Ogden4.9%2.4%(+2.50)#323.9%(+1.00)#2,901
33.Fountain Green5.5%2.4%(+3.10)#333.9%(+1.60)#3,316
34.Brigham City5.6%2.4%(+3.20)#343.9%(+1.70)#3,348
35.Mantua5.8%2.4%(+3.40)#353.9%(+1.90)#3,474
36.Sunset6.1%2.4%(+3.70)#363.9%(+2.20)#3,622
37.Huntington6.7%2.4%(+4.30)#373.9%(+2.80)#3,959
38.Elwood6.8%2.4%(+4.40)#383.9%(+2.90)#4,003
39.Payson7.2%2.4%(+4.80)#393.9%(+3.30)#4,144
40.Elk Ridge7.4%2.4%(+5.00)#403.9%(+3.50)#4,231
41.Hyde Park7.5%2.4%(+5.10)#413.9%(+3.60)#4,268
42.Santa Clara8.0%2.4%(+5.60)#423.9%(+4.10)#4,451
43.Charleston8.3%2.4%(+5.90)#433.9%(+4.40)#4,574
44.Price8.8%2.4%(+6.40)#443.9%(+4.90)#4,719
45.Woods Cross11.6%2.4%(+9.20)#453.9%(+7.70)#5,464
46.Clarkston11.7%2.4%(+9.30)#463.9%(+7.80)#5,492
47.Perry11.9%2.4%(+9.50)#473.9%(+8.00)#5,512
48.North Salt Lake13.3%2.4%(+10.9)#483.9%(+9.40)#5,742
49.Eureka14.2%2.4%(+11.8)#493.9%(+10.3)#5,875
50.Emery14.2%2.4%(+11.8)#503.9%(+10.3)#5,889
51.Midway14.6%2.4%(+12.2)#513.9%(+10.7)#5,928
52.Myton15.4%2.4%(+13.0)#523.9%(+11.5)#6,019
53.Cornish16.6%2.4%(+14.2)#533.9%(+12.7)#6,168
54.Fielding20.0%2.4%(+17.6)#543.9%(+16.1)#6,496
55.Oakley20.3%2.4%(+17.9)#553.9%(+16.4)#6,521
56.Moab21.0%2.4%(+18.6)#563.9%(+17.1)#6,548
57.Eagle Mountain25.1%2.4%(+22.7)#573.9%(+21.2)#6,793
58.Herriman28.4%2.4%(+26.0)#583.9%(+24.5)#6,897
59.Meadow30.7%2.4%(+28.3)#593.9%(+26.8)#6,992
60.Woodland33.3%2.4%(+30.9)#603.9%(+29.4)#7,071
61.Roosevelt37.8%2.4%(+35.4)#613.9%(+33.9)#7,186
62.Sigurd40.0%2.4%(+37.6)#623.9%(+36.1)#7,228
63.Wellington47.8%2.4%(+45.4)#633.9%(+43.9)#7,330

Common Questions

What are the Top 10 Cities with the Lowest Unemployment Rate Amomg Seniors Over the Age of 65 in Utah?
Top 10 Cities with the Lowest Unemployment Rate Amomg Seniors Over the Age of 65 in Utah are:
#1
0.0%
#2
0.0%
#3
0.0%
#4
0.0%
#5
0.0%
#6
0.0%
#7
0.0%
#8
0.0%
#9
0.0%
#10
0.0%
What city has the Lowest Unemployment Rate Amomg Seniors Over the Age of 65 in Utah?
Provo has the Lowest Unemployment Rate Amomg Seniors Over the Age of 65 in Utah with 0.40%.
What is the Unemployment Rate Amomg Seniors Over the Age of 65 in the State of Utah?
Unemployment Rate Amomg Seniors Over the Age of 65 in Utah is 2.4%.
What is the Unemployment Rate Amomg Seniors Over the Age of 65 in the United States?
Unemployment Rate Amomg Seniors Over the Age of 65 in the United States is 3.9%.