Cities with the Lowest Unemployment Rate Amomg Seniors Over the Age of 65 in Oregon
RELATED REPORTS & OPTIONS
Lowest Unemployment | Senior > 65
Oregon
Compare Cities
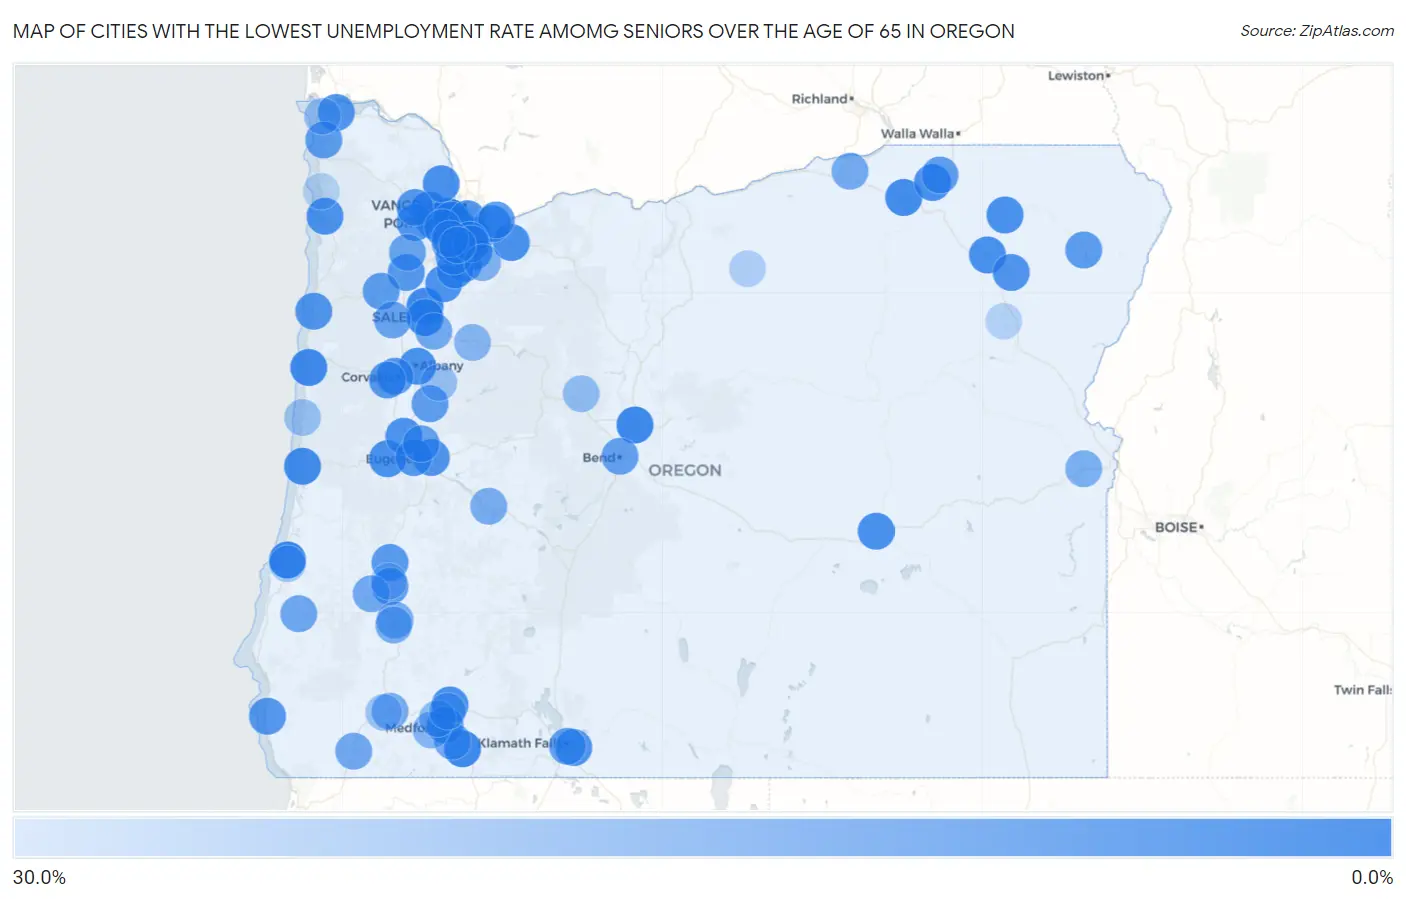
Map of Cities with the Lowest Unemployment Rate Amomg Seniors Over the Age of 65 in Oregon
30.0%
0.0%
Cities with the Lowest Unemployment Rate Amomg Seniors Over the Age of 65 in Oregon
| City | Senior Unemployment | vs State | vs National | |
| 1. | West Slope | 0.50% | 4.7%(-4.20)#1 | 3.9%(-3.40)#73 |
| 2. | North Bend | 0.60% | 4.7%(-4.10)#2 | 3.9%(-3.30)#95 |
| 3. | Redmond | 1.7% | 4.7%(-3.00)#3 | 3.9%(-2.20)#563 |
| 4. | Ashland | 2.2% | 4.7%(-2.50)#4 | 3.9%(-1.70)#891 |
| 5. | Newport | 2.2% | 4.7%(-2.50)#5 | 3.9%(-1.70)#905 |
| 6. | Keizer | 2.3% | 4.7%(-2.40)#6 | 3.9%(-1.60)#948 |
| 7. | Salem | 2.4% | 4.7%(-2.30)#7 | 3.9%(-1.50)#997 |
| 8. | Florence | 2.5% | 4.7%(-2.20)#8 | 3.9%(-1.40)#1,127 |
| 9. | Garden Home Whitford | 2.5% | 4.7%(-2.20)#9 | 3.9%(-1.40)#1,136 |
| 10. | Hillsboro | 2.6% | 4.7%(-2.10)#10 | 3.9%(-1.30)#1,161 |
| 11. | Oatfield | 2.6% | 4.7%(-2.10)#11 | 3.9%(-1.30)#1,193 |
| 12. | Pendleton | 2.7% | 4.7%(-2.00)#12 | 3.9%(-1.20)#1,257 |
| 13. | North Plains | 2.9% | 4.7%(-1.80)#13 | 3.9%(-1.00)#1,437 |
| 14. | Oregon City | 4.0% | 4.7%(-0.700)#14 | 3.9%(+0.100)#2,246 |
| 15. | La Grande | 4.0% | 4.7%(-0.700)#15 | 3.9%(+0.100)#2,274 |
| 16. | Sandy | 4.0% | 4.7%(-0.700)#16 | 3.9%(+0.100)#2,275 |
| 17. | Eagle Point | 4.0% | 4.7%(-0.700)#17 | 3.9%(+0.100)#2,281 |
| 18. | Elgin | 4.0% | 4.7%(-0.700)#18 | 3.9%(+0.100)#2,305 |
| 19. | Beaverton | 4.1% | 4.7%(-0.600)#19 | 3.9%(+0.200)#2,324 |
| 20. | Albany | 4.1% | 4.7%(-0.600)#20 | 3.9%(+0.200)#2,333 |
| 21. | Adams | 4.1% | 4.7%(-0.600)#21 | 3.9%(+0.200)#2,394 |
| 22. | Marlene | 4.2% | 4.7%(-0.500)#22 | 3.9%(+0.300)#2,441 |
| 23. | Burns | 4.3% | 4.7%(-0.400)#23 | 3.9%(+0.400)#2,521 |
| 24. | River Road | 4.4% | 4.7%(-0.300)#24 | 3.9%(+0.500)#2,579 |
| 25. | West Haven Sylvan | 4.4% | 4.7%(-0.300)#25 | 3.9%(+0.500)#2,580 |
| 26. | Lake Oswego | 4.5% | 4.7%(-0.200)#26 | 3.9%(+0.600)#2,629 |
| 27. | Veneta | 4.5% | 4.7%(-0.200)#27 | 3.9%(+0.600)#2,672 |
| 28. | Bethany | 4.6% | 4.7%(-0.100)#28 | 3.9%(+0.700)#2,714 |
| 29. | Scappoose | 4.6% | 4.7%(-0.100)#29 | 3.9%(+0.700)#2,742 |
| 30. | Garibaldi | 4.7% | 4.7%(=0.000)#30 | 3.9%(+0.800)#2,845 |
| 31. | Cedar Mill | 4.8% | 4.7%(+0.100)#31 | 3.9%(+0.900)#2,863 |
| 32. | Woodburn | 5.1% | 4.7%(+0.400)#32 | 3.9%(+1.20)#3,043 |
| 33. | Canby | 5.1% | 4.7%(+0.400)#33 | 3.9%(+1.20)#3,047 |
| 34. | Junction City | 5.1% | 4.7%(+0.400)#34 | 3.9%(+1.20)#3,059 |
| 35. | Medford | 5.3% | 4.7%(+0.600)#35 | 3.9%(+1.40)#3,164 |
| 36. | Springfield | 5.3% | 4.7%(+0.600)#36 | 3.9%(+1.40)#3,171 |
| 37. | Union | 5.3% | 4.7%(+0.600)#37 | 3.9%(+1.40)#3,219 |
| 38. | Altamont | 5.4% | 4.7%(+0.700)#38 | 3.9%(+1.50)#3,248 |
| 39. | Milwaukie | 5.6% | 4.7%(+0.900)#39 | 3.9%(+1.70)#3,347 |
| 40. | Astoria | 5.6% | 4.7%(+0.900)#40 | 3.9%(+1.70)#3,358 |
| 41. | Lincoln City | 5.6% | 4.7%(+0.900)#41 | 3.9%(+1.70)#3,360 |
| 42. | Portland | 5.7% | 4.7%(+1.00)#42 | 3.9%(+1.80)#3,384 |
| 43. | Aurora | 5.9% | 4.7%(+1.20)#43 | 3.9%(+2.00)#3,531 |
| 44. | Forest Grove | 6.2% | 4.7%(+1.50)#44 | 3.9%(+2.30)#3,651 |
| 45. | Gresham | 6.3% | 4.7%(+1.60)#45 | 3.9%(+2.40)#3,705 |
| 46. | King City | 6.3% | 4.7%(+1.60)#46 | 3.9%(+2.40)#3,730 |
| 47. | Tualatin | 6.4% | 4.7%(+1.70)#47 | 3.9%(+2.50)#3,752 |
| 48. | Corvallis | 6.7% | 4.7%(+2.00)#48 | 3.9%(+2.80)#3,933 |
| 49. | Philomath | 6.7% | 4.7%(+2.00)#49 | 3.9%(+2.80)#3,951 |
| 50. | Gold Beach | 6.8% | 4.7%(+2.10)#50 | 3.9%(+2.90)#4,000 |
| 51. | Eugene | 6.9% | 4.7%(+2.20)#51 | 3.9%(+3.00)#4,009 |
| 52. | Banks | 7.1% | 4.7%(+2.40)#52 | 3.9%(+3.20)#4,112 |
| 53. | Mcminnville | 7.2% | 4.7%(+2.50)#53 | 3.9%(+3.30)#4,140 |
| 54. | Sutherlin | 7.4% | 4.7%(+2.70)#54 | 3.9%(+3.50)#4,225 |
| 55. | Roseburg | 7.5% | 4.7%(+2.80)#55 | 3.9%(+3.60)#4,254 |
| 56. | Heceta Beach | 7.7% | 4.7%(+3.00)#56 | 3.9%(+3.80)#4,348 |
| 57. | Sheridan | 7.8% | 4.7%(+3.10)#57 | 3.9%(+3.90)#4,374 |
| 58. | Gearhart | 7.8% | 4.7%(+3.10)#58 | 3.9%(+3.90)#4,387 |
| 59. | Troutdale | 8.1% | 4.7%(+3.40)#59 | 3.9%(+4.20)#4,477 |
| 60. | Joseph | 8.2% | 4.7%(+3.50)#60 | 3.9%(+4.30)#4,531 |
| 61. | Aloha | 8.4% | 4.7%(+3.70)#61 | 3.9%(+4.50)#4,586 |
| 62. | Brownsville | 8.7% | 4.7%(+4.00)#62 | 3.9%(+4.80)#4,702 |
| 63. | Athena | 9.0% | 4.7%(+4.30)#63 | 3.9%(+5.10)#4,792 |
| 64. | Oak Grove | 9.1% | 4.7%(+4.40)#64 | 3.9%(+5.20)#4,814 |
| 65. | Klamath Falls | 9.6% | 4.7%(+4.90)#65 | 3.9%(+5.70)#4,976 |
| 66. | Bend | 9.8% | 4.7%(+5.10)#66 | 3.9%(+5.90)#5,023 |
| 67. | Wilsonville | 10.2% | 4.7%(+5.50)#67 | 3.9%(+6.30)#5,140 |
| 68. | Coburg | 10.2% | 4.7%(+5.50)#68 | 3.9%(+6.30)#5,164 |
| 69. | Prineville Lake Acres | 10.2% | 4.7%(+5.50)#69 | 3.9%(+6.30)#5,166 |
| 70. | Dallas | 10.6% | 4.7%(+5.90)#70 | 3.9%(+6.70)#5,248 |
| 71. | Yamhill | 11.1% | 4.7%(+6.40)#71 | 3.9%(+7.20)#5,360 |
| 72. | Jennings Lodge | 12.0% | 4.7%(+7.30)#72 | 3.9%(+8.10)#5,526 |
| 73. | Myrtle Point | 12.0% | 4.7%(+7.30)#73 | 3.9%(+8.10)#5,529 |
| 74. | Tigard | 12.2% | 4.7%(+7.50)#74 | 3.9%(+8.30)#5,553 |
| 75. | Cave Junction | 12.2% | 4.7%(+7.50)#75 | 3.9%(+8.30)#5,563 |
| 76. | Lookingglass | 12.3% | 4.7%(+7.60)#76 | 3.9%(+8.40)#5,575 |
| 77. | Turner | 12.9% | 4.7%(+8.20)#77 | 3.9%(+9.00)#5,687 |
| 78. | Hermiston | 13.0% | 4.7%(+8.30)#78 | 3.9%(+9.10)#5,703 |
| 79. | Talent | 13.1% | 4.7%(+8.40)#79 | 3.9%(+9.20)#5,718 |
| 80. | Grants Pass | 13.7% | 4.7%(+9.00)#80 | 3.9%(+9.80)#5,799 |
| 81. | Myrtle Creek | 13.7% | 4.7%(+9.00)#81 | 3.9%(+9.80)#5,803 |
| 82. | Oakridge | 14.0% | 4.7%(+9.30)#82 | 3.9%(+10.1)#5,842 |
| 83. | Tri City | 14.3% | 4.7%(+9.60)#83 | 3.9%(+10.4)#5,903 |
| 84. | Vale | 14.6% | 4.7%(+9.90)#84 | 3.9%(+10.7)#5,930 |
| 85. | Beavercreek | 15.7% | 4.7%(+11.0)#85 | 3.9%(+11.8)#6,037 |
| 86. | Jacksonville | 17.0% | 4.7%(+12.3)#86 | 3.9%(+13.1)#6,216 |
| 87. | Lyons | 17.0% | 4.7%(+12.3)#87 | 3.9%(+13.1)#6,220 |
| 88. | Central Point | 17.9% | 4.7%(+13.2)#88 | 3.9%(+14.0)#6,295 |
| 89. | Rivergrove | 19.2% | 4.7%(+14.5)#89 | 3.9%(+15.3)#6,428 |
| 90. | White City | 19.4% | 4.7%(+14.7)#90 | 3.9%(+15.5)#6,435 |
| 91. | Camp Sherman | 19.9% | 4.7%(+15.2)#91 | 3.9%(+16.0)#6,478 |
| 92. | Lebanon | 20.1% | 4.7%(+15.4)#92 | 3.9%(+16.2)#6,512 |
| 93. | Warrenton | 20.5% | 4.7%(+15.8)#93 | 3.9%(+16.6)#6,528 |
| 94. | Yachats | 21.1% | 4.7%(+16.4)#94 | 3.9%(+17.2)#6,562 |
| 95. | Redwood | 21.8% | 4.7%(+17.1)#95 | 3.9%(+17.9)#6,598 |
| 96. | Coos Bay | 23.7% | 4.7%(+19.0)#96 | 3.9%(+19.8)#6,702 |
| 97. | Condon | 25.0% | 4.7%(+20.3)#97 | 3.9%(+21.1)#6,776 |
| 98. | Roseburg North | 26.0% | 4.7%(+21.3)#98 | 3.9%(+22.1)#6,820 |
| 99. | Haines | 26.2% | 4.7%(+21.5)#99 | 3.9%(+22.3)#6,832 |
| 100. | Manzanita | 26.8% | 4.7%(+22.1)#100 | 3.9%(+22.9)#6,849 |
Common Questions
What are the Top 10 Cities with the Lowest Unemployment Rate Amomg Seniors Over the Age of 65 in Oregon?
Top 10 Cities with the Lowest Unemployment Rate Amomg Seniors Over the Age of 65 in Oregon are:
#1
0.50%
#2
0.60%
#3
1.7%
#4
2.2%
#5
2.2%
#6
2.3%
#7
2.4%
#8
2.5%
#9
2.5%
#10
2.6%
What city has the Lowest Unemployment Rate Amomg Seniors Over the Age of 65 in Oregon?
West Slope has the Lowest Unemployment Rate Amomg Seniors Over the Age of 65 in Oregon with 0.50%.
What is the Unemployment Rate Amomg Seniors Over the Age of 65 in the State of Oregon?
Unemployment Rate Amomg Seniors Over the Age of 65 in Oregon is 4.7%.
What is the Unemployment Rate Amomg Seniors Over the Age of 65 in the United States?
Unemployment Rate Amomg Seniors Over the Age of 65 in the United States is 3.9%.