Cities with the Lowest Unemployment Rate Amomg Seniors Over the Age of 65 in Ohio
RELATED REPORTS & OPTIONS
Lowest Unemployment | Senior > 65
Ohio
Compare Cities
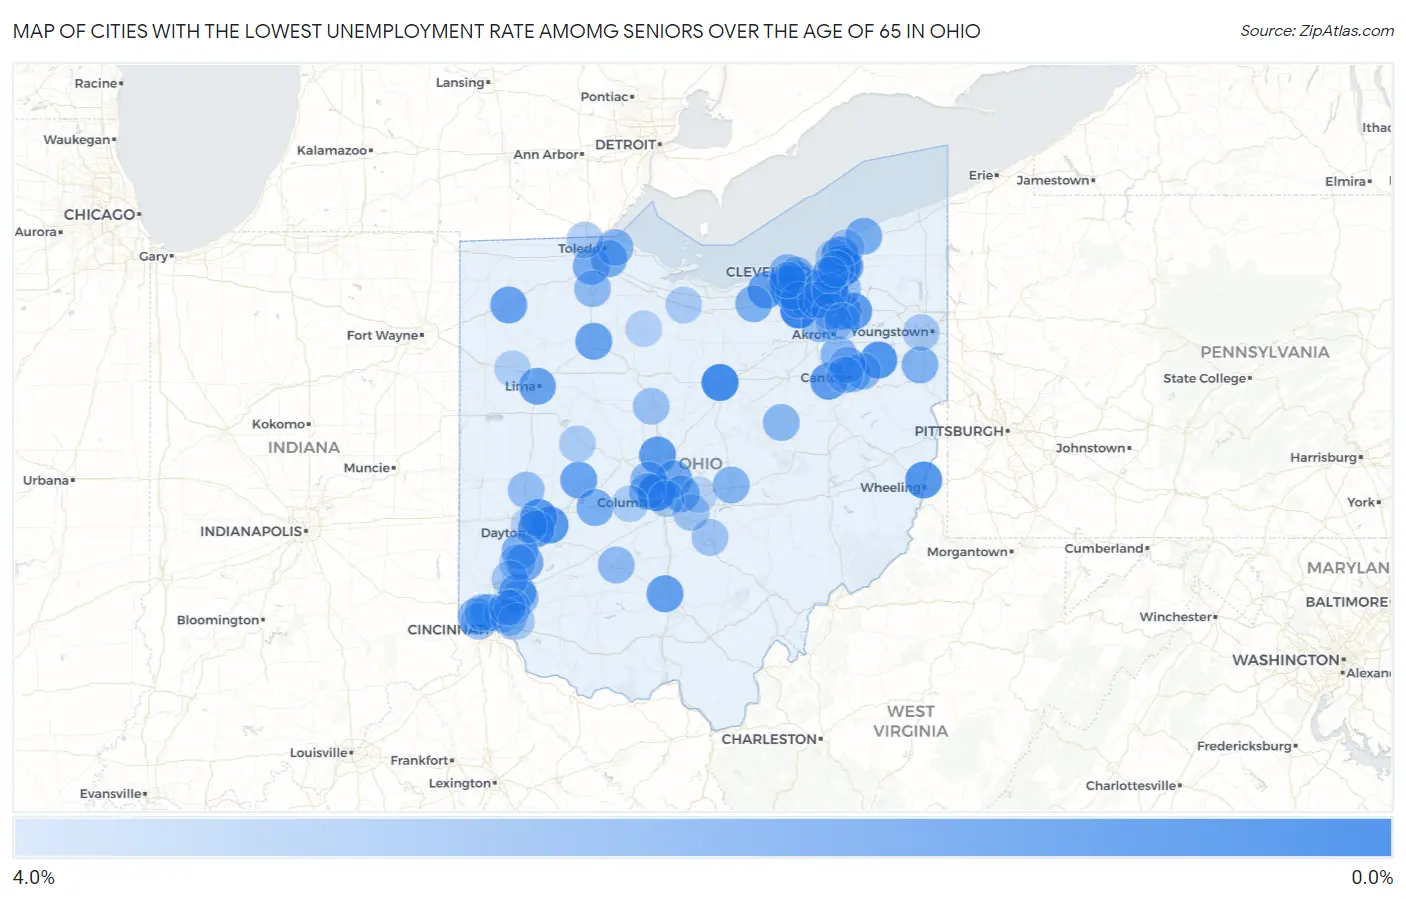
Map of Cities with the Lowest Unemployment Rate Amomg Seniors Over the Age of 65 in Ohio
4.0%
0.0%
Cities with the Lowest Unemployment Rate Amomg Seniors Over the Age of 65 in Ohio
| City | Senior Unemployment | vs State | vs National | |
| 1. | Brunswick | 0.10% | 3.3%(-3.20)#1 | 3.9%(-3.80)#2 |
| 2. | Mansfield | 0.40% | 3.3%(-2.90)#2 | 3.9%(-3.50)#29 |
| 3. | Upper Arlington | 0.50% | 3.3%(-2.80)#3 | 3.9%(-3.40)#57 |
| 4. | North Royalton | 0.80% | 3.3%(-2.50)#4 | 3.9%(-3.10)#140 |
| 5. | Alliance | 0.90% | 3.3%(-2.40)#5 | 3.9%(-3.00)#173 |
| 6. | Olmsted Falls | 0.90% | 3.3%(-2.40)#6 | 3.9%(-3.00)#187 |
| 7. | Martins Ferry | 0.90% | 3.3%(-2.40)#7 | 3.9%(-3.00)#190 |
| 8. | Fairborn | 1.0% | 3.3%(-2.30)#8 | 3.9%(-2.90)#204 |
| 9. | Mayfield Heights | 1.0% | 3.3%(-2.30)#9 | 3.9%(-2.90)#213 |
| 10. | Huber Heights | 1.1% | 3.3%(-2.20)#10 | 3.9%(-2.80)#244 |
| 11. | Beachwood | 1.1% | 3.3%(-2.20)#11 | 3.9%(-2.80)#269 |
| 12. | Mayfield | 1.1% | 3.3%(-2.20)#12 | 3.9%(-2.80)#281 |
| 13. | Delaware | 1.2% | 3.3%(-2.10)#13 | 3.9%(-2.70)#286 |
| 14. | North Olmsted | 1.2% | 3.3%(-2.10)#14 | 3.9%(-2.70)#292 |
| 15. | Hudson | 1.2% | 3.3%(-2.10)#15 | 3.9%(-2.70)#301 |
| 16. | Wickliffe | 1.2% | 3.3%(-2.10)#16 | 3.9%(-2.70)#317 |
| 17. | Seven Hills | 1.2% | 3.3%(-2.10)#17 | 3.9%(-2.70)#320 |
| 18. | Massillon | 1.3% | 3.3%(-2.00)#18 | 3.9%(-2.60)#348 |
| 19. | Streetsboro | 1.3% | 3.3%(-2.00)#19 | 3.9%(-2.60)#367 |
| 20. | Elyria | 1.4% | 3.3%(-1.90)#20 | 3.9%(-2.50)#390 |
| 21. | Chillicothe | 1.4% | 3.3%(-1.90)#21 | 3.9%(-2.50)#402 |
| 22. | Lima | 1.5% | 3.3%(-1.80)#22 | 3.9%(-2.40)#448 |
| 23. | Mason | 1.5% | 3.3%(-1.80)#23 | 3.9%(-2.40)#451 |
| 24. | Berea | 1.5% | 3.3%(-1.80)#24 | 3.9%(-2.40)#466 |
| 25. | Defiance | 1.5% | 3.3%(-1.80)#25 | 3.9%(-2.40)#467 |
| 26. | Findlay | 1.6% | 3.3%(-1.70)#26 | 3.9%(-2.30)#497 |
| 27. | Riverside | 1.6% | 3.3%(-1.70)#27 | 3.9%(-2.30)#508 |
| 28. | Urbana | 1.6% | 3.3%(-1.70)#28 | 3.9%(-2.30)#528 |
| 29. | Highland Heights | 1.7% | 3.3%(-1.60)#29 | 3.9%(-2.20)#590 |
| 30. | Gates Mills | 1.7% | 3.3%(-1.60)#30 | 3.9%(-2.20)#603 |
| 31. | Westerville | 1.8% | 3.3%(-1.50)#31 | 3.9%(-2.10)#622 |
| 32. | Springboro | 1.9% | 3.3%(-1.40)#32 | 3.9%(-2.00)#694 |
| 33. | Fairview Park | 1.9% | 3.3%(-1.40)#33 | 3.9%(-2.00)#699 |
| 34. | Perrysburg | 2.0% | 3.3%(-1.30)#34 | 3.9%(-1.90)#755 |
| 35. | Walbridge | 2.0% | 3.3%(-1.30)#35 | 3.9%(-1.90)#790 |
| 36. | Gahanna | 2.1% | 3.3%(-1.20)#36 | 3.9%(-1.80)#808 |
| 37. | Painesville | 2.1% | 3.3%(-1.20)#37 | 3.9%(-1.80)#823 |
| 38. | Miamisburg | 2.1% | 3.3%(-1.20)#38 | 3.9%(-1.80)#824 |
| 39. | South Vienna | 2.1% | 3.3%(-1.20)#39 | 3.9%(-1.80)#858 |
| 40. | North College Hill | 2.2% | 3.3%(-1.10)#40 | 3.9%(-1.70)#907 |
| 41. | Oberlin | 2.2% | 3.3%(-1.10)#41 | 3.9%(-1.70)#911 |
| 42. | Canton | 2.3% | 3.3%(-1.00)#42 | 3.9%(-1.60)#938 |
| 43. | Leetonia | 2.3% | 3.3%(-1.00)#43 | 3.9%(-1.60)#990 |
| 44. | Newark | 2.4% | 3.3%(-0.900)#44 | 3.9%(-1.50)#1,017 |
| 45. | Oregon | 2.4% | 3.3%(-0.900)#45 | 3.9%(-1.50)#1,038 |
| 46. | Dent | 2.4% | 3.3%(-0.900)#46 | 3.9%(-1.50)#1,053 |
| 47. | Dublin | 2.5% | 3.3%(-0.800)#47 | 3.9%(-1.40)#1,096 |
| 48. | Green | 2.5% | 3.3%(-0.800)#48 | 3.9%(-1.40)#1,108 |
| 49. | Bay Village | 2.5% | 3.3%(-0.800)#49 | 3.9%(-1.40)#1,119 |
| 50. | Landen | 2.5% | 3.3%(-0.800)#50 | 3.9%(-1.40)#1,131 |
| 51. | Killbuck | 2.5% | 3.3%(-0.800)#51 | 3.9%(-1.40)#1,154 |
| 52. | Bowling Green | 2.6% | 3.3%(-0.700)#52 | 3.9%(-1.30)#1,175 |
| 53. | Rocky River | 2.6% | 3.3%(-0.700)#53 | 3.9%(-1.30)#1,184 |
| 54. | Washington Court House | 2.6% | 3.3%(-0.700)#54 | 3.9%(-1.30)#1,191 |
| 55. | Bedford | 2.6% | 3.3%(-0.700)#55 | 3.9%(-1.30)#1,194 |
| 56. | Louisville | 2.6% | 3.3%(-0.700)#56 | 3.9%(-1.30)#1,199 |
| 57. | Strongsville | 2.7% | 3.3%(-0.600)#57 | 3.9%(-1.20)#1,235 |
| 58. | Hilliard | 2.7% | 3.3%(-0.600)#58 | 3.9%(-1.20)#1,238 |
| 59. | Solon | 2.8% | 3.3%(-0.500)#59 | 3.9%(-1.10)#1,325 |
| 60. | North Canton | 2.8% | 3.3%(-0.500)#60 | 3.9%(-1.10)#1,331 |
| 61. | Montrose Ghent | 2.8% | 3.3%(-0.500)#61 | 3.9%(-1.10)#1,353 |
| 62. | Northfield | 2.8% | 3.3%(-0.500)#62 | 3.9%(-1.10)#1,357 |
| 63. | Troy | 2.9% | 3.3%(-0.400)#63 | 3.9%(-1.00)#1,403 |
| 64. | Brecksville | 2.9% | 3.3%(-0.400)#64 | 3.9%(-1.00)#1,414 |
| 65. | Bridgetown | 2.9% | 3.3%(-0.400)#65 | 3.9%(-1.00)#1,415 |
| 66. | Amberley | 2.9% | 3.3%(-0.400)#66 | 3.9%(-1.00)#1,434 |
| 67. | Marion | 3.0% | 3.3%(-0.300)#67 | 3.9%(-0.900)#1,470 |
| 68. | Maple Heights | 3.0% | 3.3%(-0.300)#68 | 3.9%(-0.900)#1,480 |
| 69. | White Oak | 3.0% | 3.3%(-0.300)#69 | 3.9%(-0.900)#1,487 |
| 70. | Madeira | 3.0% | 3.3%(-0.300)#70 | 3.9%(-0.900)#1,501 |
| 71. | Valley View | 3.0% | 3.3%(-0.300)#71 | 3.9%(-0.900)#1,519 |
| 72. | Lancaster | 3.1% | 3.3%(-0.200)#72 | 3.9%(-0.800)#1,546 |
| 73. | Pickerington | 3.1% | 3.3%(-0.200)#73 | 3.9%(-0.800)#1,555 |
| 74. | Broadview Heights | 3.1% | 3.3%(-0.200)#74 | 3.9%(-0.800)#1,561 |
| 75. | University Heights | 3.1% | 3.3%(-0.200)#75 | 3.9%(-0.800)#1,570 |
| 76. | Franklin | 3.1% | 3.3%(-0.200)#76 | 3.9%(-0.800)#1,573 |
| 77. | Westlake | 3.2% | 3.3%(-0.100)#77 | 3.9%(-0.700)#1,647 |
| 78. | Monroe | 3.2% | 3.3%(-0.100)#78 | 3.9%(-0.700)#1,662 |
| 79. | Montgomery | 3.2% | 3.3%(-0.100)#79 | 3.9%(-0.700)#1,667 |
| 80. | Peninsula | 3.2% | 3.3%(-0.100)#80 | 3.9%(-0.700)#1,701 |
| 81. | Austintown | 3.3% | 3.3%(=0.000)#81 | 3.9%(-0.600)#1,726 |
| 82. | Sylvania | 3.3% | 3.3%(=0.000)#82 | 3.9%(-0.600)#1,738 |
| 83. | Terrace Park | 3.3% | 3.3%(=0.000)#83 | 3.9%(-0.600)#1,772 |
| 84. | Meyers Lake | 3.3% | 3.3%(=0.000)#84 | 3.9%(-0.600)#1,779 |
| 85. | Cuyahoga Falls | 3.4% | 3.3%(+0.100)#85 | 3.9%(-0.500)#1,795 |
| 86. | Euclid | 3.4% | 3.3%(+0.100)#86 | 3.9%(-0.500)#1,796 |
| 87. | Willoughby | 3.4% | 3.3%(+0.100)#87 | 3.9%(-0.500)#1,808 |
| 88. | Blue Ash | 3.4% | 3.3%(+0.100)#88 | 3.9%(-0.500)#1,821 |
| 89. | Bellevue | 3.4% | 3.3%(+0.100)#89 | 3.9%(-0.500)#1,829 |
| 90. | Walton Hills | 3.4% | 3.3%(+0.100)#90 | 3.9%(-0.500)#1,850 |
| 91. | Columbus | 3.5% | 3.3%(+0.200)#91 | 3.9%(-0.400)#1,857 |
| 92. | Lyndhurst | 3.5% | 3.3%(+0.200)#92 | 3.9%(-0.400)#1,896 |
| 93. | Bellefontaine | 3.5% | 3.3%(+0.200)#93 | 3.9%(-0.400)#1,897 |
| 94. | West Jefferson | 3.5% | 3.3%(+0.200)#94 | 3.9%(-0.400)#1,916 |
| 95. | Delphos | 3.6% | 3.3%(+0.300)#95 | 3.9%(-0.300)#1,981 |
| 96. | Stow | 3.7% | 3.3%(+0.400)#96 | 3.9%(-0.200)#2,018 |
| 97. | Tiffin | 3.7% | 3.3%(+0.400)#97 | 3.9%(-0.200)#2,030 |
| 98. | Dayton | 3.8% | 3.3%(+0.500)#98 | 3.9%(-0.100)#2,071 |
| 99. | Shaker Heights | 3.8% | 3.3%(+0.500)#99 | 3.9%(-0.100)#2,094 |
| 100. | Pataskala | 3.8% | 3.3%(+0.500)#100 | 3.9%(-0.100)#2,103 |
Common Questions
What are the Top 10 Cities with the Lowest Unemployment Rate Amomg Seniors Over the Age of 65 in Ohio?
Top 10 Cities with the Lowest Unemployment Rate Amomg Seniors Over the Age of 65 in Ohio are:
#1
0.10%
#2
0.40%
#3
0.50%
#4
0.80%
#5
0.90%
#6
0.90%
#7
0.90%
#8
1.0%
#9
1.0%
#10
1.1%
What city has the Lowest Unemployment Rate Amomg Seniors Over the Age of 65 in Ohio?
Brunswick has the Lowest Unemployment Rate Amomg Seniors Over the Age of 65 in Ohio with 0.10%.
What is the Unemployment Rate Amomg Seniors Over the Age of 65 in the State of Ohio?
Unemployment Rate Amomg Seniors Over the Age of 65 in Ohio is 3.3%.
What is the Unemployment Rate Amomg Seniors Over the Age of 65 in the United States?
Unemployment Rate Amomg Seniors Over the Age of 65 in the United States is 3.9%.