Cities with the Lowest Unemployment Rate Amomg Seniors Over the Age of 65 in Kansas
RELATED REPORTS & OPTIONS
Lowest Unemployment | Senior > 65
Kansas
Compare Cities
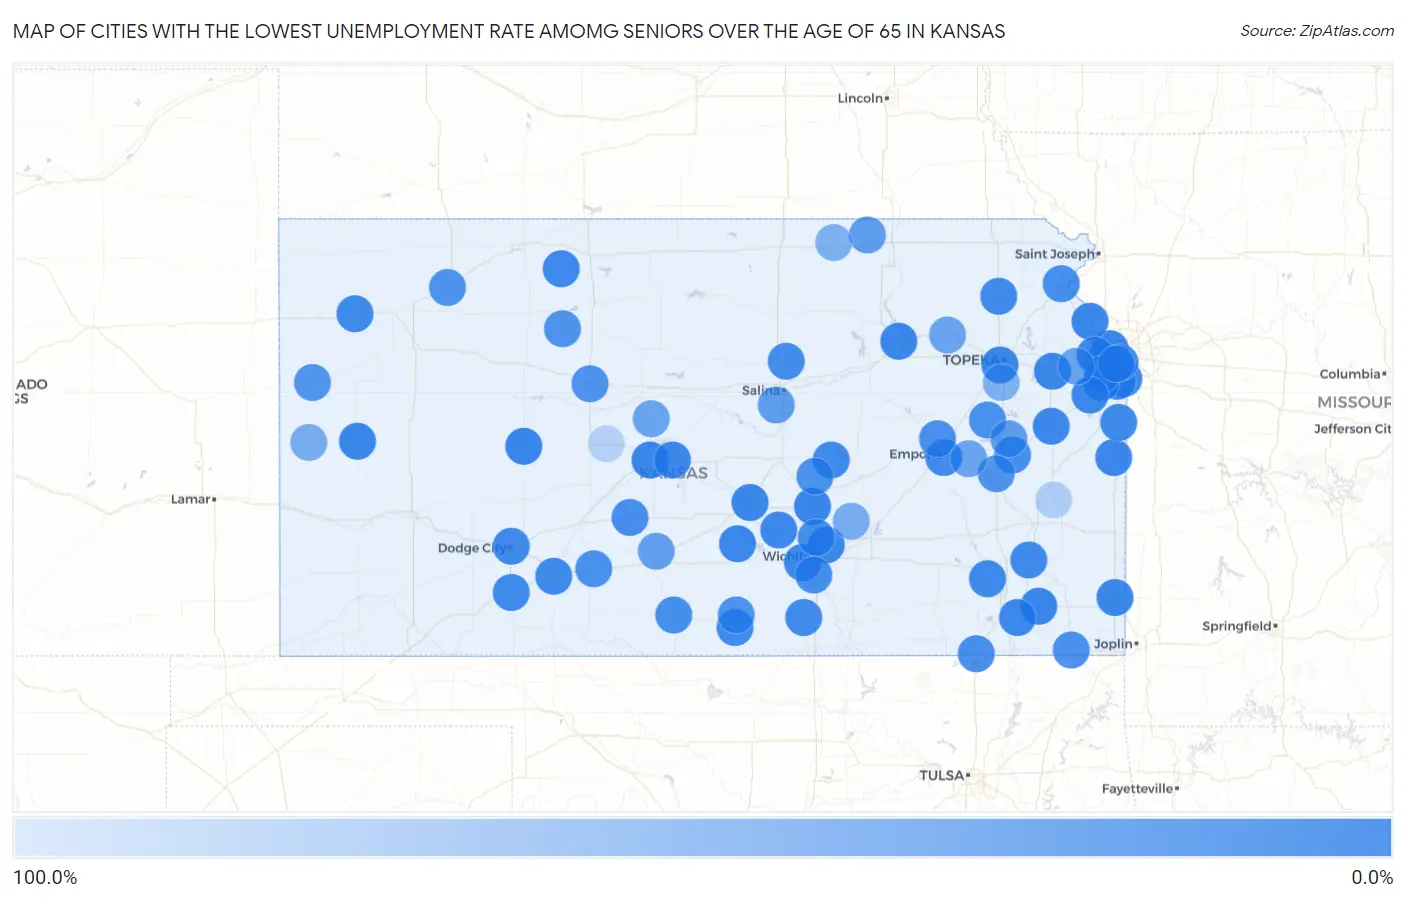
Map of Cities with the Lowest Unemployment Rate Amomg Seniors Over the Age of 65 in Kansas
100.0%
0.0%
Cities with the Lowest Unemployment Rate Amomg Seniors Over the Age of 65 in Kansas
| City | Senior Unemployment | vs State | vs National | |
| 1. | Parsons | 0.20% | 1.9%(-1.70)#1 | 3.9%(-3.70)#11 |
| 2. | Shawnee | 0.70% | 1.9%(-1.20)#2 | 3.9%(-3.20)#105 |
| 3. | Kansas City | 0.80% | 1.9%(-1.10)#3 | 3.9%(-3.10)#131 |
| 4. | Newton | 0.90% | 1.9%(-1.000)#4 | 3.9%(-3.00)#177 |
| 5. | Ness City | 1.0% | 1.9%(-0.900)#5 | 3.9%(-2.90)#237 |
| 6. | Hutchinson | 1.3% | 1.9%(-0.600)#6 | 3.9%(-2.60)#342 |
| 7. | Great Bend | 1.3% | 1.9%(-0.600)#7 | 3.9%(-2.60)#373 |
| 8. | Manhattan | 1.7% | 1.9%(-0.200)#8 | 3.9%(-2.20)#556 |
| 9. | Leawood | 1.8% | 1.9%(-0.100)#9 | 3.9%(-2.10)#626 |
| 10. | Topeka | 2.0% | 1.9%(+0.100)#10 | 3.9%(-1.90)#731 |
| 11. | Leavenworth | 2.0% | 1.9%(+0.100)#11 | 3.9%(-1.90)#743 |
| 12. | Pittsburg | 2.2% | 1.9%(+0.300)#12 | 3.9%(-1.70)#893 |
| 13. | Bonner Springs | 2.4% | 1.9%(+0.500)#13 | 3.9%(-1.50)#1,065 |
| 14. | Lawrence | 2.5% | 1.9%(+0.600)#14 | 3.9%(-1.40)#1,084 |
| 15. | Leoti | 2.5% | 1.9%(+0.600)#15 | 3.9%(-1.40)#1,149 |
| 16. | Overland Park | 2.7% | 1.9%(+0.800)#16 | 3.9%(-1.20)#1,221 |
| 17. | Linn Valley | 2.7% | 1.9%(+0.800)#17 | 3.9%(-1.20)#1,290 |
| 18. | Wichita | 2.8% | 1.9%(+0.900)#18 | 3.9%(-1.10)#1,294 |
| 19. | Ellinwood | 2.8% | 1.9%(+0.900)#19 | 3.9%(-1.10)#1,358 |
| 20. | Olathe | 3.1% | 1.9%(+1.20)#20 | 3.9%(-0.800)#1,531 |
| 21. | Logan | 3.1% | 1.9%(+1.20)#21 | 3.9%(-0.800)#1,611 |
| 22. | Mount Hope | 3.2% | 1.9%(+1.30)#22 | 3.9%(-0.700)#1,699 |
| 23. | Ottawa | 3.3% | 1.9%(+1.40)#23 | 3.9%(-0.600)#1,749 |
| 24. | Mission | 3.3% | 1.9%(+1.40)#24 | 3.9%(-0.600)#1,756 |
| 25. | Cherryvale | 3.3% | 1.9%(+1.40)#25 | 3.9%(-0.600)#1,773 |
| 26. | Lenexa | 4.0% | 1.9%(+2.10)#26 | 3.9%(+0.100)#2,242 |
| 27. | Pretty Prairie | 4.1% | 1.9%(+2.20)#27 | 3.9%(+0.200)#2,392 |
| 28. | Gardner | 4.3% | 1.9%(+2.40)#28 | 3.9%(+0.400)#2,486 |
| 29. | Louisburg | 4.4% | 1.9%(+2.50)#29 | 3.9%(+0.500)#2,587 |
| 30. | Bel Aire | 5.1% | 1.9%(+3.20)#30 | 3.9%(+1.20)#3,056 |
| 31. | Hillsboro | 5.1% | 1.9%(+3.20)#31 | 3.9%(+1.20)#3,073 |
| 32. | Bucklin | 5.2% | 1.9%(+3.30)#32 | 3.9%(+1.30)#3,147 |
| 33. | Fredonia | 5.6% | 1.9%(+3.70)#33 | 3.9%(+1.70)#3,375 |
| 34. | Wellington | 6.2% | 1.9%(+4.30)#34 | 3.9%(+2.30)#3,666 |
| 35. | Holton | 6.2% | 1.9%(+4.30)#35 | 3.9%(+2.30)#3,676 |
| 36. | Minneola | 6.2% | 1.9%(+4.30)#36 | 3.9%(+2.30)#3,691 |
| 37. | Emporia | 6.3% | 1.9%(+4.40)#37 | 3.9%(+2.40)#3,713 |
| 38. | Merriam | 6.3% | 1.9%(+4.40)#38 | 3.9%(+2.40)#3,719 |
| 39. | Dodge City | 6.4% | 1.9%(+4.50)#39 | 3.9%(+2.50)#3,753 |
| 40. | Chanute | 6.5% | 1.9%(+4.60)#40 | 3.9%(+2.60)#3,841 |
| 41. | Anthony | 7.1% | 1.9%(+5.20)#41 | 3.9%(+3.20)#4,110 |
| 42. | Brewster | 7.1% | 1.9%(+5.20)#42 | 3.9%(+3.20)#4,126 |
| 43. | Bennington | 9.3% | 1.9%(+7.40)#43 | 3.9%(+5.40)#4,911 |
| 44. | Waverly | 9.5% | 1.9%(+7.60)#44 | 3.9%(+5.60)#4,973 |
| 45. | Park City | 9.8% | 1.9%(+7.90)#45 | 3.9%(+5.90)#5,042 |
| 46. | Medicine Lodge | 9.8% | 1.9%(+7.90)#46 | 3.9%(+5.90)#5,053 |
| 47. | Haysville | 10.2% | 1.9%(+8.30)#47 | 3.9%(+6.30)#5,146 |
| 48. | Atchison | 10.7% | 1.9%(+8.80)#48 | 3.9%(+6.80)#5,269 |
| 49. | Macksville | 11.1% | 1.9%(+9.20)#49 | 3.9%(+7.20)#5,371 |
| 50. | Caney | 11.4% | 1.9%(+9.50)#50 | 3.9%(+7.50)#5,429 |
| 51. | Osage City | 12.7% | 1.9%(+10.8)#51 | 3.9%(+8.80)#5,666 |
| 52. | Chetopa | 12.9% | 1.9%(+11.0)#52 | 3.9%(+9.00)#5,694 |
| 53. | Goessel | 13.3% | 1.9%(+11.4)#53 | 3.9%(+9.40)#5,753 |
| 54. | Americus | 13.6% | 1.9%(+11.7)#54 | 3.9%(+9.70)#5,795 |
| 55. | Greensburg | 14.7% | 1.9%(+12.8)#55 | 3.9%(+10.8)#5,940 |
| 56. | Hays | 16.1% | 1.9%(+14.2)#56 | 3.9%(+12.2)#6,084 |
| 57. | Selden | 16.6% | 1.9%(+14.7)#57 | 3.9%(+12.7)#6,165 |
| 58. | Harper | 17.1% | 1.9%(+15.2)#58 | 3.9%(+13.2)#6,231 |
| 59. | Palco | 17.6% | 1.9%(+15.7)#59 | 3.9%(+13.7)#6,278 |
| 60. | New Strawn | 18.5% | 1.9%(+16.6)#60 | 3.9%(+14.6)#6,369 |
| 61. | Sharon Springs | 19.9% | 1.9%(+18.0)#61 | 3.9%(+16.0)#6,466 |
| 62. | Melvern | 29.4% | 1.9%(+27.5)#62 | 3.9%(+25.5)#6,958 |
| 63. | Hanover | 30.7% | 1.9%(+28.8)#63 | 3.9%(+26.8)#6,989 |
| 64. | Smolan | 30.7% | 1.9%(+28.8)#64 | 3.9%(+26.8)#6,993 |
| 65. | Iuka | 33.7% | 1.9%(+31.8)#65 | 3.9%(+29.8)#7,108 |
| 66. | Linwood | 39.9% | 1.9%(+38.0)#66 | 3.9%(+36.0)#7,215 |
| 67. | Neosho Rapids | 40.0% | 1.9%(+38.1)#67 | 3.9%(+36.1)#7,230 |
| 68. | Belvue | 40.0% | 1.9%(+38.1)#68 | 3.9%(+36.1)#7,234 |
| 69. | Susank | 40.0% | 1.9%(+38.1)#69 | 3.9%(+36.1)#7,240 |
| 70. | Potwin | 49.9% | 1.9%(+48.0)#70 | 3.9%(+46.0)#7,351 |
| 71. | Horace | 49.9% | 1.9%(+48.0)#71 | 3.9%(+46.0)#7,360 |
| 72. | Morrowville | 55.6% | 1.9%(+53.7)#72 | 3.9%(+51.7)#7,402 |
| 73. | Wakarusa | 57.1% | 1.9%(+55.2)#73 | 3.9%(+53.2)#7,409 |
| 74. | Lone Elm | 94.7% | 1.9%(+92.8)#74 | 3.9%(+90.8)#7,523 |
| 75. | Timken | 99.9% | 1.9%(+98.0)#75 | 3.9%(+96.0)#7,563 |
| 76. | Beaumont | 100.0% | 1.9%(+98.1)#76 | 3.9%(+96.1)#7,616 |
Common Questions
What are the Top 10 Cities with the Lowest Unemployment Rate Amomg Seniors Over the Age of 65 in Kansas?
Top 10 Cities with the Lowest Unemployment Rate Amomg Seniors Over the Age of 65 in Kansas are:
#1
0.0%
#2
0.0%
#3
0.0%
#4
0.0%
#5
0.0%
#6
0.0%
#7
0.0%
#8
0.0%
#9
0.0%
#10
0.0%
What city has the Lowest Unemployment Rate Amomg Seniors Over the Age of 65 in Kansas?
Parsons has the Lowest Unemployment Rate Amomg Seniors Over the Age of 65 in Kansas with 0.20%.
What is the Unemployment Rate Amomg Seniors Over the Age of 65 in the State of Kansas?
Unemployment Rate Amomg Seniors Over the Age of 65 in Kansas is 1.9%.
What is the Unemployment Rate Amomg Seniors Over the Age of 65 in the United States?
Unemployment Rate Amomg Seniors Over the Age of 65 in the United States is 3.9%.