Cities with the Lowest Unemployment Rate Amomg Seniors Over the Age of 65 in Illinois
RELATED REPORTS & OPTIONS
Lowest Unemployment | Senior > 65
Illinois
Compare Cities
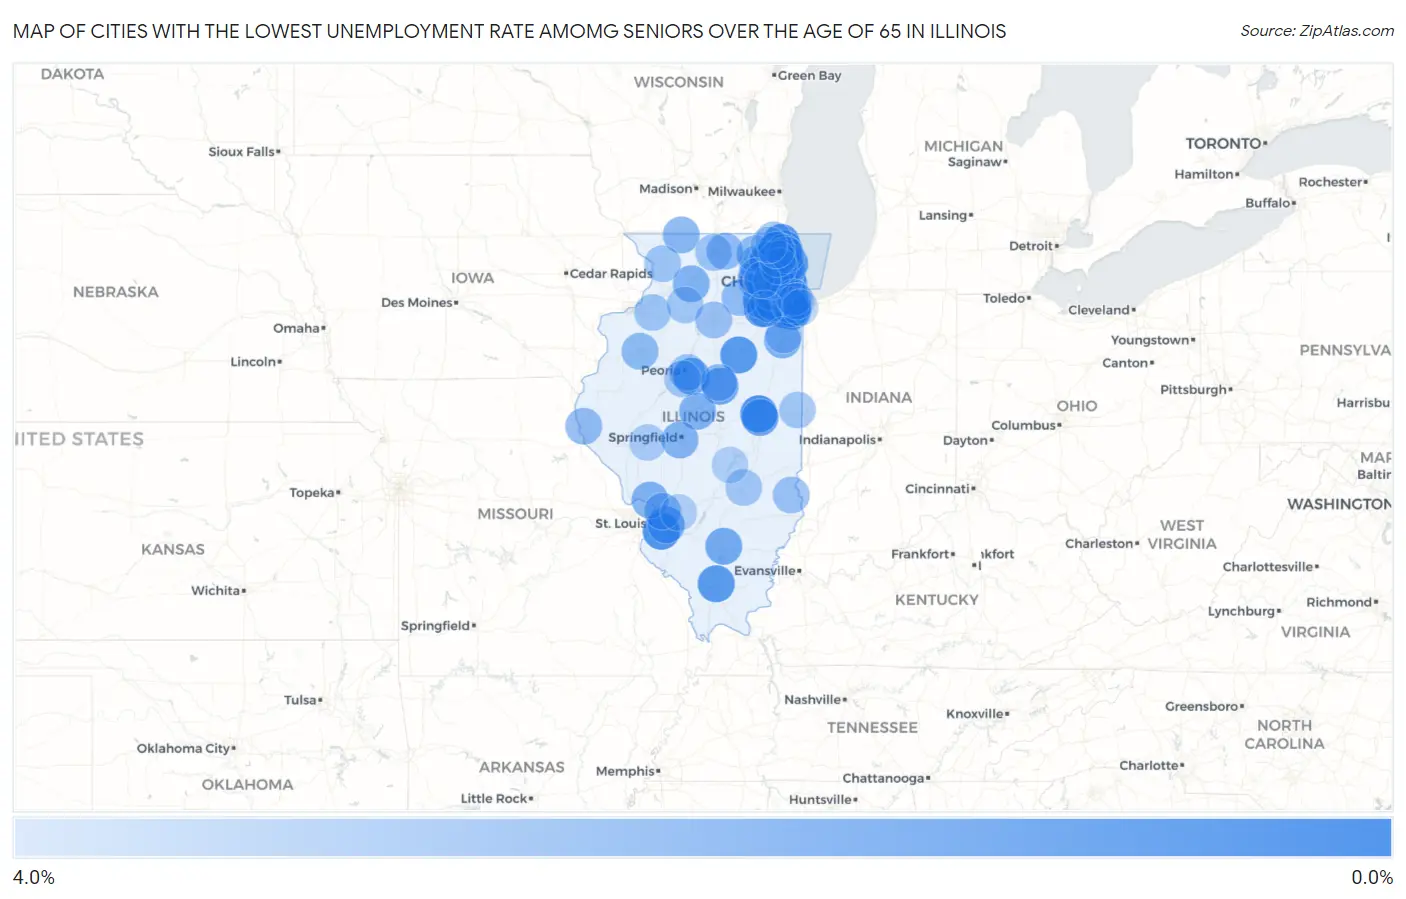
Map of Cities with the Lowest Unemployment Rate Amomg Seniors Over the Age of 65 in Illinois
4.0%
0.0%
Cities with the Lowest Unemployment Rate Amomg Seniors Over the Age of 65 in Illinois
| City | Senior Unemployment | vs State | vs National | |
| 1. | Wheaton | 0.40% | 4.1%(-3.70)#1 | 3.9%(-3.50)#27 |
| 2. | Flossmoor | 0.40% | 4.1%(-3.70)#2 | 3.9%(-3.50)#41 |
| 3. | Morton Grove | 0.60% | 4.1%(-3.50)#3 | 3.9%(-3.30)#87 |
| 4. | Prospect Heights | 0.60% | 4.1%(-3.50)#4 | 3.9%(-3.30)#94 |
| 5. | Cicero | 0.70% | 4.1%(-3.40)#5 | 3.9%(-3.20)#103 |
| 6. | Elk Grove Village | 0.70% | 4.1%(-3.40)#6 | 3.9%(-3.20)#117 |
| 7. | Mundelein | 0.80% | 4.1%(-3.30)#7 | 3.9%(-3.10)#138 |
| 8. | Champaign | 0.90% | 4.1%(-3.20)#8 | 3.9%(-3.00)#153 |
| 9. | Addison | 0.90% | 4.1%(-3.20)#9 | 3.9%(-3.00)#162 |
| 10. | Shorewood | 0.90% | 4.1%(-3.20)#10 | 3.9%(-3.00)#179 |
| 11. | Belleville | 1.0% | 4.1%(-3.10)#11 | 3.9%(-2.90)#201 |
| 12. | Waukegan | 1.1% | 4.1%(-3.00)#12 | 3.9%(-2.80)#240 |
| 13. | Herrin | 1.2% | 4.1%(-2.90)#13 | 3.9%(-2.70)#318 |
| 14. | Pontiac | 1.2% | 4.1%(-2.90)#14 | 3.9%(-2.70)#321 |
| 15. | Burr Ridge | 1.2% | 4.1%(-2.90)#15 | 3.9%(-2.70)#322 |
| 16. | Park Forest | 1.3% | 4.1%(-2.80)#16 | 3.9%(-2.60)#360 |
| 17. | Frankfort | 1.3% | 4.1%(-2.80)#17 | 3.9%(-2.60)#362 |
| 18. | Matteson | 1.3% | 4.1%(-2.80)#18 | 3.9%(-2.60)#364 |
| 19. | Wood Dale | 1.3% | 4.1%(-2.80)#19 | 3.9%(-2.60)#375 |
| 20. | Long Grove | 1.3% | 4.1%(-2.80)#20 | 3.9%(-2.60)#381 |
| 21. | Oak Brook | 1.3% | 4.1%(-2.80)#21 | 3.9%(-2.60)#382 |
| 22. | Plainfield | 1.4% | 4.1%(-2.70)#22 | 3.9%(-2.50)#393 |
| 23. | Deerfield | 1.4% | 4.1%(-2.70)#23 | 3.9%(-2.50)#404 |
| 24. | La Grange | 1.4% | 4.1%(-2.70)#24 | 3.9%(-2.50)#410 |
| 25. | Warrenville | 1.5% | 4.1%(-2.60)#25 | 3.9%(-2.40)#469 |
| 26. | Lake Bluff | 1.5% | 4.1%(-2.60)#26 | 3.9%(-2.40)#479 |
| 27. | Crest Hill | 1.6% | 4.1%(-2.50)#27 | 3.9%(-2.30)#513 |
| 28. | Morton | 1.6% | 4.1%(-2.50)#28 | 3.9%(-2.30)#520 |
| 29. | Bloomington | 1.7% | 4.1%(-2.40)#29 | 3.9%(-2.20)#552 |
| 30. | Hickory Hills | 1.7% | 4.1%(-2.40)#30 | 3.9%(-2.20)#578 |
| 31. | Savoy | 1.7% | 4.1%(-2.40)#31 | 3.9%(-2.20)#589 |
| 32. | Inverness | 1.7% | 4.1%(-2.40)#32 | 3.9%(-2.20)#593 |
| 33. | Lombard | 1.8% | 4.1%(-2.30)#33 | 3.9%(-2.10)#621 |
| 34. | O Fallon | 1.8% | 4.1%(-2.30)#34 | 3.9%(-2.10)#629 |
| 35. | Cahokia Heights | 1.8% | 4.1%(-2.30)#35 | 3.9%(-2.10)#639 |
| 36. | Mount Vernon | 1.8% | 4.1%(-2.30)#36 | 3.9%(-2.10)#645 |
| 37. | Lincolnshire | 1.8% | 4.1%(-2.30)#37 | 3.9%(-2.10)#658 |
| 38. | Oak Park | 1.9% | 4.1%(-2.20)#38 | 3.9%(-2.00)#676 |
| 39. | Woodridge | 1.9% | 4.1%(-2.20)#39 | 3.9%(-2.00)#687 |
| 40. | Elmwood Park | 1.9% | 4.1%(-2.20)#40 | 3.9%(-2.00)#692 |
| 41. | Alsip | 1.9% | 4.1%(-2.20)#41 | 3.9%(-2.00)#695 |
| 42. | Berkeley | 1.9% | 4.1%(-2.20)#42 | 3.9%(-2.00)#720 |
| 43. | Glenview | 2.0% | 4.1%(-2.10)#43 | 3.9%(-1.90)#740 |
| 44. | Sleepy Hollow | 2.0% | 4.1%(-2.10)#44 | 3.9%(-1.90)#789 |
| 45. | Burbank | 2.1% | 4.1%(-2.00)#45 | 3.9%(-1.80)#814 |
| 46. | Kankakee | 2.1% | 4.1%(-2.00)#46 | 3.9%(-1.80)#818 |
| 47. | Godfrey | 2.1% | 4.1%(-2.00)#47 | 3.9%(-1.80)#827 |
| 48. | Lincoln | 2.1% | 4.1%(-2.00)#48 | 3.9%(-1.80)#831 |
| 49. | Springfield | 2.2% | 4.1%(-1.90)#49 | 3.9%(-1.70)#866 |
| 50. | Geneva | 2.2% | 4.1%(-1.90)#50 | 3.9%(-1.70)#892 |
| 51. | Brookfield | 2.2% | 4.1%(-1.90)#51 | 3.9%(-1.70)#895 |
| 52. | Dixon | 2.2% | 4.1%(-1.90)#52 | 3.9%(-1.70)#898 |
| 53. | Maywood | 2.3% | 4.1%(-1.80)#53 | 3.9%(-1.60)#956 |
| 54. | Western Springs | 2.3% | 4.1%(-1.80)#54 | 3.9%(-1.60)#969 |
| 55. | Olympia Fields | 2.3% | 4.1%(-1.80)#55 | 3.9%(-1.60)#986 |
| 56. | Orangeville | 2.3% | 4.1%(-1.80)#56 | 3.9%(-1.60)#994 |
| 57. | Elmhurst | 2.4% | 4.1%(-1.70)#57 | 3.9%(-1.50)#1,020 |
| 58. | Crystal Lake | 2.4% | 4.1%(-1.70)#58 | 3.9%(-1.50)#1,022 |
| 59. | Galesburg | 2.4% | 4.1%(-1.70)#59 | 3.9%(-1.50)#1,026 |
| 60. | Franklin Park | 2.4% | 4.1%(-1.70)#60 | 3.9%(-1.50)#1,041 |
| 61. | La Grange Park | 2.4% | 4.1%(-1.70)#61 | 3.9%(-1.50)#1,051 |
| 62. | Normal | 2.5% | 4.1%(-1.60)#62 | 3.9%(-1.40)#1,092 |
| 63. | Quincy | 2.5% | 4.1%(-1.60)#63 | 3.9%(-1.40)#1,101 |
| 64. | Edwardsville | 2.5% | 4.1%(-1.60)#64 | 3.9%(-1.40)#1,109 |
| 65. | Belvidere | 2.5% | 4.1%(-1.60)#65 | 3.9%(-1.40)#1,110 |
| 66. | Barrington | 2.5% | 4.1%(-1.60)#66 | 3.9%(-1.40)#1,125 |
| 67. | Sandwich | 2.5% | 4.1%(-1.60)#67 | 3.9%(-1.40)#1,135 |
| 68. | Wilmette | 2.6% | 4.1%(-1.50)#68 | 3.9%(-1.30)#1,177 |
| 69. | Lasalle | 2.7% | 4.1%(-1.40)#69 | 3.9%(-1.20)#1,271 |
| 70. | Robinson | 2.7% | 4.1%(-1.40)#70 | 3.9%(-1.20)#1,277 |
| 71. | Rockford | 2.8% | 4.1%(-1.30)#71 | 3.9%(-1.10)#1,297 |
| 72. | Lockport | 2.8% | 4.1%(-1.30)#72 | 3.9%(-1.10)#1,320 |
| 73. | East Peoria | 2.8% | 4.1%(-1.30)#73 | 3.9%(-1.10)#1,328 |
| 74. | Lindenhurst | 2.8% | 4.1%(-1.30)#74 | 3.9%(-1.10)#1,333 |
| 75. | Winnetka | 2.8% | 4.1%(-1.30)#75 | 3.9%(-1.10)#1,338 |
| 76. | Geneseo | 2.8% | 4.1%(-1.30)#76 | 3.9%(-1.10)#1,350 |
| 77. | Mount Carroll | 2.8% | 4.1%(-1.30)#77 | 3.9%(-1.10)#1,363 |
| 78. | Pekin | 2.9% | 4.1%(-1.20)#78 | 3.9%(-1.00)#1,395 |
| 79. | Danville | 2.9% | 4.1%(-1.20)#79 | 3.9%(-1.00)#1,399 |
| 80. | Effingham | 2.9% | 4.1%(-1.20)#80 | 3.9%(-1.00)#1,417 |
| 81. | Walnut | 2.9% | 4.1%(-1.20)#81 | 3.9%(-1.00)#1,444 |
| 82. | Villa Park | 3.0% | 4.1%(-1.10)#82 | 3.9%(-0.900)#1,482 |
| 83. | Lake Forest | 3.0% | 4.1%(-1.10)#83 | 3.9%(-0.900)#1,486 |
| 84. | Country Club Hills | 3.0% | 4.1%(-1.10)#84 | 3.9%(-0.900)#1,491 |
| 85. | St Charles | 3.1% | 4.1%(-1.000)#85 | 3.9%(-0.800)#1,550 |
| 86. | Glen Ellyn | 3.1% | 4.1%(-1.000)#86 | 3.9%(-0.800)#1,553 |
| 87. | Blue Island | 3.1% | 4.1%(-1.000)#87 | 3.9%(-0.800)#1,557 |
| 88. | Jacksonville | 3.1% | 4.1%(-1.000)#88 | 3.9%(-0.800)#1,566 |
| 89. | Bradley | 3.1% | 4.1%(-1.000)#89 | 3.9%(-0.800)#1,569 |
| 90. | Highwood | 3.1% | 4.1%(-1.000)#90 | 3.9%(-0.800)#1,595 |
| 91. | Mount Prospect | 3.2% | 4.1%(-0.900)#91 | 3.9%(-0.700)#1,640 |
| 92. | Highland | 3.2% | 4.1%(-0.900)#92 | 3.9%(-0.700)#1,671 |
| 93. | Shelbyville | 3.2% | 4.1%(-0.900)#93 | 3.9%(-0.700)#1,682 |
| 94. | Buffalo Grove | 3.3% | 4.1%(-0.800)#94 | 3.9%(-0.600)#1,720 |
| 95. | Phoenix | 3.3% | 4.1%(-0.800)#95 | 3.9%(-0.600)#1,777 |
| 96. | Joliet | 3.4% | 4.1%(-0.700)#96 | 3.9%(-0.500)#1,787 |
| 97. | West Chicago | 3.4% | 4.1%(-0.700)#97 | 3.9%(-0.500)#1,806 |
| 98. | Libertyville | 3.4% | 4.1%(-0.700)#98 | 3.9%(-0.500)#1,811 |
| 99. | Round Lake | 3.4% | 4.1%(-0.700)#99 | 3.9%(-0.500)#1,813 |
| 100. | Lynwood | 3.4% | 4.1%(-0.700)#100 | 3.9%(-0.500)#1,827 |
Common Questions
What are the Top 10 Cities with the Lowest Unemployment Rate Amomg Seniors Over the Age of 65 in Illinois?
Top 10 Cities with the Lowest Unemployment Rate Amomg Seniors Over the Age of 65 in Illinois are:
#1
0.40%
#2
0.40%
#3
0.60%
#4
0.60%
#5
0.70%
#6
0.70%
#7
0.80%
#8
0.90%
#9
0.90%
#10
0.90%
What city has the Lowest Unemployment Rate Amomg Seniors Over the Age of 65 in Illinois?
Wheaton has the Lowest Unemployment Rate Amomg Seniors Over the Age of 65 in Illinois with 0.40%.
What is the Unemployment Rate Amomg Seniors Over the Age of 65 in the State of Illinois?
Unemployment Rate Amomg Seniors Over the Age of 65 in Illinois is 4.1%.
What is the Unemployment Rate Amomg Seniors Over the Age of 65 in the United States?
Unemployment Rate Amomg Seniors Over the Age of 65 in the United States is 3.9%.