Longview, WA Map & Demographics
Longview Map
Longview Overview
$34,737
PER CAPITA INCOME
$76,160
AVG FAMILY INCOME
$57,920
AVG HOUSEHOLD INCOME
22.1%
WAGE / INCOME GAP [ % ]
77.9¢/ $1
WAGE / INCOME GAP [ $ ]
$11,178
FAMILY INCOME DEFICIT
0.46
INEQUALITY / GINI INDEX
37,722
TOTAL POPULATION
18,042
MALE POPULATION
19,680
FEMALE POPULATION
91.68
MALES / 100 FEMALES
109.08
FEMALES / 100 MALES
39.9
MEDIAN AGE
3.0
AVG FAMILY SIZE
2.3
AVG HOUSEHOLD SIZE
17,327
LABOR FORCE [ PEOPLE ]
56.2%
PERCENT IN LABOR FORCE
4.5%
UNEMPLOYMENT RATE
Longview Zip Codes
Longview Area Codes
Income in Longview
Income Overview in Longview
Per Capita Income in Longview is $34,737, while median incomes of families and households are $76,160 and $57,920 respectively.
| Characteristic | Number | Measure |
| Per Capita Income | 37,722 | $34,737 |
| Median Family Income | 8,907 | $76,160 |
| Mean Family Income | 8,907 | $96,962 |
| Median Household Income | 16,030 | $57,920 |
| Mean Household Income | 16,030 | $78,786 |
| Income Deficit | 8,907 | $11,178 |
| Wage / Income Gap (%) | 37,722 | 22.14% |
| Wage / Income Gap ($) | 37,722 | 77.86¢ per $1 |
| Gini / Inequality Index | 37,722 | 0.46 |
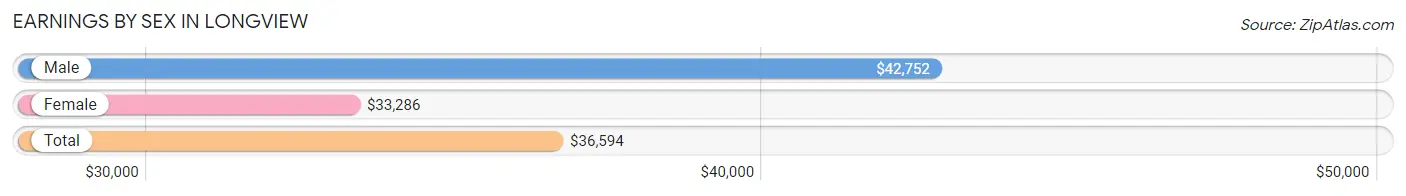
Earnings by Sex in Longview
Average Earnings in Longview are $36,594, $42,752 for men and $33,286 for women, a difference of 22.1%.
| Sex | Number | Average Earnings |
| Male | 9,278 (50.8%) | $42,752 |
| Female | 8,982 (49.2%) | $33,286 |
| Total | 18,260 (100.0%) | $36,594 |
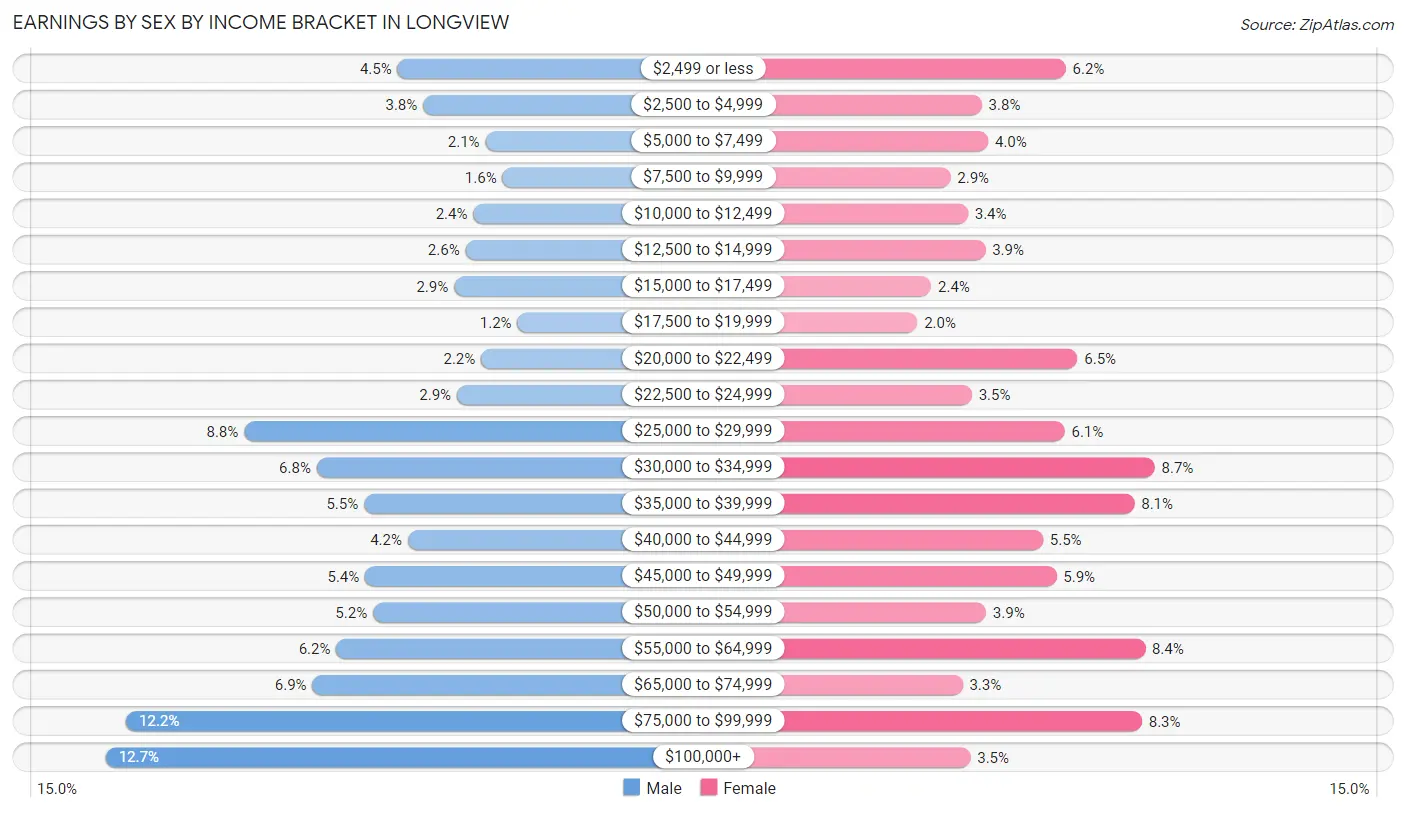
Earnings by Sex by Income Bracket in Longview
The most common earnings brackets in Longview are $100,000+ for men (1,180 | 12.7%) and $30,000 to $34,999 for women (777 | 8.6%).
| Income | Male | Female |
| $2,499 or less | 419 (4.5%) | 552 (6.1%) |
| $2,500 to $4,999 | 353 (3.8%) | 340 (3.8%) |
| $5,000 to $7,499 | 190 (2.1%) | 357 (4.0%) |
| $7,500 to $9,999 | 146 (1.6%) | 261 (2.9%) |
| $10,000 to $12,499 | 222 (2.4%) | 305 (3.4%) |
| $12,500 to $14,999 | 242 (2.6%) | 349 (3.9%) |
| $15,000 to $17,499 | 272 (2.9%) | 213 (2.4%) |
| $17,500 to $19,999 | 107 (1.1%) | 178 (2.0%) |
| $20,000 to $22,499 | 201 (2.2%) | 582 (6.5%) |
| $22,500 to $24,999 | 264 (2.9%) | 315 (3.5%) |
| $25,000 to $29,999 | 819 (8.8%) | 550 (6.1%) |
| $30,000 to $34,999 | 630 (6.8%) | 777 (8.6%) |
| $35,000 to $39,999 | 507 (5.5%) | 726 (8.1%) |
| $40,000 to $44,999 | 392 (4.2%) | 495 (5.5%) |
| $45,000 to $49,999 | 504 (5.4%) | 529 (5.9%) |
| $50,000 to $54,999 | 483 (5.2%) | 351 (3.9%) |
| $55,000 to $64,999 | 579 (6.2%) | 753 (8.4%) |
| $65,000 to $74,999 | 641 (6.9%) | 292 (3.3%) |
| $75,000 to $99,999 | 1,127 (12.1%) | 745 (8.3%) |
| $100,000+ | 1,180 (12.7%) | 312 (3.5%) |
| Total | 9,278 (100.0%) | 8,982 (100.0%) |
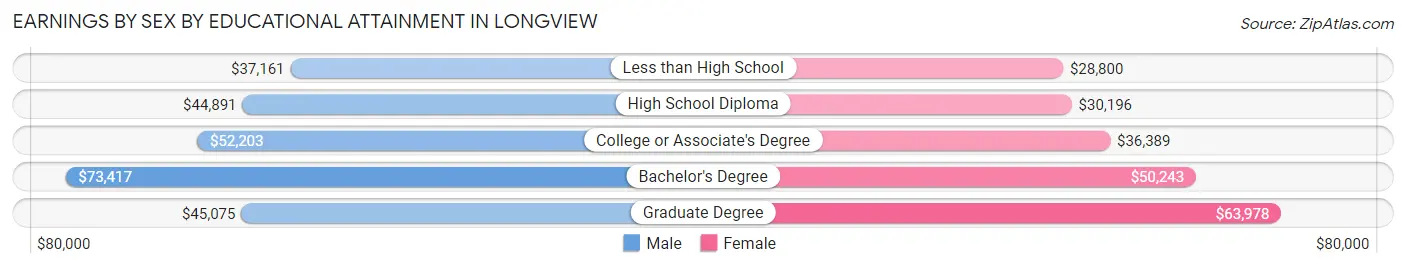
Earnings by Sex by Educational Attainment in Longview
Average earnings in Longview are $47,213 for men and $36,187 for women, a difference of 23.4%. Men with an educational attainment of bachelor's degree enjoy the highest average annual earnings of $73,417, while those with less than high school education earn the least with $37,161. Women with an educational attainment of graduate degree earn the most with the average annual earnings of $63,978, while those with less than high school education have the smallest earnings of $28,800.
| Educational Attainment | Male Income | Female Income |
| Less than High School | $37,161 | $28,800 |
| High School Diploma | $44,891 | $30,196 |
| College or Associate's Degree | $52,203 | $36,389 |
| Bachelor's Degree | $73,417 | $50,243 |
| Graduate Degree | $45,075 | $63,978 |
| Total | $47,213 | $36,187 |
Family Income in Longview
Family Income Brackets in Longview
According to the Longview family income data, there are 1,701 families falling into the $75,000 to $99,999 income range, which is the most common income bracket and makes up 19.1% of all families. Conversely, the $10,000 to $14,999 income bracket is the least frequent group with only 223 families (2.5%) belonging to this category.
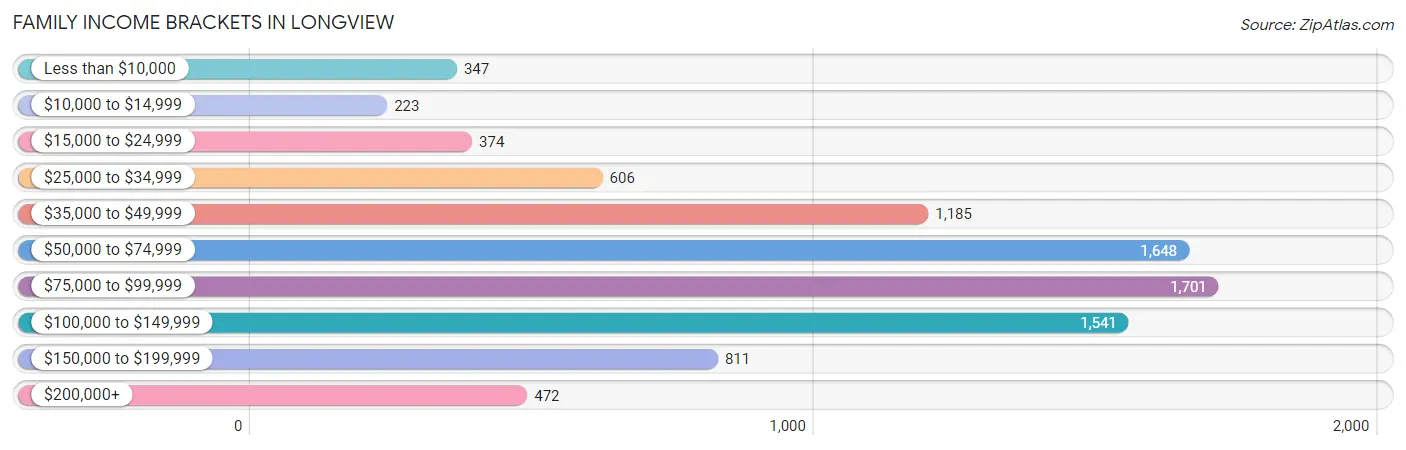
| Income Bracket | # Families | % Families |
| Less than $10,000 | 347 | 3.9% |
| $10,000 to $14,999 | 223 | 2.5% |
| $15,000 to $24,999 | 374 | 4.2% |
| $25,000 to $34,999 | 606 | 6.8% |
| $35,000 to $49,999 | 1,185 | 13.3% |
| $50,000 to $74,999 | 1,648 | 18.5% |
| $75,000 to $99,999 | 1,701 | 19.1% |
| $100,000 to $149,999 | 1,541 | 17.3% |
| $150,000 to $199,999 | 811 | 9.1% |
| $200,000+ | 472 | 5.3% |
Family Income by Famaliy Size in Longview
6-person families (264 | 3.0%) account for the highest median family income in Longview with $98,750 per family, while 2-person families (4,681 | 52.5%) have the highest median income of $37,959 per family member.
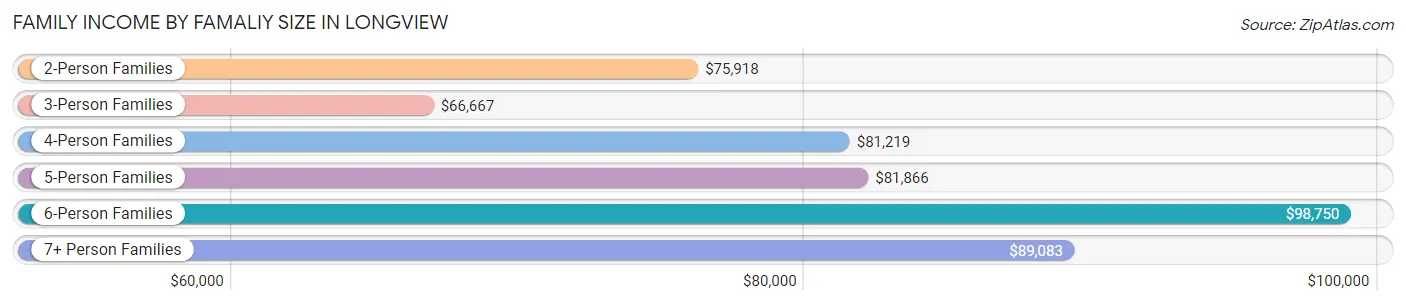
| Income Bracket | # Families | Median Income |
| 2-Person Families | 4,681 (52.5%) | $75,918 |
| 3-Person Families | 2,110 (23.7%) | $66,667 |
| 4-Person Families | 1,211 (13.6%) | $81,219 |
| 5-Person Families | 523 (5.9%) | $81,866 |
| 6-Person Families | 264 (3.0%) | $98,750 |
| 7+ Person Families | 118 (1.3%) | $89,083 |
| Total | 8,907 (100.0%) | $76,160 |
Family Income by Number of Earners in Longview
The median family income in Longview is $76,160, with families comprising 3+ earners (756) having the highest median family income of $129,467, while families with 1 earner (2,779) have the lowest median family income of $52,065, accounting for 8.5% and 31.2% of families, respectively.
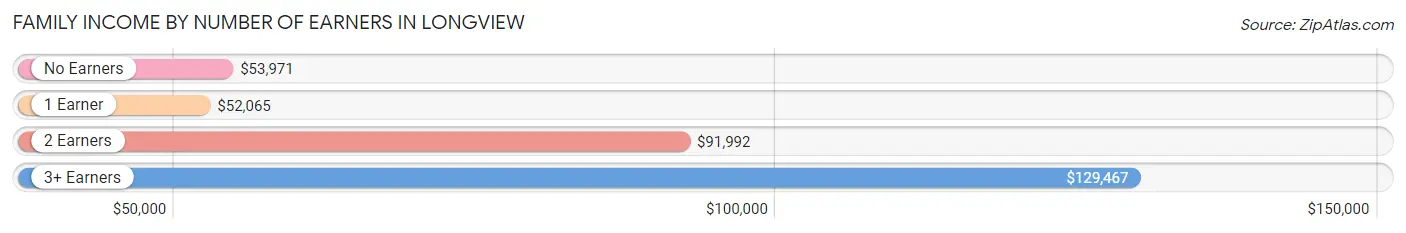
| Number of Earners | # Families | Median Income |
| No Earners | 1,860 (20.9%) | $53,971 |
| 1 Earner | 2,779 (31.2%) | $52,065 |
| 2 Earners | 3,512 (39.4%) | $91,992 |
| 3+ Earners | 756 (8.5%) | $129,467 |
| Total | 8,907 (100.0%) | $76,160 |
Household Income in Longview
Household Income Brackets in Longview
With 2,741 households falling in the category, the $75,000 to $99,999 income range is the most frequent in Longview, accounting for 17.1% of all households. In contrast, only 609 households (3.8%) fall into the $200,000+ income bracket, making it the least populous group.
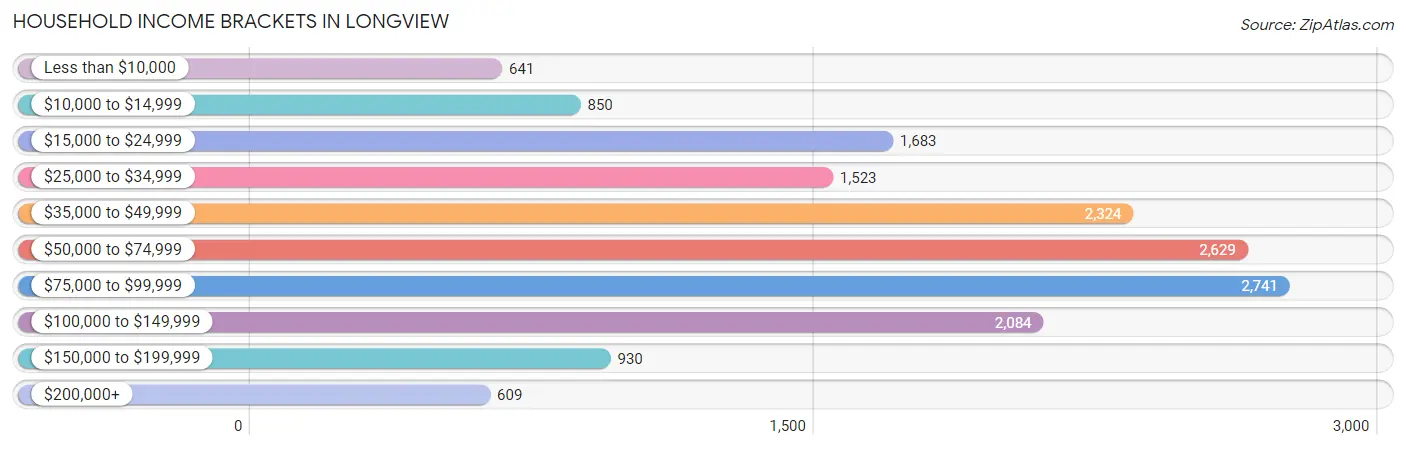
| Income Bracket | # Households | % Households |
| Less than $10,000 | 641 | 4.0% |
| $10,000 to $14,999 | 850 | 5.3% |
| $15,000 to $24,999 | 1,683 | 10.5% |
| $25,000 to $34,999 | 1,523 | 9.5% |
| $35,000 to $49,999 | 2,324 | 14.5% |
| $50,000 to $74,999 | 2,629 | 16.4% |
| $75,000 to $99,999 | 2,741 | 17.1% |
| $100,000 to $149,999 | 2,084 | 13.0% |
| $150,000 to $199,999 | 930 | 5.8% |
| $200,000+ | 609 | 3.8% |
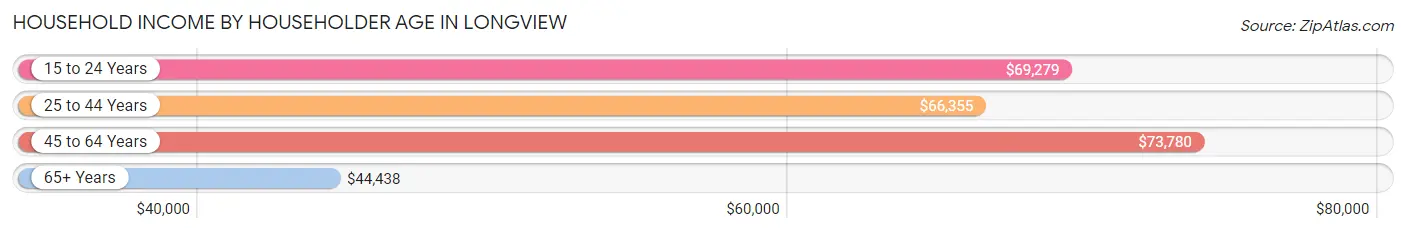
Household Income by Householder Age in Longview
The median household income in Longview is $57,920, with the highest median household income of $73,780 found in the 45 to 64 years age bracket for the primary householder. A total of 4,973 households (31.0%) fall into this category. Meanwhile, the 65+ years age bracket for the primary householder has the lowest median household income of $44,438, with 5,371 households (33.5%) in this group.
| Income Bracket | # Households | Median Income |
| 15 to 24 Years | 488 (3.0%) | $69,279 |
| 25 to 44 Years | 5,198 (32.4%) | $66,355 |
| 45 to 64 Years | 4,973 (31.0%) | $73,780 |
| 65+ Years | 5,371 (33.5%) | $44,438 |
| Total | 16,030 (100.0%) | $57,920 |
Poverty in Longview
Income Below Poverty by Sex and Age in Longview
With 12.1% poverty level for males and 14.9% for females among the residents of Longview, 15 year old males and 16 and 17 year old females are the most vulnerable to poverty, with 42 males (21.8%) and 207 females (32.2%) in their respective age groups living below the poverty level.
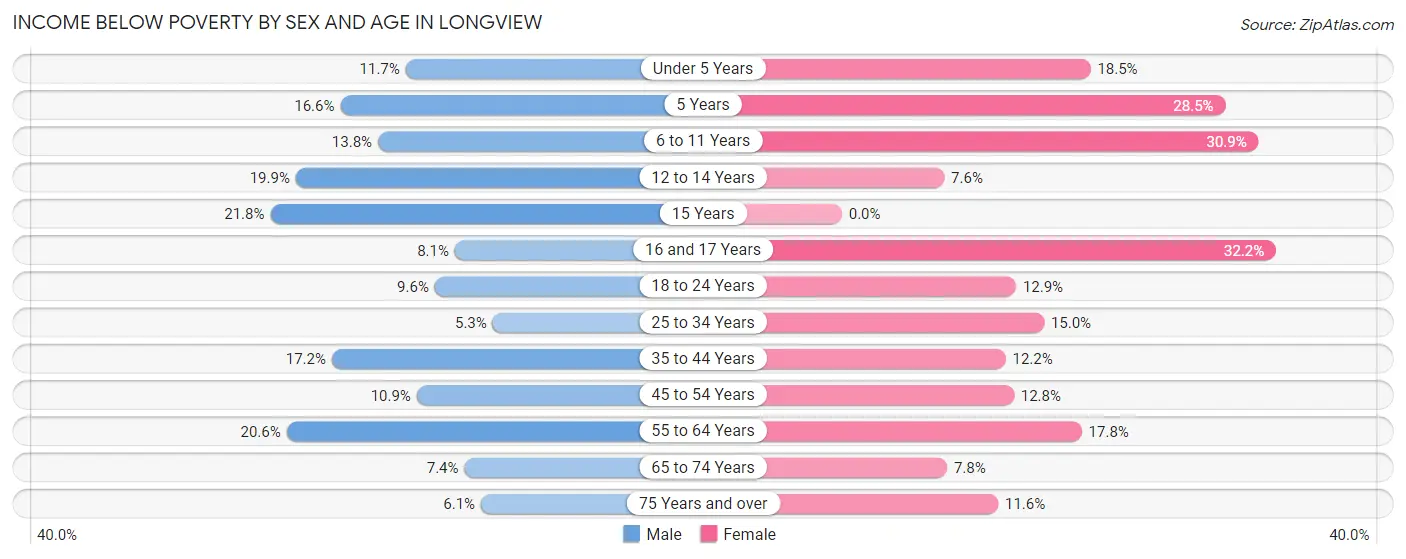
| Age Bracket | Male | Female |
| Under 5 Years | 128 (11.7%) | 211 (18.5%) |
| 5 Years | 25 (16.6%) | 45 (28.5%) |
| 6 to 11 Years | 171 (13.8%) | 371 (30.9%) |
| 12 to 14 Years | 123 (19.9%) | 46 (7.6%) |
| 15 Years | 42 (21.8%) | 0 (0.0%) |
| 16 and 17 Years | 25 (8.1%) | 207 (32.2%) |
| 18 to 24 Years | 164 (9.6%) | 210 (12.9%) |
| 25 to 34 Years | 122 (5.2%) | 409 (15.0%) |
| 35 to 44 Years | 457 (17.2%) | 245 (12.2%) |
| 45 to 54 Years | 201 (10.9%) | 270 (12.8%) |
| 55 to 64 Years | 447 (20.5%) | 437 (17.8%) |
| 65 to 74 Years | 147 (7.3%) | 191 (7.8%) |
| 75 Years and over | 74 (6.1%) | 222 (11.6%) |
| Total | 2,126 (12.1%) | 2,864 (14.9%) |
Income Above Poverty by Sex and Age in Longview
According to the poverty statistics in Longview, males aged 25 to 34 years and females aged 15 years are the age groups that are most secure financially, with 94.8% of males and 100.0% of females in these age groups living above the poverty line.
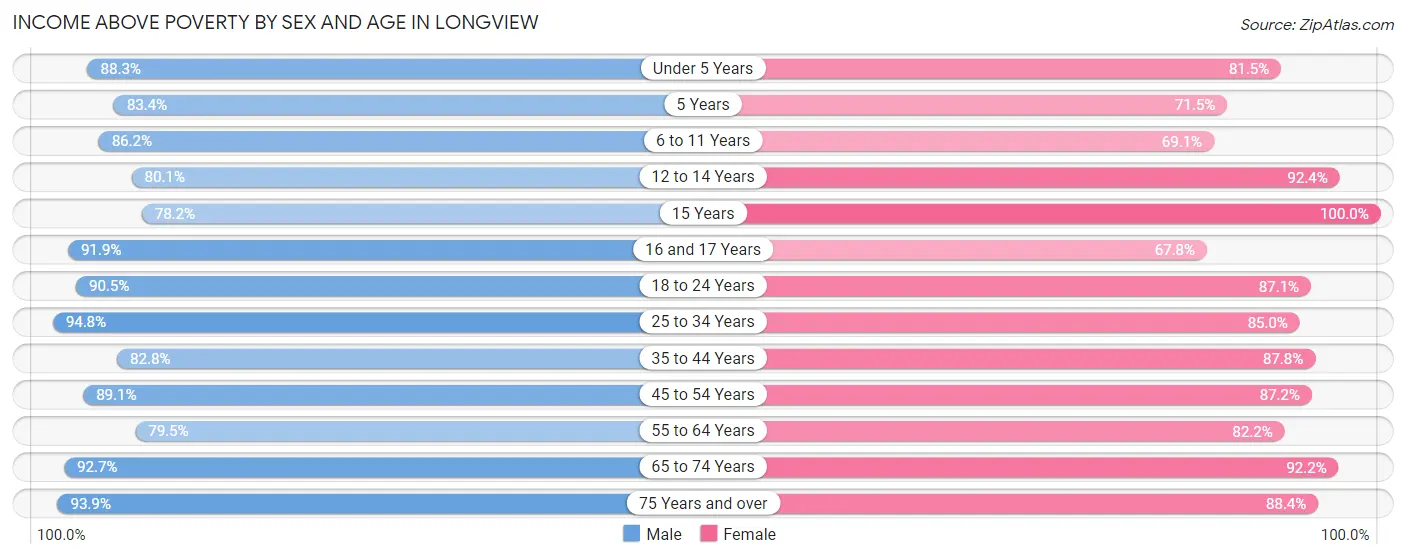
| Age Bracket | Male | Female |
| Under 5 Years | 965 (88.3%) | 932 (81.5%) |
| 5 Years | 126 (83.4%) | 113 (71.5%) |
| 6 to 11 Years | 1,071 (86.2%) | 828 (69.1%) |
| 12 to 14 Years | 496 (80.1%) | 559 (92.4%) |
| 15 Years | 151 (78.2%) | 219 (100.0%) |
| 16 and 17 Years | 285 (91.9%) | 435 (67.8%) |
| 18 to 24 Years | 1,553 (90.4%) | 1,414 (87.1%) |
| 25 to 34 Years | 2,204 (94.8%) | 2,315 (85.0%) |
| 35 to 44 Years | 2,201 (82.8%) | 1,769 (87.8%) |
| 45 to 54 Years | 1,645 (89.1%) | 1,845 (87.2%) |
| 55 to 64 Years | 1,728 (79.4%) | 2,017 (82.2%) |
| 65 to 74 Years | 1,852 (92.6%) | 2,255 (92.2%) |
| 75 Years and over | 1,136 (93.9%) | 1,692 (88.4%) |
| Total | 15,413 (87.9%) | 16,393 (85.1%) |
Income Below Poverty Among Married-Couple Families in Longview
The poverty statistics for married-couple families in Longview show that 4.1% or 239 of the total 5,808 families live below the poverty line. Families with no children have the highest poverty rate of 4.9%, comprising of 187 families. On the other hand, families with 5 or more children have the lowest poverty rate of 0.0%, which includes 0 families.
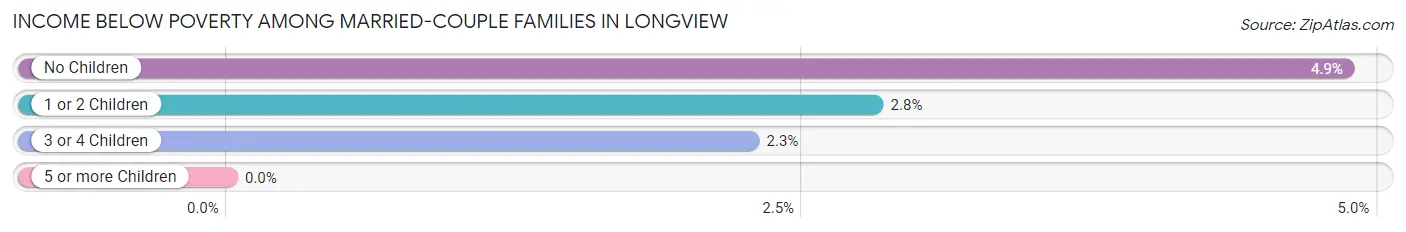
| Children | Above Poverty | Below Poverty |
| No Children | 3,661 (95.1%) | 187 (4.9%) |
| 1 or 2 Children | 1,455 (97.2%) | 42 (2.8%) |
| 3 or 4 Children | 430 (97.7%) | 10 (2.3%) |
| 5 or more Children | 23 (100.0%) | 0 (0.0%) |
| Total | 5,569 (95.9%) | 239 (4.1%) |
Income Below Poverty Among Single-Parent Households in Longview
According to the poverty data in Longview, 8.6% or 68 single-father households and 21.7% or 503 single-mother households are living below the poverty line. Among single-father households, those with 3 or 4 children have the highest poverty rate, with 16 households (34.0%) experiencing poverty. Likewise, among single-mother households, those with 3 or 4 children have the highest poverty rate, with 75 households (53.2%) falling below the poverty line.
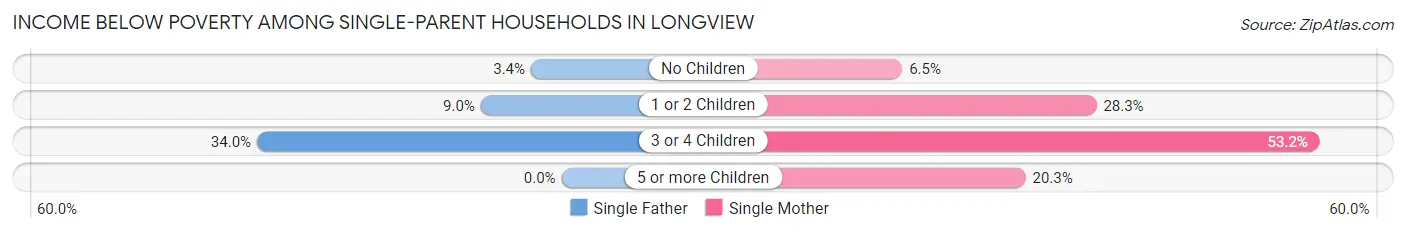
| Children | Single Father | Single Mother |
| No Children | 9 (3.4%) | 53 (6.5%) |
| 1 or 2 Children | 43 (9.0%) | 350 (28.2%) |
| 3 or 4 Children | 16 (34.0%) | 75 (53.2%) |
| 5 or more Children | 0 (0.0%) | 25 (20.3%) |
| Total | 68 (8.6%) | 503 (21.7%) |
Income Below Poverty Among Married-Couple vs Single-Parent Households in Longview
The poverty data for Longview shows that 239 of the married-couple family households (4.1%) and 571 of the single-parent households (18.4%) are living below the poverty level. Within the married-couple family households, those with no children have the highest poverty rate, with 187 households (4.9%) falling below the poverty line. Among the single-parent households, those with 3 or 4 children have the highest poverty rate, with 91 household (48.4%) living below poverty.
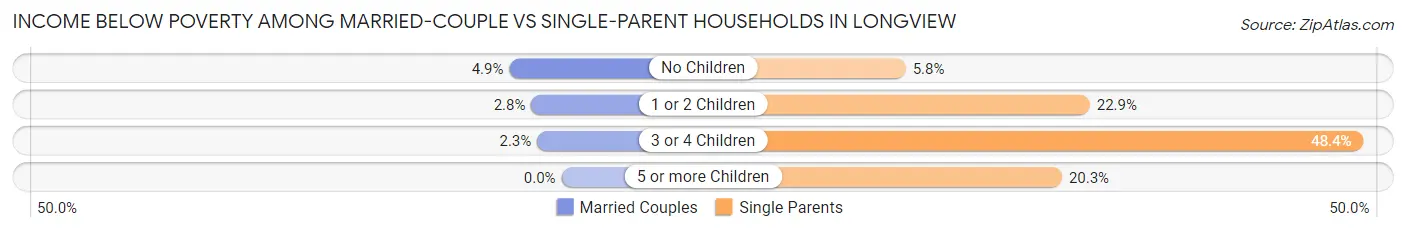
| Children | Married-Couple Families | Single-Parent Households |
| No Children | 187 (4.9%) | 62 (5.8%) |
| 1 or 2 Children | 42 (2.8%) | 393 (22.9%) |
| 3 or 4 Children | 10 (2.3%) | 91 (48.4%) |
| 5 or more Children | 0 (0.0%) | 25 (20.3%) |
| Total | 239 (4.1%) | 571 (18.4%) |
Race in Longview
The most populous races in Longview are White / Caucasian (31,507 | 83.5%), Hispanic or Latino (3,855 | 10.2%), and Two or more Races (3,650 | 9.7%).
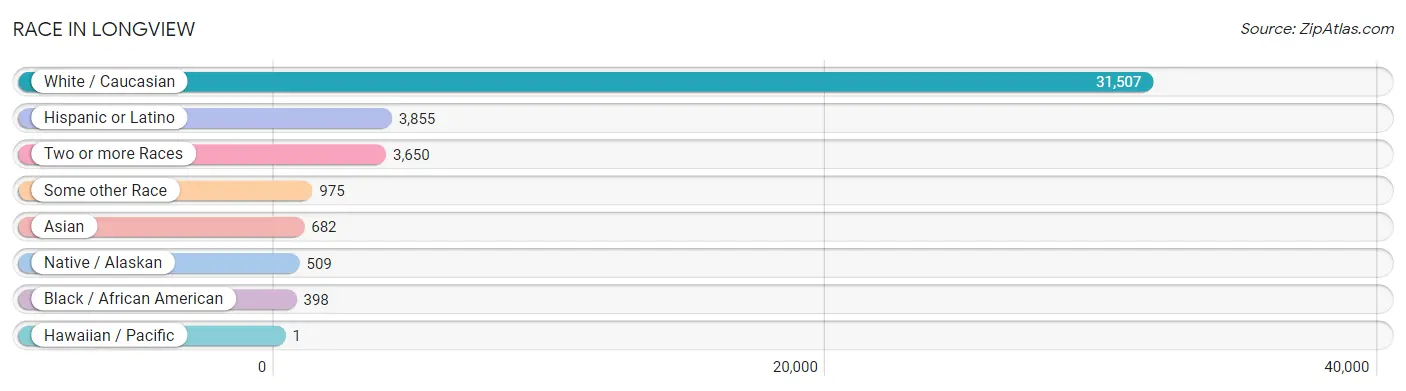
| Race | # Population | % Population |
| Asian | 682 | 1.8% |
| Black / African American | 398 | 1.1% |
| Hawaiian / Pacific | 1 | 0.0% |
| Hispanic or Latino | 3,855 | 10.2% |
| Native / Alaskan | 509 | 1.3% |
| White / Caucasian | 31,507 | 83.5% |
| Two or more Races | 3,650 | 9.7% |
| Some other Race | 975 | 2.6% |
| Total | 37,722 | 100.0% |
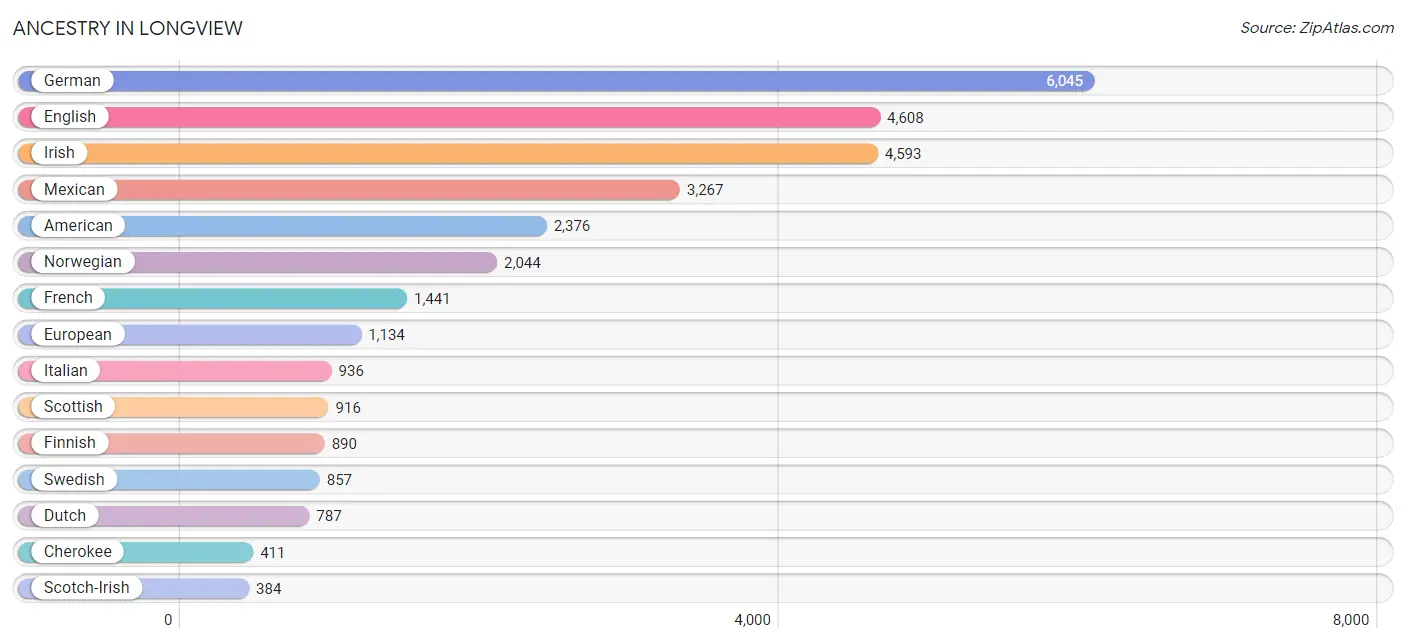
Ancestry in Longview
The most populous ancestries reported in Longview are German (6,045 | 16.0%), English (4,608 | 12.2%), Irish (4,593 | 12.2%), Mexican (3,267 | 8.7%), and American (2,376 | 6.3%), together accounting for 55.4% of all Longview residents.
| Ancestry | # Population | % Population |
| African | 44 | 0.1% |
| Alaskan Athabascan | 7 | 0.0% |
| Albanian | 5 | 0.0% |
| Aleut | 1 | 0.0% |
| American | 2,376 | 6.3% |
| Apache | 19 | 0.1% |
| Armenian | 8 | 0.0% |
| Australian | 10 | 0.0% |
| Austrian | 85 | 0.2% |
| Belgian | 46 | 0.1% |
| Bhutanese | 83 | 0.2% |
| Blackfeet | 163 | 0.4% |
| British | 196 | 0.5% |
| British West Indian | 9 | 0.0% |
| Burmese | 142 | 0.4% |
| Cajun | 13 | 0.0% |
| Cambodian | 19 | 0.1% |
| Canadian | 25 | 0.1% |
| Central American | 172 | 0.5% |
| Central American Indian | 24 | 0.1% |
| Cherokee | 411 | 1.1% |
| Chickasaw | 16 | 0.0% |
| Chippewa | 48 | 0.1% |
| Choctaw | 82 | 0.2% |
| Colombian | 9 | 0.0% |
| Creek | 11 | 0.0% |
| Croatian | 33 | 0.1% |
| Crow | 76 | 0.2% |
| Cuban | 58 | 0.2% |
| Czech | 22 | 0.1% |
| Czechoslovakian | 9 | 0.0% |
| Danish | 272 | 0.7% |
| Delaware | 9 | 0.0% |
| Dutch | 787 | 2.1% |
| Eastern European | 253 | 0.7% |
| English | 4,608 | 12.2% |
| Ethiopian | 109 | 0.3% |
| European | 1,134 | 3.0% |
| Finnish | 890 | 2.4% |
| French | 1,441 | 3.8% |
| French American Indian | 106 | 0.3% |
| French Canadian | 280 | 0.7% |
| German | 6,045 | 16.0% |
| German Russian | 4 | 0.0% |
| Greek | 51 | 0.1% |
| Guatemalan | 77 | 0.2% |
| Honduran | 12 | 0.0% |
| Hopi | 85 | 0.2% |
| Hungarian | 81 | 0.2% |
| Icelander | 12 | 0.0% |
| Indian (Asian) | 166 | 0.4% |
| Inupiat | 8 | 0.0% |
| Iranian | 25 | 0.1% |
| Irish | 4,593 | 12.2% |
| Italian | 936 | 2.5% |
| Jamaican | 8 | 0.0% |
| Japanese | 172 | 0.5% |
| Korean | 366 | 1.0% |
| Laotian | 11 | 0.0% |
| Latvian | 14 | 0.0% |
| Lithuanian | 21 | 0.1% |
| Luxembourger | 3 | 0.0% |
| Malaysian | 25 | 0.1% |
| Maltese | 7 | 0.0% |
| Mexican | 3,267 | 8.7% |
| Mexican American Indian | 43 | 0.1% |
| Native Hawaiian | 110 | 0.3% |
| Nigerian | 24 | 0.1% |
| Northern European | 104 | 0.3% |
| Norwegian | 2,044 | 5.4% |
| Paiute | 20 | 0.1% |
| Panamanian | 6 | 0.0% |
| Polish | 320 | 0.9% |
| Portuguese | 96 | 0.3% |
| Puerto Rican | 38 | 0.1% |
| Puget Sound Salish | 8 | 0.0% |
| Romanian | 59 | 0.2% |
| Russian | 198 | 0.5% |
| Salvadoran | 77 | 0.2% |
| Scandinavian | 168 | 0.4% |
| Scotch-Irish | 384 | 1.0% |
| Scottish | 916 | 2.4% |
| Serbian | 15 | 0.0% |
| Sioux | 85 | 0.2% |
| Slavic | 46 | 0.1% |
| Slovak | 12 | 0.0% |
| Slovene | 41 | 0.1% |
| South American | 9 | 0.0% |
| Spaniard | 149 | 0.4% |
| Spanish | 125 | 0.3% |
| Spanish American Indian | 4 | 0.0% |
| Sri Lankan | 310 | 0.8% |
| Subsaharan African | 211 | 0.6% |
| Swedish | 857 | 2.3% |
| Swiss | 177 | 0.5% |
| Thai | 23 | 0.1% |
| Tlingit-Haida | 87 | 0.2% |
| Tongan | 48 | 0.1% |
| Ukrainian | 83 | 0.2% |
| Ute | 16 | 0.0% |
| Welsh | 224 | 0.6% |
| Yakama | 25 | 0.1% |
| Yuman | 8 | 0.0% |
| Yup'ik | 6 | 0.0% | View All 104 Rows |
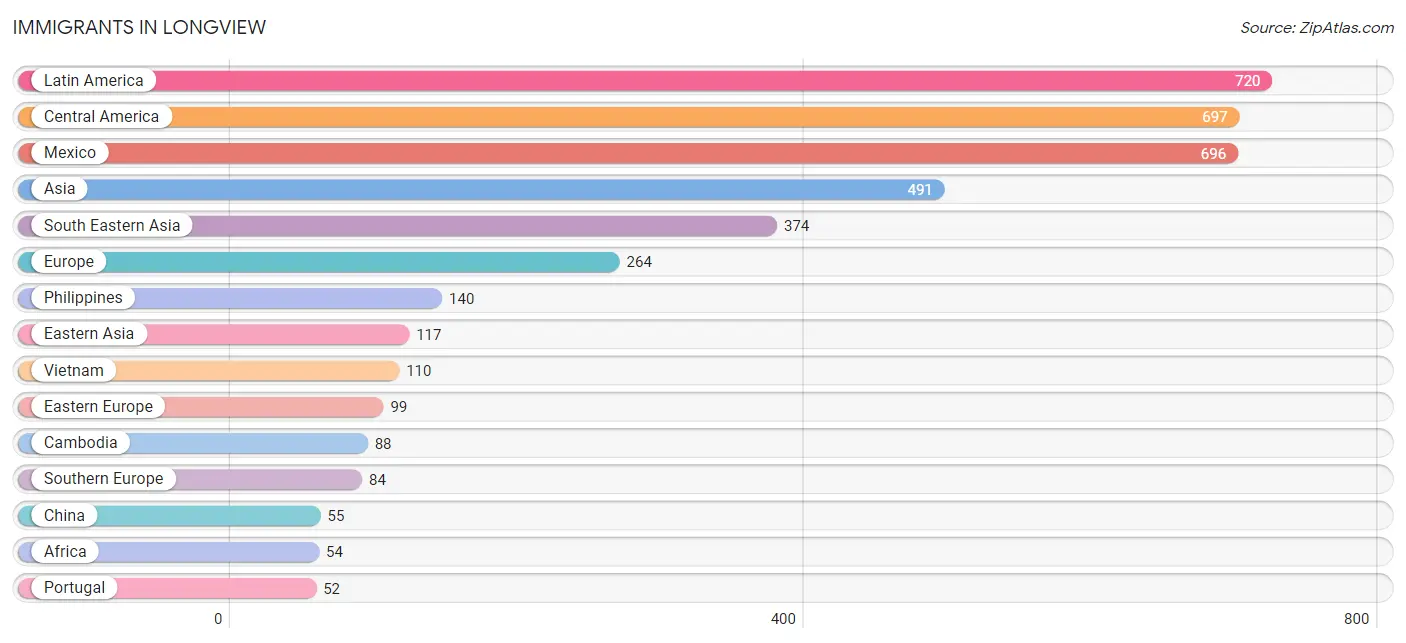
Immigrants in Longview
The most numerous immigrant groups reported in Longview came from Latin America (720 | 1.9%), Central America (697 | 1.8%), Mexico (696 | 1.8%), Asia (491 | 1.3%), and South Eastern Asia (374 | 1.0%), together accounting for 7.9% of all Longview residents.
| Immigration Origin | # Population | % Population |
| Africa | 54 | 0.1% |
| Asia | 491 | 1.3% |
| Azores | 30 | 0.1% |
| Cambodia | 88 | 0.2% |
| Canada | 46 | 0.1% |
| Caribbean | 14 | 0.0% |
| Central America | 697 | 1.8% |
| China | 55 | 0.2% |
| Colombia | 9 | 0.0% |
| Cuba | 14 | 0.0% |
| Eastern Africa | 37 | 0.1% |
| Eastern Asia | 117 | 0.3% |
| Eastern Europe | 99 | 0.3% |
| El Salvador | 1 | 0.0% |
| Ethiopia | 37 | 0.1% |
| Europe | 264 | 0.7% |
| Germany | 17 | 0.1% |
| Hong Kong | 6 | 0.0% |
| Indonesia | 11 | 0.0% |
| Ireland | 17 | 0.1% |
| Japan | 32 | 0.1% |
| Korea | 11 | 0.0% |
| Laos | 25 | 0.1% |
| Latin America | 720 | 1.9% |
| Latvia | 25 | 0.1% |
| Mexico | 696 | 1.8% |
| Netherlands | 17 | 0.1% |
| Northern Europe | 47 | 0.1% |
| Norway | 10 | 0.0% |
| Oceania | 14 | 0.0% |
| Philippines | 140 | 0.4% |
| Portugal | 52 | 0.1% |
| Russia | 52 | 0.1% |
| South Africa | 17 | 0.1% |
| South America | 9 | 0.0% |
| South Eastern Asia | 374 | 1.0% |
| Southern Europe | 84 | 0.2% |
| Spain | 32 | 0.1% |
| Sweden | 11 | 0.0% |
| Ukraine | 6 | 0.0% |
| Vietnam | 110 | 0.3% |
| Western Europe | 34 | 0.1% | View All 42 Rows |
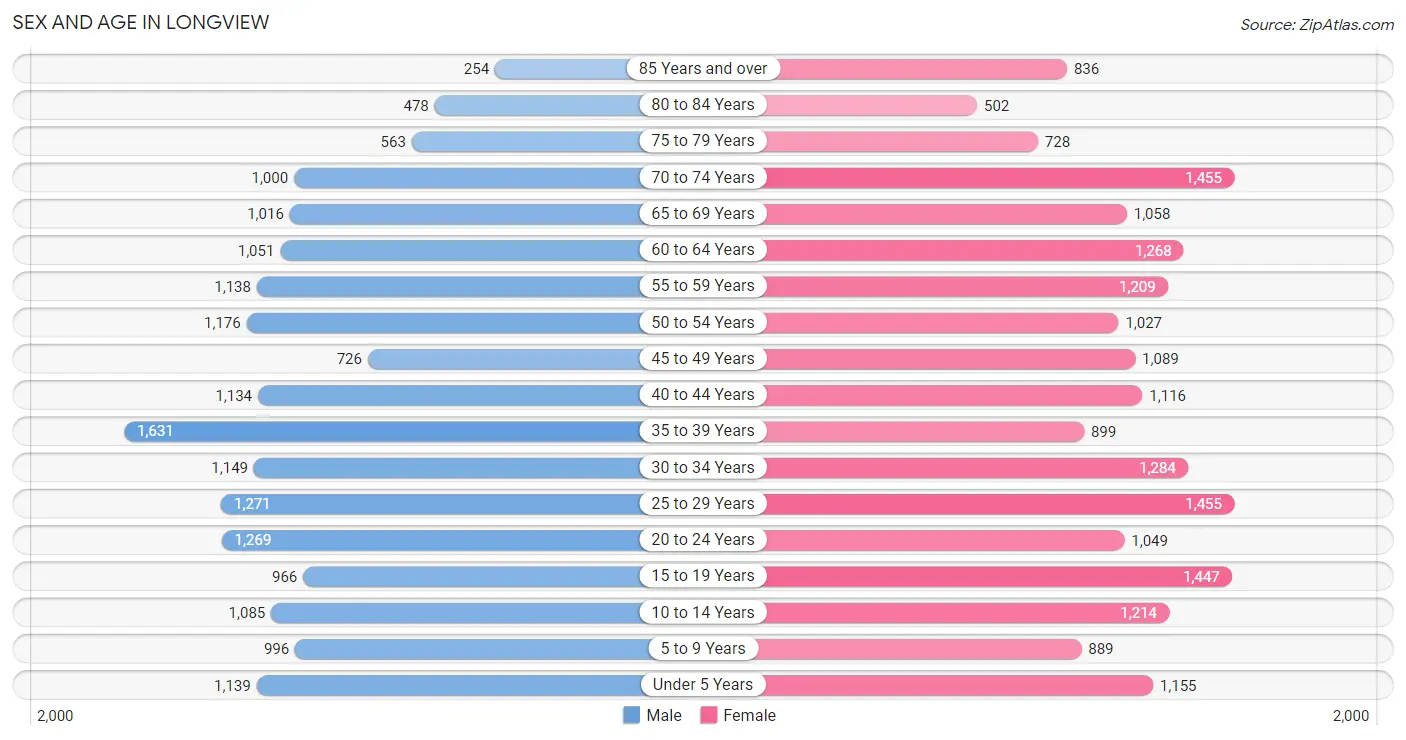
Sex and Age in Longview
Sex and Age in Longview
The most populous age groups in Longview are 35 to 39 Years (1,631 | 9.0%) for men and 25 to 29 Years (1,455 | 7.4%) for women.
| Age Bracket | Male | Female |
| Under 5 Years | 1,139 (6.3%) | 1,155 (5.9%) |
| 5 to 9 Years | 996 (5.5%) | 889 (4.5%) |
| 10 to 14 Years | 1,085 (6.0%) | 1,214 (6.2%) |
| 15 to 19 Years | 966 (5.3%) | 1,447 (7.3%) |
| 20 to 24 Years | 1,269 (7.0%) | 1,049 (5.3%) |
| 25 to 29 Years | 1,271 (7.0%) | 1,455 (7.4%) |
| 30 to 34 Years | 1,149 (6.4%) | 1,284 (6.5%) |
| 35 to 39 Years | 1,631 (9.0%) | 899 (4.6%) |
| 40 to 44 Years | 1,134 (6.3%) | 1,116 (5.7%) |
| 45 to 49 Years | 726 (4.0%) | 1,089 (5.5%) |
| 50 to 54 Years | 1,176 (6.5%) | 1,027 (5.2%) |
| 55 to 59 Years | 1,138 (6.3%) | 1,209 (6.1%) |
| 60 to 64 Years | 1,051 (5.8%) | 1,268 (6.4%) |
| 65 to 69 Years | 1,016 (5.6%) | 1,058 (5.4%) |
| 70 to 74 Years | 1,000 (5.5%) | 1,455 (7.4%) |
| 75 to 79 Years | 563 (3.1%) | 728 (3.7%) |
| 80 to 84 Years | 478 (2.6%) | 502 (2.5%) |
| 85 Years and over | 254 (1.4%) | 836 (4.3%) |
| Total | 18,042 (100.0%) | 19,680 (100.0%) |
Families and Households in Longview
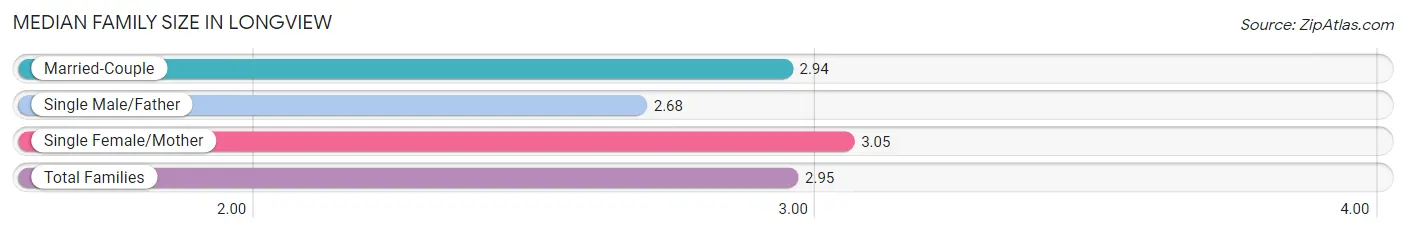
Median Family Size in Longview
The median family size in Longview is 2.95 persons per family, with single female/mother families (2,313 | 26.0%) accounting for the largest median family size of 3.05 persons per family. On the other hand, single male/father families (786 | 8.8%) represent the smallest median family size with 2.68 persons per family.
| Family Type | # Families | Family Size |
| Married-Couple | 5,808 (65.2%) | 2.94 |
| Single Male/Father | 786 (8.8%) | 2.68 |
| Single Female/Mother | 2,313 (26.0%) | 3.05 |
| Total Families | 8,907 (100.0%) | 2.95 |
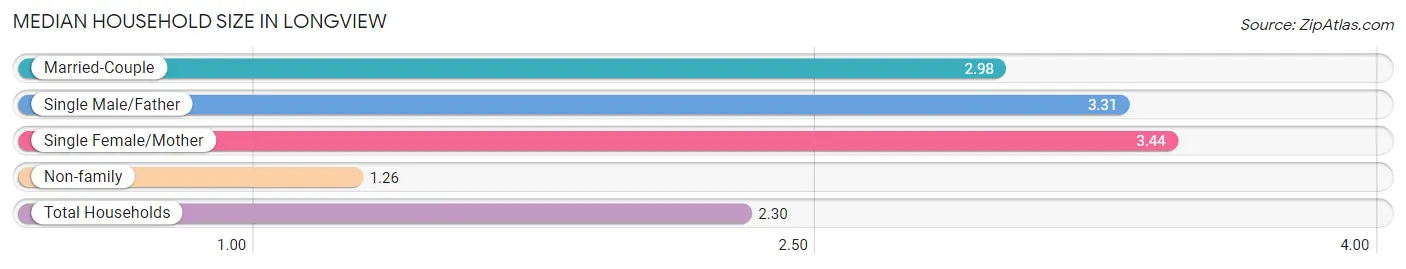
Median Household Size in Longview
The median household size in Longview is 2.30 persons per household, with single female/mother households (2,313 | 14.4%) accounting for the largest median household size of 3.44 persons per household. non-family households (7,123 | 44.4%) represent the smallest median household size with 1.26 persons per household.
| Household Type | # Households | Household Size |
| Married-Couple | 5,808 (36.2%) | 2.98 |
| Single Male/Father | 786 (4.9%) | 3.31 |
| Single Female/Mother | 2,313 (14.4%) | 3.44 |
| Non-family | 7,123 (44.4%) | 1.26 |
| Total Households | 16,030 (100.0%) | 2.30 |
Household Size by Marriage Status in Longview
Out of a total of 16,030 households in Longview, 8,907 (55.6%) are family households, while 7,123 (44.4%) are nonfamily households. The most numerous type of family households are 2-person households, comprising 4,219, and the most common type of nonfamily households are 1-person households, comprising 5,753.
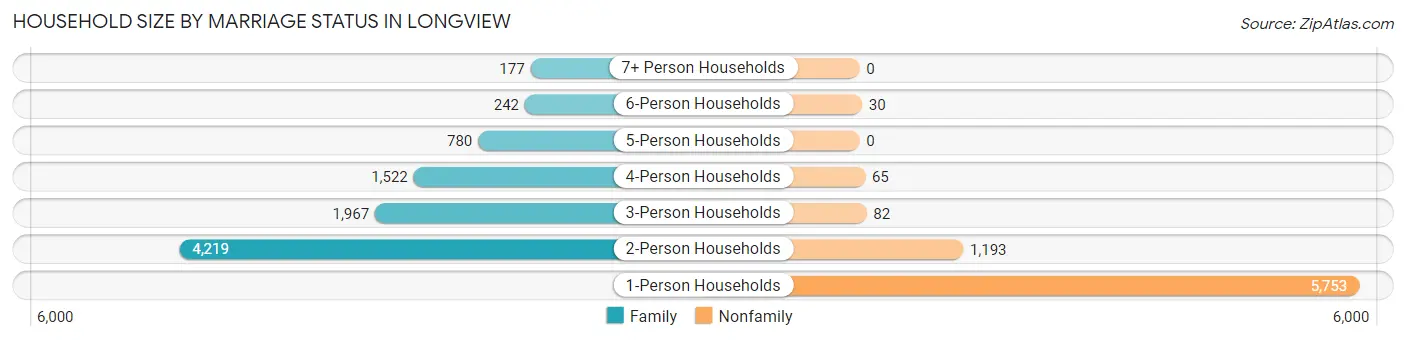
| Household Size | Family Households | Nonfamily Households |
| 1-Person Households | - | 5,753 (35.9%) |
| 2-Person Households | 4,219 (26.3%) | 1,193 (7.4%) |
| 3-Person Households | 1,967 (12.3%) | 82 (0.5%) |
| 4-Person Households | 1,522 (9.5%) | 65 (0.4%) |
| 5-Person Households | 780 (4.9%) | 0 (0.0%) |
| 6-Person Households | 242 (1.5%) | 30 (0.2%) |
| 7+ Person Households | 177 (1.1%) | 0 (0.0%) |
| Total | 8,907 (55.6%) | 7,123 (44.4%) |
Female Fertility in Longview
Fertility by Age in Longview
Average fertility rate in Longview is 44.0 births per 1,000 women. Women in the age bracket of 20 to 34 years have the highest fertility rate with 67.0 births per 1,000 women. Women in the age bracket of 20 to 34 years acount for 67.3% of all women with births.
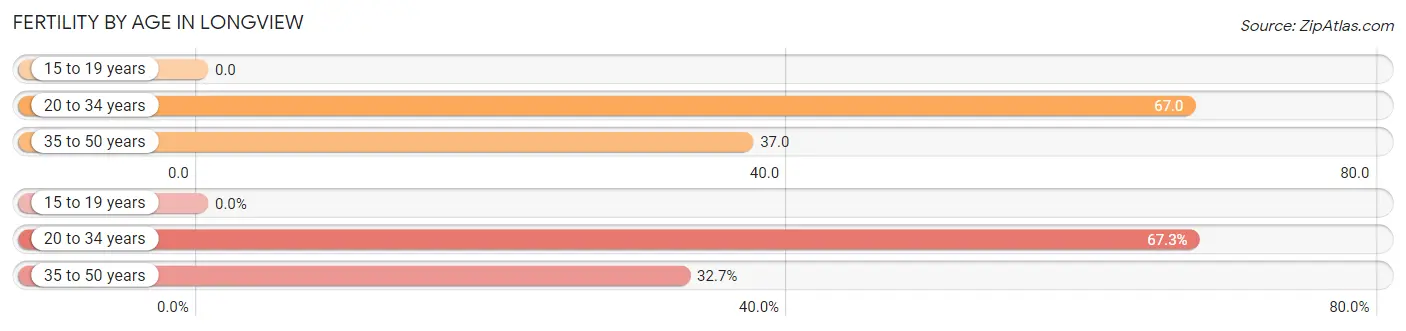
| Age Bracket | Women with Births | Births / 1,000 Women |
| 15 to 19 years | 0 (0.0%) | 0.0 |
| 20 to 34 years | 255 (67.3%) | 67.0 |
| 35 to 50 years | 124 (32.7%) | 37.0 |
| Total | 379 (100.0%) | 44.0 |
Fertility by Age by Marriage Status in Longview
52.2% of women with births (379) in Longview are married. The highest percentage of unmarried women with births falls into 35 to 50 years age bracket with 55.6% of them unmarried at the time of birth, while the lowest percentage of unmarried women with births belong to 20 to 34 years age bracket with 43.9% of them unmarried.
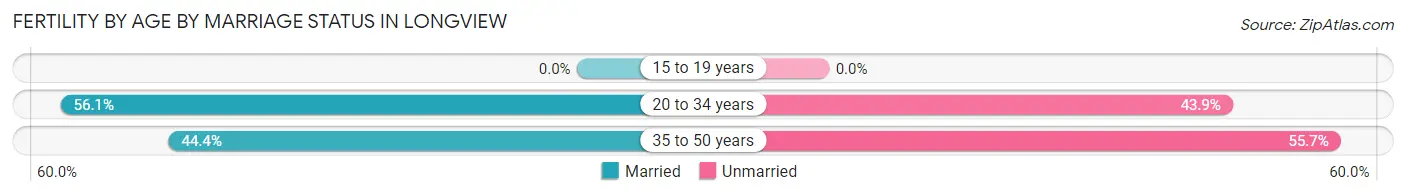
| Age Bracket | Married | Unmarried |
| 15 to 19 years | 0 (0.0%) | 0 (0.0%) |
| 20 to 34 years | 143 (56.1%) | 112 (43.9%) |
| 35 to 50 years | 55 (44.4%) | 69 (55.6%) |
| Total | 198 (52.2%) | 181 (47.8%) |
Fertility by Education in Longview
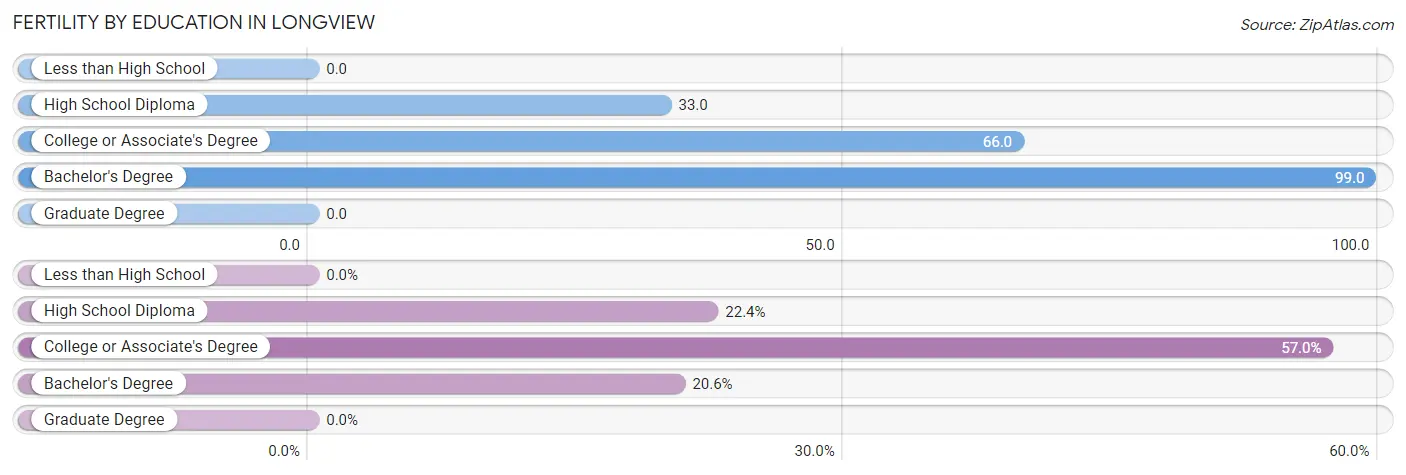
| Educational Attainment | Women with Births | Births / 1,000 Women |
| Less than High School | 0 (0.0%) | 0.0 |
| High School Diploma | 85 (22.4%) | 33.0 |
| College or Associate's Degree | 216 (57.0%) | 66.0 |
| Bachelor's Degree | 78 (20.6%) | 99.0 |
| Graduate Degree | 0 (0.0%) | 0.0 |
| Total | 379 (100.0%) | 44.0 |
Fertility by Education by Marriage Status in Longview
47.8% of women with births in Longview are unmarried. Women with the educational attainment of high school diploma are most likely to be married with 100.0% of them married at childbirth, while women with the educational attainment of bachelor's degree are least likely to be married with 76.9% of them unmarried at childbirth.
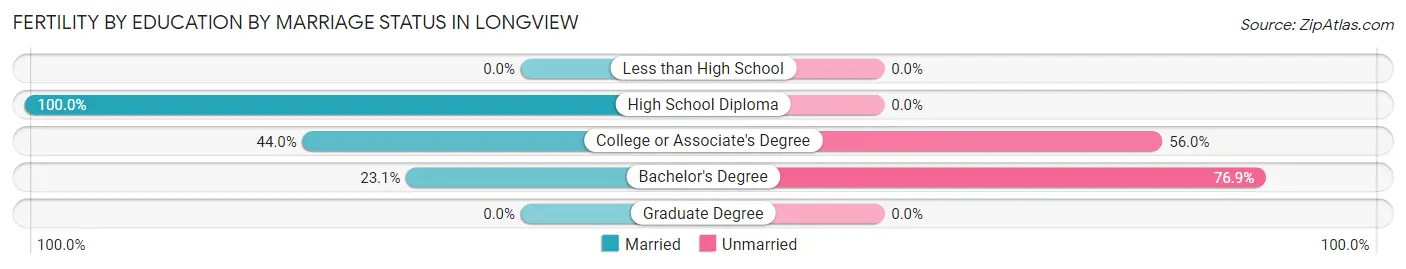
| Educational Attainment | Married | Unmarried |
| Less than High School | 0 (0.0%) | 0 (0.0%) |
| High School Diploma | 85 (100.0%) | 0 (0.0%) |
| College or Associate's Degree | 95 (44.0%) | 121 (56.0%) |
| Bachelor's Degree | 18 (23.1%) | 60 (76.9%) |
| Graduate Degree | 0 (0.0%) | 0 (0.0%) |
| Total | 198 (52.2%) | 181 (47.8%) |
Employment Characteristics in Longview
Employment by Class of Employer in Longview
Among the 16,098 employed individuals in Longview, private company employees (10,987 | 68.2%), not-for-profit organizations (1,428 | 8.9%), and local government employees (1,251 | 7.8%) make up the most common classes of employment.
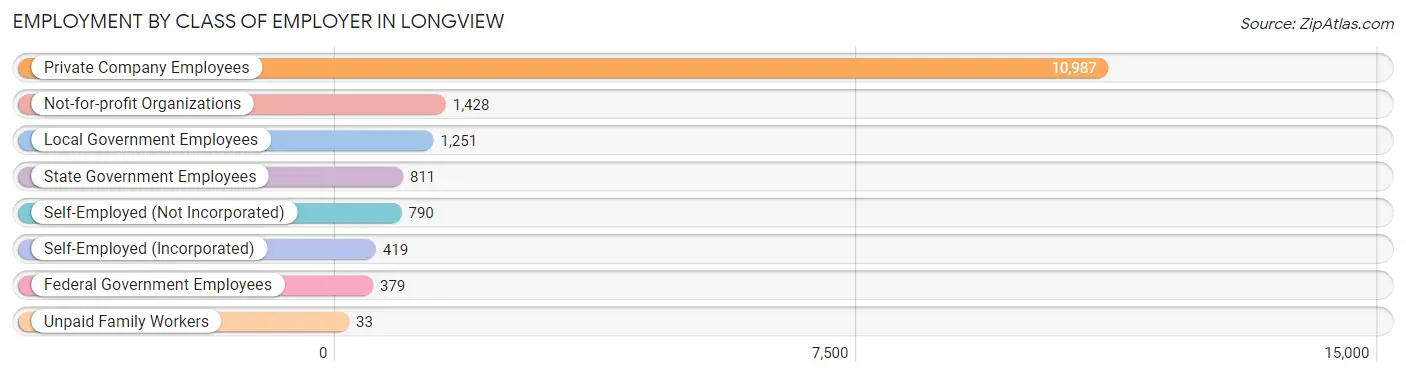
| Employer Class | # Employees | % Employees |
| Private Company Employees | 10,987 | 68.2% |
| Self-Employed (Incorporated) | 419 | 2.6% |
| Self-Employed (Not Incorporated) | 790 | 4.9% |
| Not-for-profit Organizations | 1,428 | 8.9% |
| Local Government Employees | 1,251 | 7.8% |
| State Government Employees | 811 | 5.0% |
| Federal Government Employees | 379 | 2.4% |
| Unpaid Family Workers | 33 | 0.2% |
| Total | 16,098 | 100.0% |
Employment Status by Age in Longview
According to the labor force statistics for Longview, out of the total population over 16 years of age (30,831), 56.2% or 17,327 individuals are in the labor force, with 4.5% or 780 of them unemployed. The age group with the highest labor force participation rate is 30 to 34 years, with 84.1% or 2,046 individuals in the labor force. Within the labor force, the 16 to 19 years age range has the highest percentage of unemployed individuals, with 17.0% or 171 of them being unemployed.
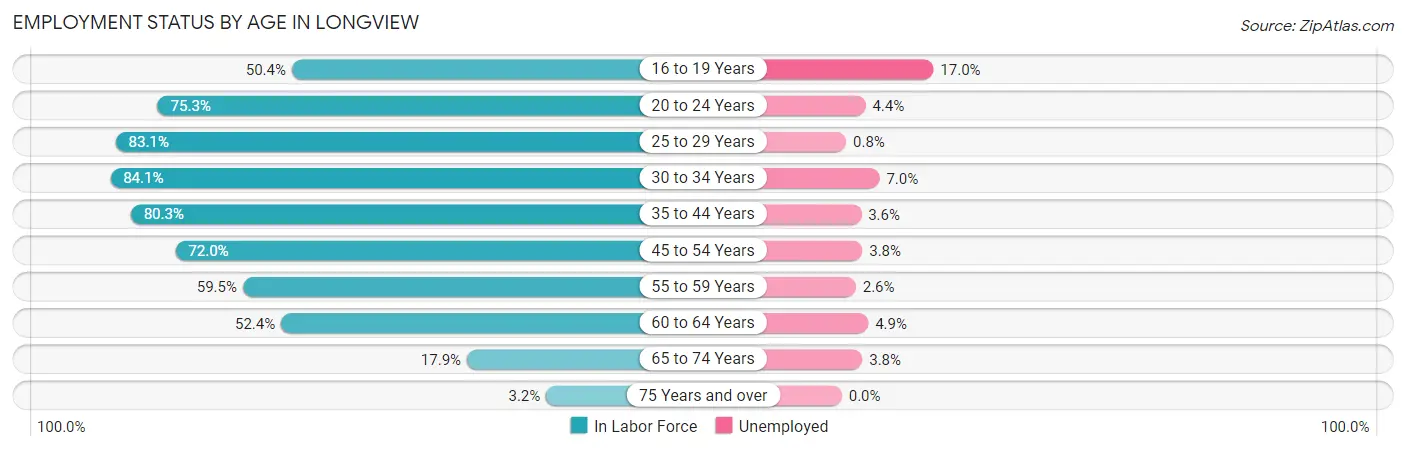
| Age Bracket | In Labor Force | Unemployed |
| 16 to 19 Years | 1,008 (50.4%) | 171 (17.0%) |
| 20 to 24 Years | 1,745 (75.3%) | 77 (4.4%) |
| 25 to 29 Years | 2,265 (83.1%) | 18 (0.8%) |
| 30 to 34 Years | 2,046 (84.1%) | 143 (7.0%) |
| 35 to 44 Years | 3,838 (80.3%) | 138 (3.6%) |
| 45 to 54 Years | 2,893 (72.0%) | 110 (3.8%) |
| 55 to 59 Years | 1,396 (59.5%) | 36 (2.6%) |
| 60 to 64 Years | 1,215 (52.4%) | 60 (4.9%) |
| 65 to 74 Years | 811 (17.9%) | 31 (3.8%) |
| 75 Years and over | 108 (3.2%) | 0 (0.0%) |
| Total | 17,327 (56.2%) | 780 (4.5%) |
Employment Status by Educational Attainment in Longview
According to labor force statistics for Longview, 73.3% of individuals (13,651) out of the total population between 25 and 64 years of age (18,623) are in the labor force, with 3.7% or 505 of them being unemployed. The group with the highest labor force participation rate are those with the educational attainment of bachelor's degree or higher, with 81.3% or 2,141 individuals in the labor force. Within the labor force, individuals with less than high school education have the highest percentage of unemployment, with 6.9% or 95 of them being unemployed.
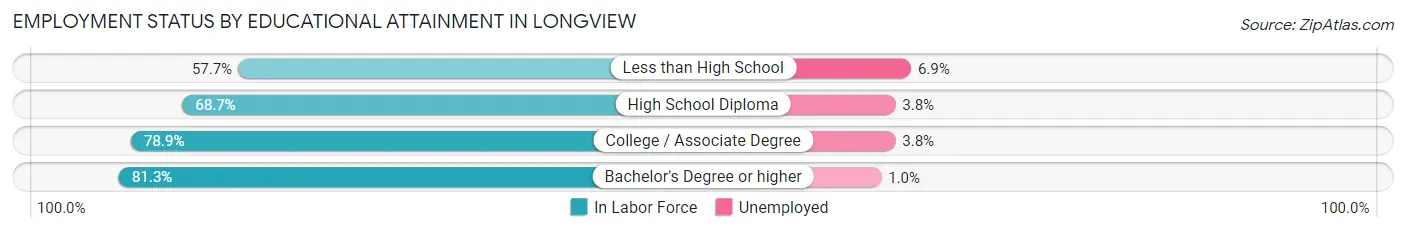
| Educational Attainment | In Labor Force | Unemployed |
| Less than High School | 1,371 (57.7%) | 164 (6.9%) |
| High School Diploma | 4,049 (68.7%) | 224 (3.8%) |
| College / Associate Degree | 6,090 (78.9%) | 293 (3.8%) |
| Bachelor's Degree or higher | 2,141 (81.3%) | 26 (1.0%) |
| Total | 13,651 (73.3%) | 689 (3.7%) |
Employment Occupations by Sex in Longview
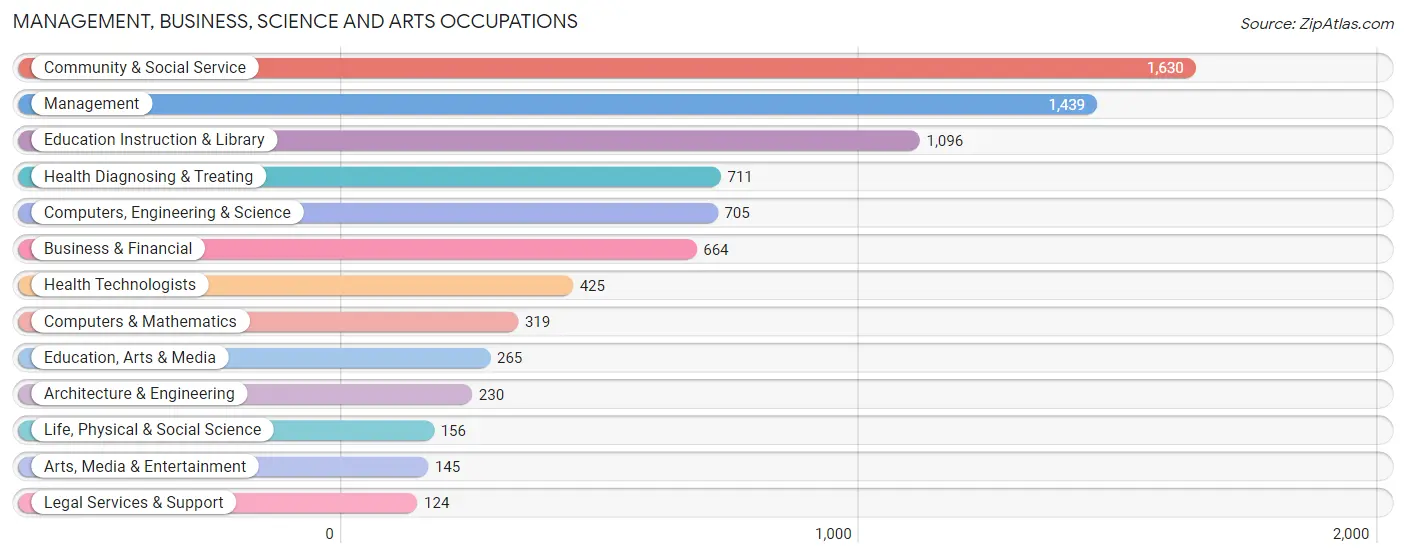
Management, Business, Science and Arts Occupations
The most common Management, Business, Science and Arts occupations in Longview are Community & Social Service (1,630 | 9.9%), Management (1,439 | 8.7%), Education Instruction & Library (1,096 | 6.6%), Health Diagnosing & Treating (711 | 4.3%), and Computers, Engineering & Science (705 | 4.3%).
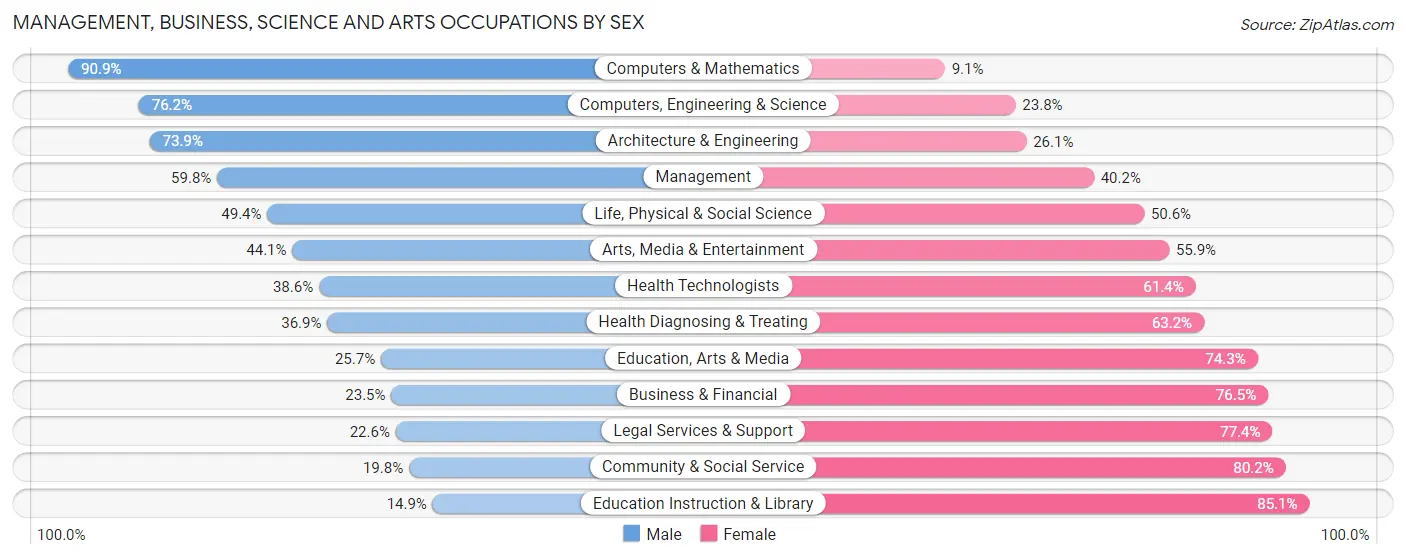
Management, Business, Science and Arts Occupations by Sex
Within the Management, Business, Science and Arts occupations in Longview, the most male-oriented occupations are Computers & Mathematics (90.9%), Computers, Engineering & Science (76.2%), and Architecture & Engineering (73.9%), while the most female-oriented occupations are Education Instruction & Library (85.1%), Community & Social Service (80.2%), and Legal Services & Support (77.4%).
| Occupation | Male | Female |
| Management | 861 (59.8%) | 578 (40.2%) |
| Business & Financial | 156 (23.5%) | 508 (76.5%) |
| Computers, Engineering & Science | 537 (76.2%) | 168 (23.8%) |
| Computers & Mathematics | 290 (90.9%) | 29 (9.1%) |
| Architecture & Engineering | 170 (73.9%) | 60 (26.1%) |
| Life, Physical & Social Science | 77 (49.4%) | 79 (50.6%) |
| Community & Social Service | 323 (19.8%) | 1,307 (80.2%) |
| Education, Arts & Media | 68 (25.7%) | 197 (74.3%) |
| Legal Services & Support | 28 (22.6%) | 96 (77.4%) |
| Education Instruction & Library | 163 (14.9%) | 933 (85.1%) |
| Arts, Media & Entertainment | 64 (44.1%) | 81 (55.9%) |
| Health Diagnosing & Treating | 262 (36.8%) | 449 (63.1%) |
| Health Technologists | 164 (38.6%) | 261 (61.4%) |
| Total (Category) | 2,139 (41.5%) | 3,010 (58.5%) |
| Total (Overall) | 8,384 (50.7%) | 8,147 (49.3%) |
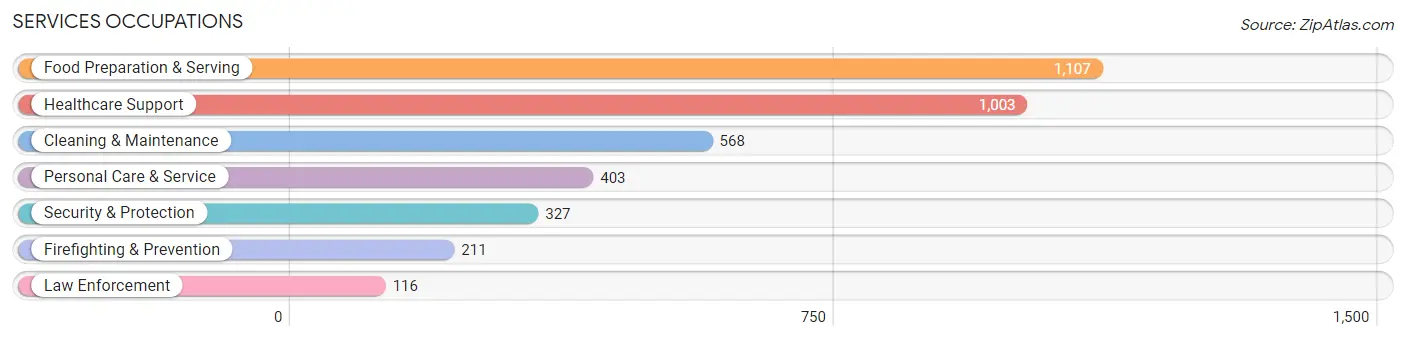
Services Occupations
The most common Services occupations in Longview are Food Preparation & Serving (1,107 | 6.7%), Healthcare Support (1,003 | 6.1%), Cleaning & Maintenance (568 | 3.4%), Personal Care & Service (403 | 2.4%), and Security & Protection (327 | 2.0%).
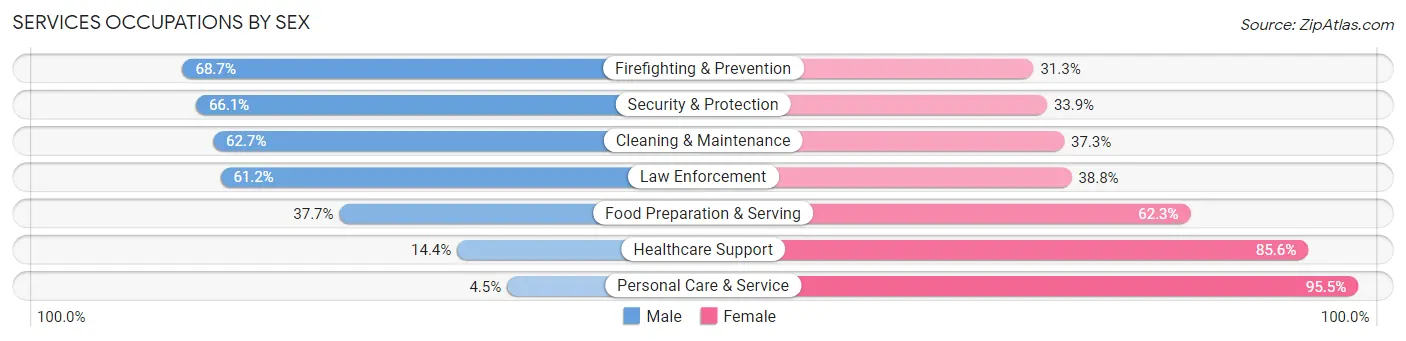
Services Occupations by Sex
Within the Services occupations in Longview, the most male-oriented occupations are Firefighting & Prevention (68.7%), Security & Protection (66.1%), and Cleaning & Maintenance (62.7%), while the most female-oriented occupations are Personal Care & Service (95.5%), Healthcare Support (85.6%), and Food Preparation & Serving (62.3%).
| Occupation | Male | Female |
| Healthcare Support | 144 (14.4%) | 859 (85.6%) |
| Security & Protection | 216 (66.1%) | 111 (33.9%) |
| Firefighting & Prevention | 145 (68.7%) | 66 (31.3%) |
| Law Enforcement | 71 (61.2%) | 45 (38.8%) |
| Food Preparation & Serving | 417 (37.7%) | 690 (62.3%) |
| Cleaning & Maintenance | 356 (62.7%) | 212 (37.3%) |
| Personal Care & Service | 18 (4.5%) | 385 (95.5%) |
| Total (Category) | 1,151 (33.8%) | 2,257 (66.2%) |
| Total (Overall) | 8,384 (50.7%) | 8,147 (49.3%) |
Sales and Office Occupations
The most common Sales and Office occupations in Longview are Sales & Related (1,609 | 9.7%), and Office & Administration (1,423 | 8.6%).

Sales and Office Occupations by Sex
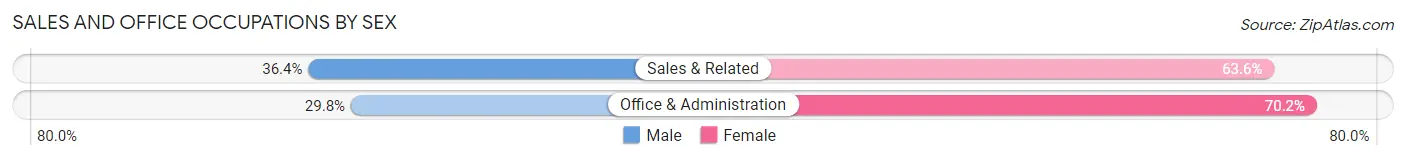
| Occupation | Male | Female |
| Sales & Related | 585 (36.4%) | 1,024 (63.6%) |
| Office & Administration | 424 (29.8%) | 999 (70.2%) |
| Total (Category) | 1,009 (33.3%) | 2,023 (66.7%) |
| Total (Overall) | 8,384 (50.7%) | 8,147 (49.3%) |
Natural Resources, Construction and Maintenance Occupations
The most common Natural Resources, Construction and Maintenance occupations in Longview are Construction & Extraction (1,104 | 6.7%), Installation, Maintenance & Repair (492 | 3.0%), and Farming, Fishing & Forestry (157 | 0.9%).

Natural Resources, Construction and Maintenance Occupations by Sex
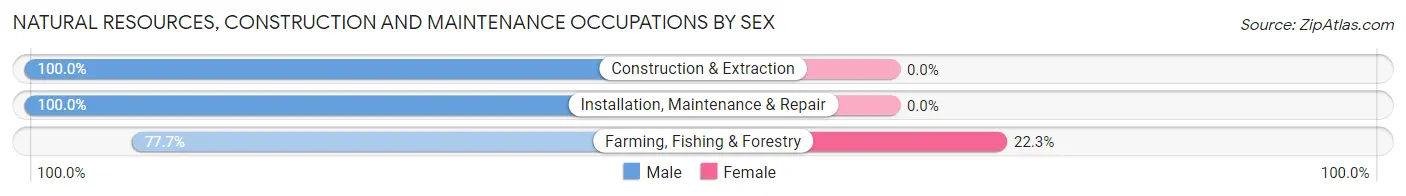
| Occupation | Male | Female |
| Farming, Fishing & Forestry | 122 (77.7%) | 35 (22.3%) |
| Construction & Extraction | 1,104 (100.0%) | 0 (0.0%) |
| Installation, Maintenance & Repair | 492 (100.0%) | 0 (0.0%) |
| Total (Category) | 1,718 (98.0%) | 35 (2.0%) |
| Total (Overall) | 8,384 (50.7%) | 8,147 (49.3%) |
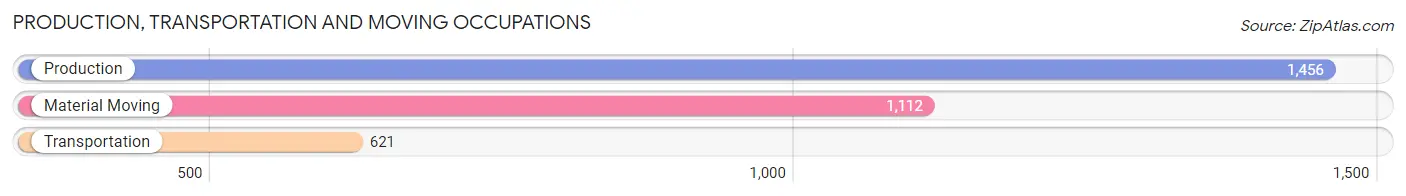
Production, Transportation and Moving Occupations
The most common Production, Transportation and Moving occupations in Longview are Production (1,456 | 8.8%), Material Moving (1,112 | 6.7%), and Transportation (621 | 3.8%).
Production, Transportation and Moving Occupations by Sex
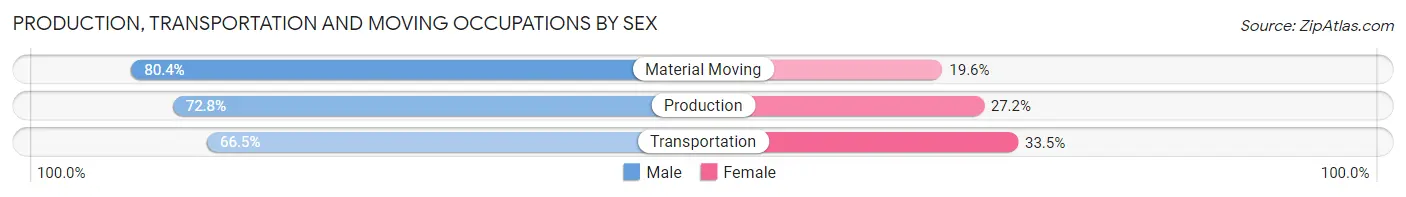
| Occupation | Male | Female |
| Production | 1,060 (72.8%) | 396 (27.2%) |
| Transportation | 413 (66.5%) | 208 (33.5%) |
| Material Moving | 894 (80.4%) | 218 (19.6%) |
| Total (Category) | 2,367 (74.2%) | 822 (25.8%) |
| Total (Overall) | 8,384 (50.7%) | 8,147 (49.3%) |
Employment Industries by Sex in Longview
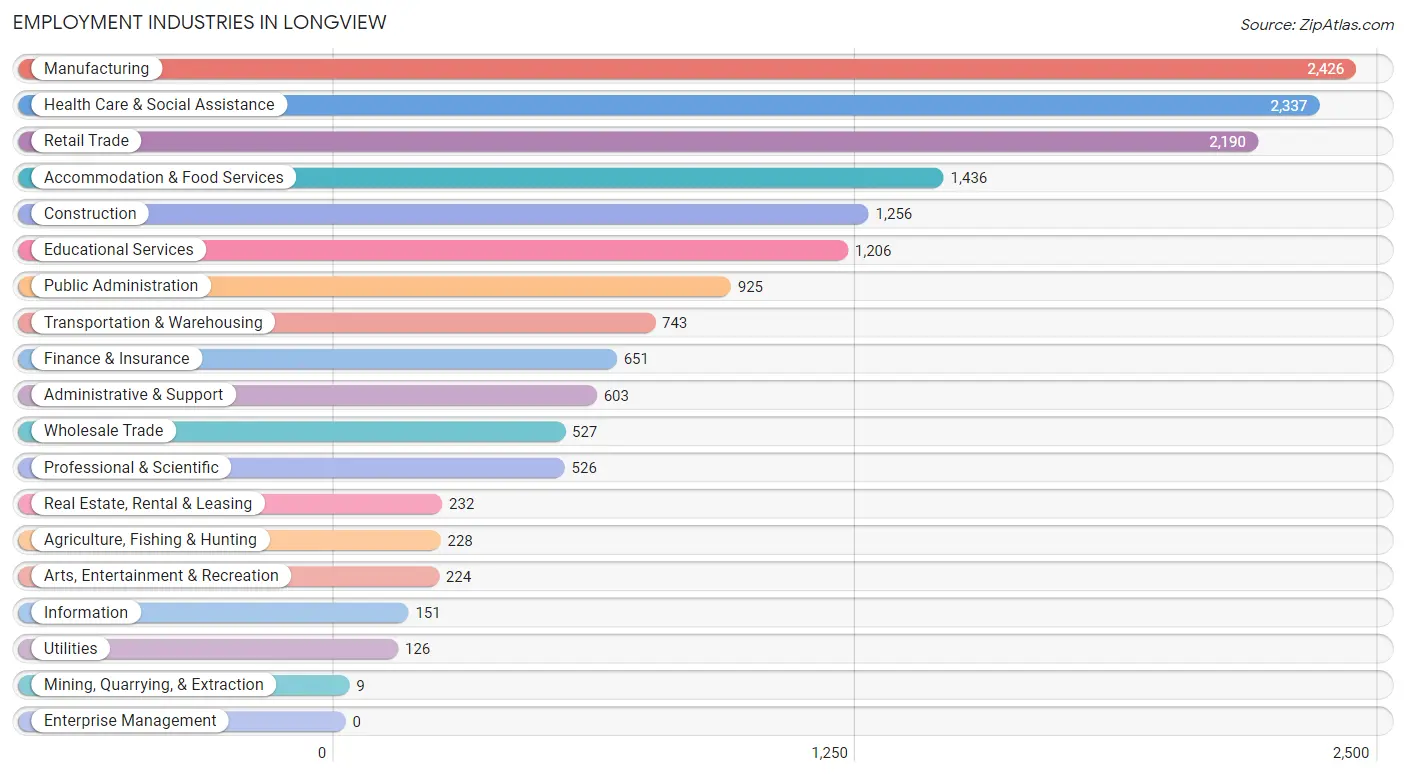
Employment Industries in Longview
The major employment industries in Longview include Manufacturing (2,426 | 14.7%), Health Care & Social Assistance (2,337 | 14.1%), Retail Trade (2,190 | 13.3%), Accommodation & Food Services (1,436 | 8.7%), and Construction (1,256 | 7.6%).
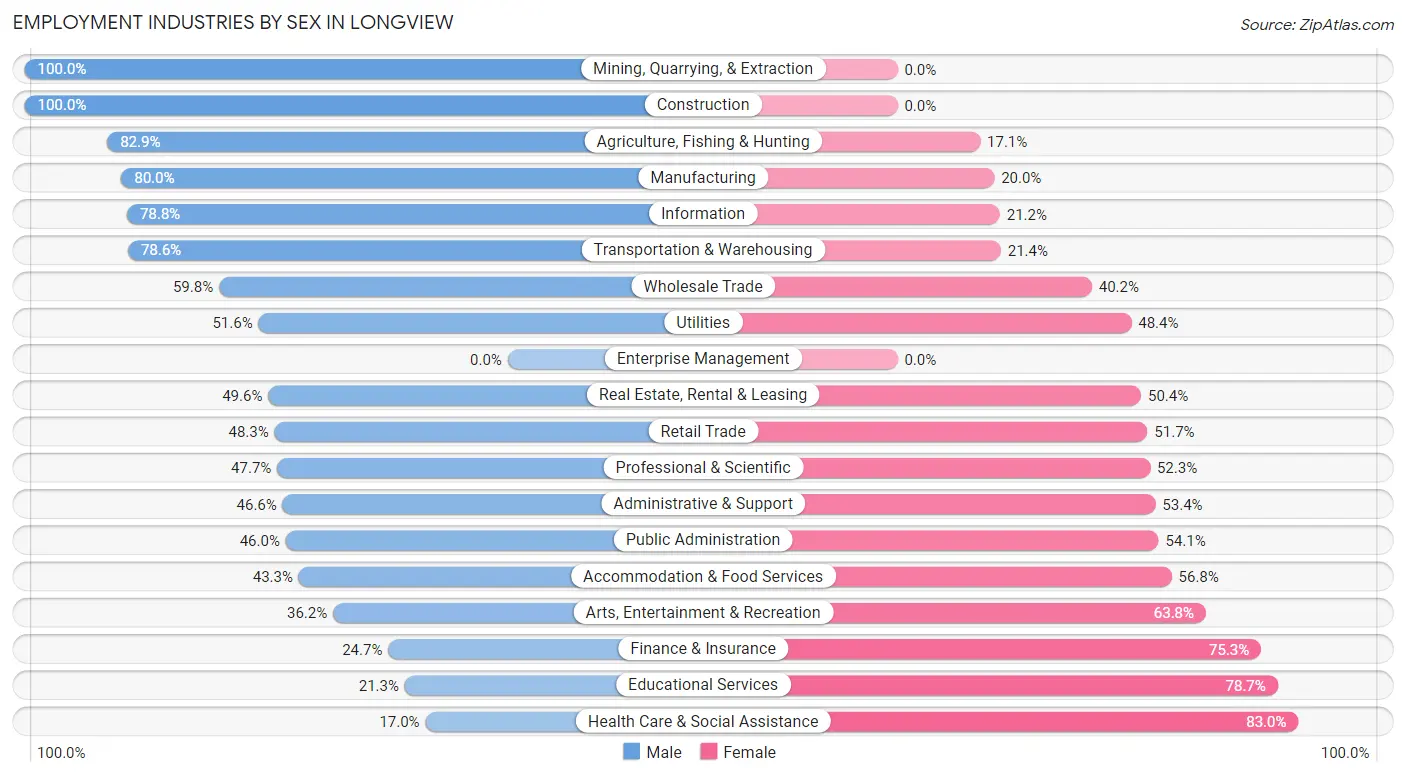
Employment Industries by Sex in Longview
The Longview industries that see more men than women are Mining, Quarrying, & Extraction (100.0%), Construction (100.0%), and Agriculture, Fishing & Hunting (82.9%), whereas the industries that tend to have a higher number of women are Health Care & Social Assistance (83.0%), Educational Services (78.7%), and Finance & Insurance (75.3%).
| Industry | Male | Female |
| Agriculture, Fishing & Hunting | 189 (82.9%) | 39 (17.1%) |
| Mining, Quarrying, & Extraction | 9 (100.0%) | 0 (0.0%) |
| Construction | 1,256 (100.0%) | 0 (0.0%) |
| Manufacturing | 1,940 (80.0%) | 486 (20.0%) |
| Wholesale Trade | 315 (59.8%) | 212 (40.2%) |
| Retail Trade | 1,057 (48.3%) | 1,133 (51.7%) |
| Transportation & Warehousing | 584 (78.6%) | 159 (21.4%) |
| Utilities | 65 (51.6%) | 61 (48.4%) |
| Information | 119 (78.8%) | 32 (21.2%) |
| Finance & Insurance | 161 (24.7%) | 490 (75.3%) |
| Real Estate, Rental & Leasing | 115 (49.6%) | 117 (50.4%) |
| Professional & Scientific | 251 (47.7%) | 275 (52.3%) |
| Enterprise Management | 0 (0.0%) | 0 (0.0%) |
| Administrative & Support | 281 (46.6%) | 322 (53.4%) |
| Educational Services | 257 (21.3%) | 949 (78.7%) |
| Health Care & Social Assistance | 398 (17.0%) | 1,939 (83.0%) |
| Arts, Entertainment & Recreation | 81 (36.2%) | 143 (63.8%) |
| Accommodation & Food Services | 621 (43.2%) | 815 (56.8%) |
| Public Administration | 425 (46.0%) | 500 (54.0%) |
| Total | 8,384 (50.7%) | 8,147 (49.3%) |
Education in Longview
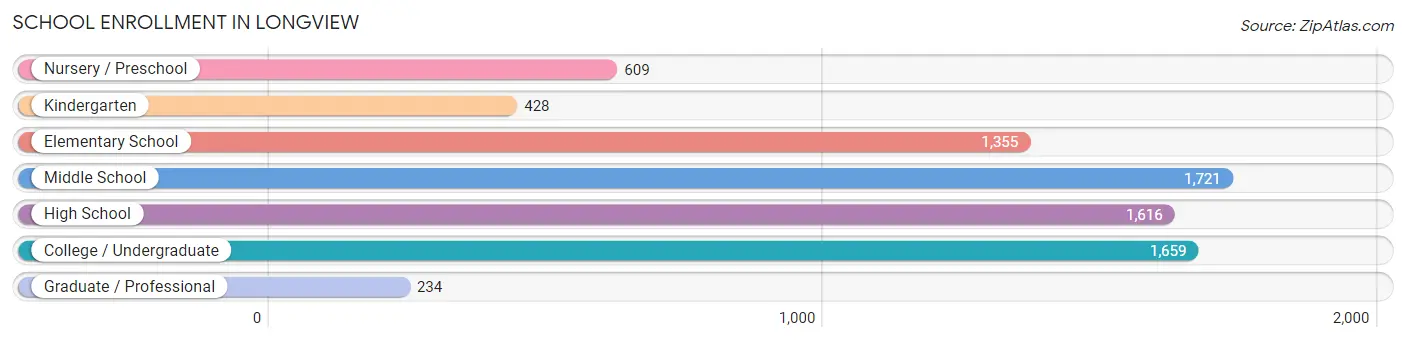
School Enrollment in Longview
The most common levels of schooling among the 7,622 students in Longview are middle school (1,721 | 22.6%), college / undergraduate (1,659 | 21.8%), and high school (1,616 | 21.2%).
| School Level | # Students | % Students |
| Nursery / Preschool | 609 | 8.0% |
| Kindergarten | 428 | 5.6% |
| Elementary School | 1,355 | 17.8% |
| Middle School | 1,721 | 22.6% |
| High School | 1,616 | 21.2% |
| College / Undergraduate | 1,659 | 21.8% |
| Graduate / Professional | 234 | 3.1% |
| Total | 7,622 | 100.0% |
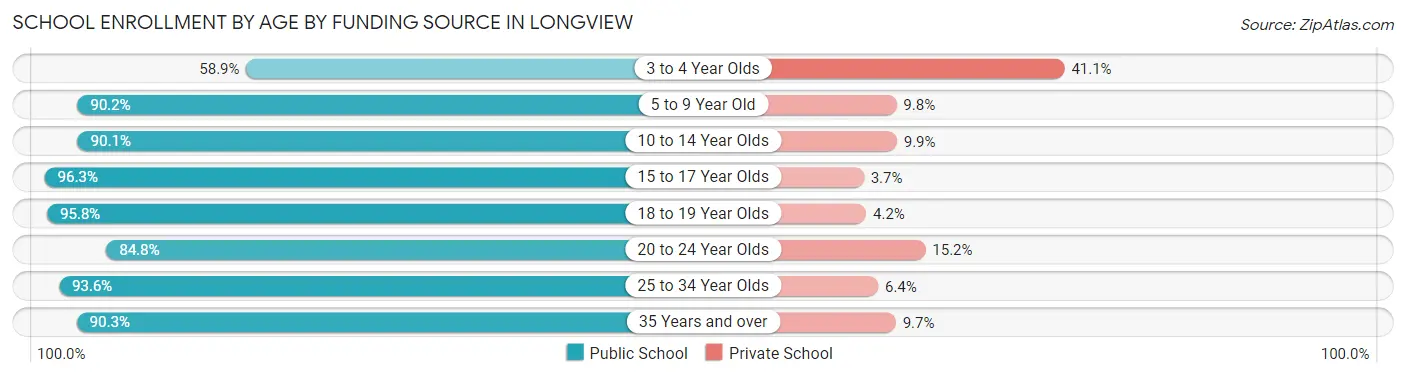
School Enrollment by Age by Funding Source in Longview
Out of a total of 7,622 students who are enrolled in schools in Longview, 823 (10.8%) attend a private institution, while the remaining 6,799 (89.2%) are enrolled in public schools. The age group of 3 to 4 year olds has the highest likelihood of being enrolled in private schools, with 220 (41.1% in the age bracket) enrolled. Conversely, the age group of 15 to 17 year olds has the lowest likelihood of being enrolled in a private school, with 1,137 (96.3% in the age bracket) attending a public institution.
| Age Bracket | Public School | Private School |
| 3 to 4 Year Olds | 315 (58.9%) | 220 (41.1%) |
| 5 to 9 Year Old | 1,460 (90.2%) | 159 (9.8%) |
| 10 to 14 Year Olds | 1,905 (90.1%) | 209 (9.9%) |
| 15 to 17 Year Olds | 1,137 (96.3%) | 44 (3.7%) |
| 18 to 19 Year Olds | 460 (95.8%) | 20 (4.2%) |
| 20 to 24 Year Olds | 390 (84.8%) | 70 (15.2%) |
| 25 to 34 Year Olds | 556 (93.6%) | 38 (6.4%) |
| 35 Years and over | 577 (90.3%) | 62 (9.7%) |
| Total | 6,799 (89.2%) | 823 (10.8%) |
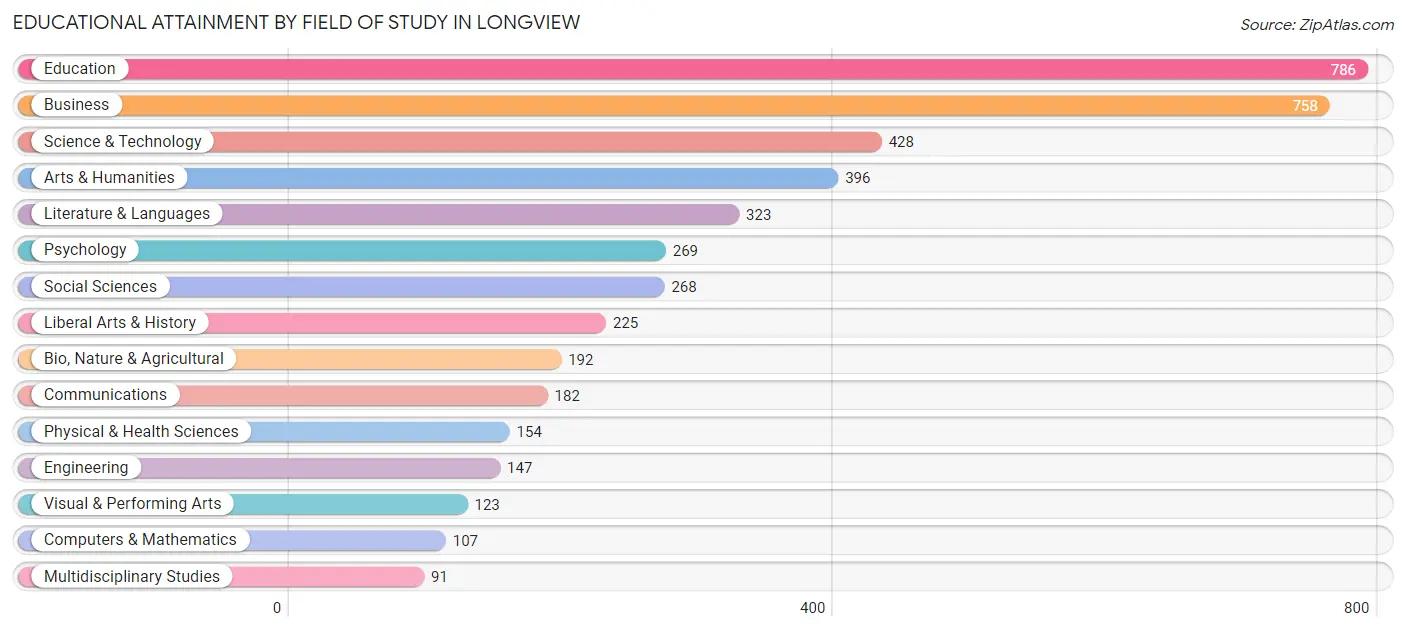
Educational Attainment by Field of Study in Longview
Education (786 | 17.7%), business (758 | 17.0%), science & technology (428 | 9.6%), arts & humanities (396 | 8.9%), and literature & languages (323 | 7.3%) are the most common fields of study among 4,449 individuals in Longview who have obtained a bachelor's degree or higher.
| Field of Study | # Graduates | % Graduates |
| Computers & Mathematics | 107 | 2.4% |
| Bio, Nature & Agricultural | 192 | 4.3% |
| Physical & Health Sciences | 154 | 3.5% |
| Psychology | 269 | 6.0% |
| Social Sciences | 268 | 6.0% |
| Engineering | 147 | 3.3% |
| Multidisciplinary Studies | 91 | 2.1% |
| Science & Technology | 428 | 9.6% |
| Business | 758 | 17.0% |
| Education | 786 | 17.7% |
| Literature & Languages | 323 | 7.3% |
| Liberal Arts & History | 225 | 5.1% |
| Visual & Performing Arts | 123 | 2.8% |
| Communications | 182 | 4.1% |
| Arts & Humanities | 396 | 8.9% |
| Total | 4,449 | 100.0% |
Transportation & Commute in Longview
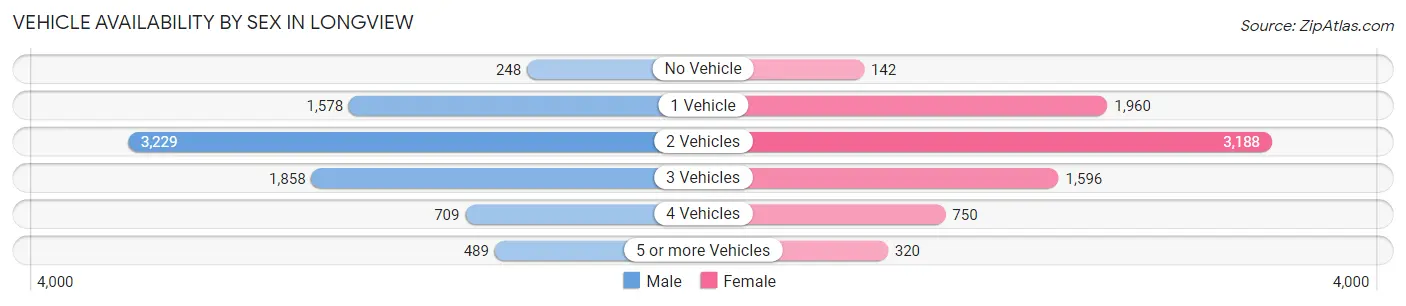
Vehicle Availability by Sex in Longview
The most prevalent vehicle ownership categories in Longview are males with 2 vehicles (3,229, accounting for 39.8%) and females with 2 vehicles (3,188, making up 40.6%).
| Vehicles Available | Male | Female |
| No Vehicle | 248 (3.1%) | 142 (1.8%) |
| 1 Vehicle | 1,578 (19.5%) | 1,960 (24.6%) |
| 2 Vehicles | 3,229 (39.8%) | 3,188 (40.1%) |
| 3 Vehicles | 1,858 (22.9%) | 1,596 (20.1%) |
| 4 Vehicles | 709 (8.7%) | 750 (9.4%) |
| 5 or more Vehicles | 489 (6.0%) | 320 (4.0%) |
| Total | 8,111 (100.0%) | 7,956 (100.0%) |
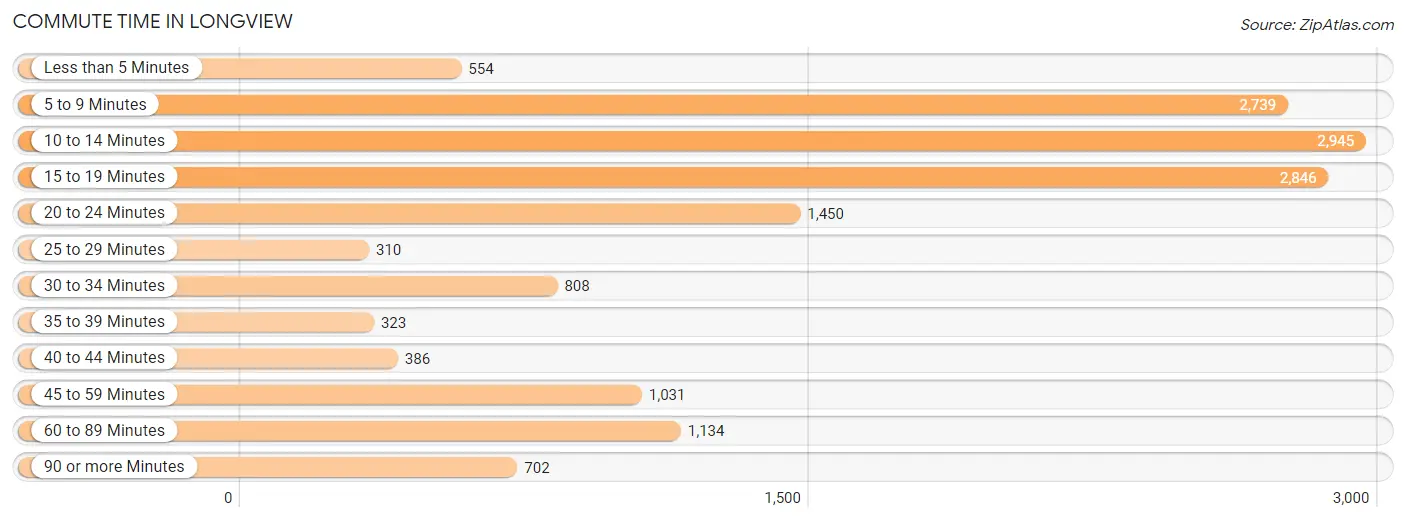
Commute Time in Longview
The most frequently occuring commute durations in Longview are 10 to 14 minutes (2,945 commuters, 19.3%), 15 to 19 minutes (2,846 commuters, 18.7%), and 5 to 9 minutes (2,739 commuters, 18.0%).
| Commute Time | # Commuters | % Commuters |
| Less than 5 Minutes | 554 | 3.6% |
| 5 to 9 Minutes | 2,739 | 18.0% |
| 10 to 14 Minutes | 2,945 | 19.3% |
| 15 to 19 Minutes | 2,846 | 18.7% |
| 20 to 24 Minutes | 1,450 | 9.5% |
| 25 to 29 Minutes | 310 | 2.0% |
| 30 to 34 Minutes | 808 | 5.3% |
| 35 to 39 Minutes | 323 | 2.1% |
| 40 to 44 Minutes | 386 | 2.5% |
| 45 to 59 Minutes | 1,031 | 6.8% |
| 60 to 89 Minutes | 1,134 | 7.4% |
| 90 or more Minutes | 702 | 4.6% |
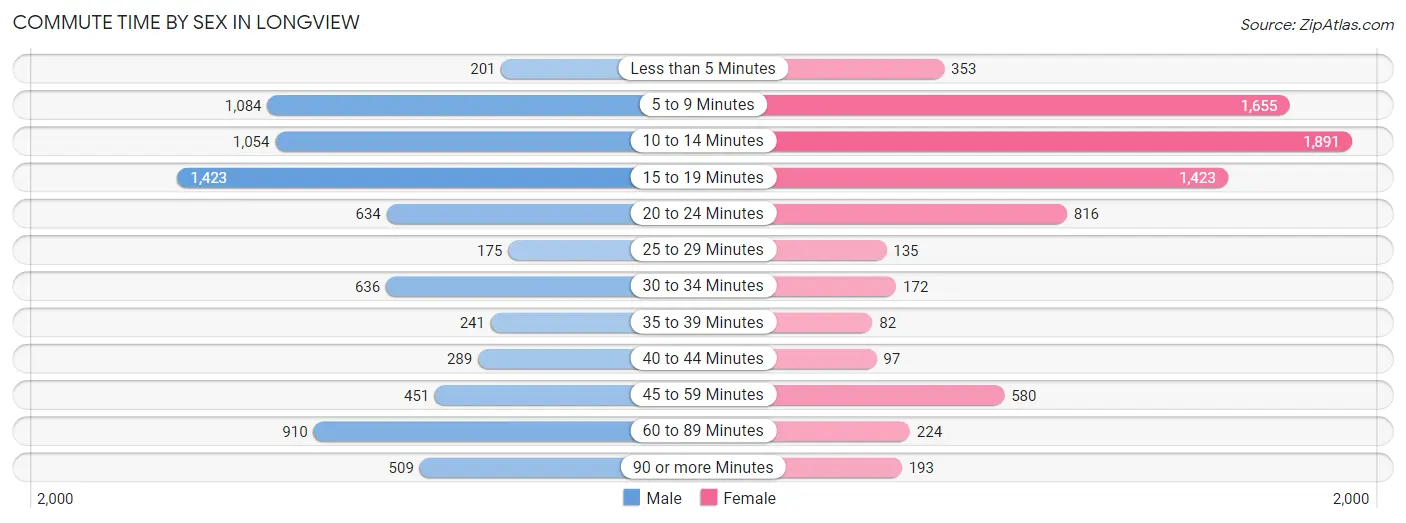
Commute Time by Sex in Longview
The most common commute times in Longview are 15 to 19 minutes (1,423 commuters, 18.7%) for males and 10 to 14 minutes (1,891 commuters, 24.8%) for females.
| Commute Time | Male | Female |
| Less than 5 Minutes | 201 (2.6%) | 353 (4.6%) |
| 5 to 9 Minutes | 1,084 (14.2%) | 1,655 (21.7%) |
| 10 to 14 Minutes | 1,054 (13.9%) | 1,891 (24.8%) |
| 15 to 19 Minutes | 1,423 (18.7%) | 1,423 (18.7%) |
| 20 to 24 Minutes | 634 (8.3%) | 816 (10.7%) |
| 25 to 29 Minutes | 175 (2.3%) | 135 (1.8%) |
| 30 to 34 Minutes | 636 (8.4%) | 172 (2.3%) |
| 35 to 39 Minutes | 241 (3.2%) | 82 (1.1%) |
| 40 to 44 Minutes | 289 (3.8%) | 97 (1.3%) |
| 45 to 59 Minutes | 451 (5.9%) | 580 (7.6%) |
| 60 to 89 Minutes | 910 (12.0%) | 224 (2.9%) |
| 90 or more Minutes | 509 (6.7%) | 193 (2.5%) |
Time of Departure to Work by Sex in Longview
The most frequent times of departure to work in Longview are 7:30 AM to 7:59 AM (986, 13.0%) for males and 7:30 AM to 7:59 AM (1,374, 18.0%) for females.
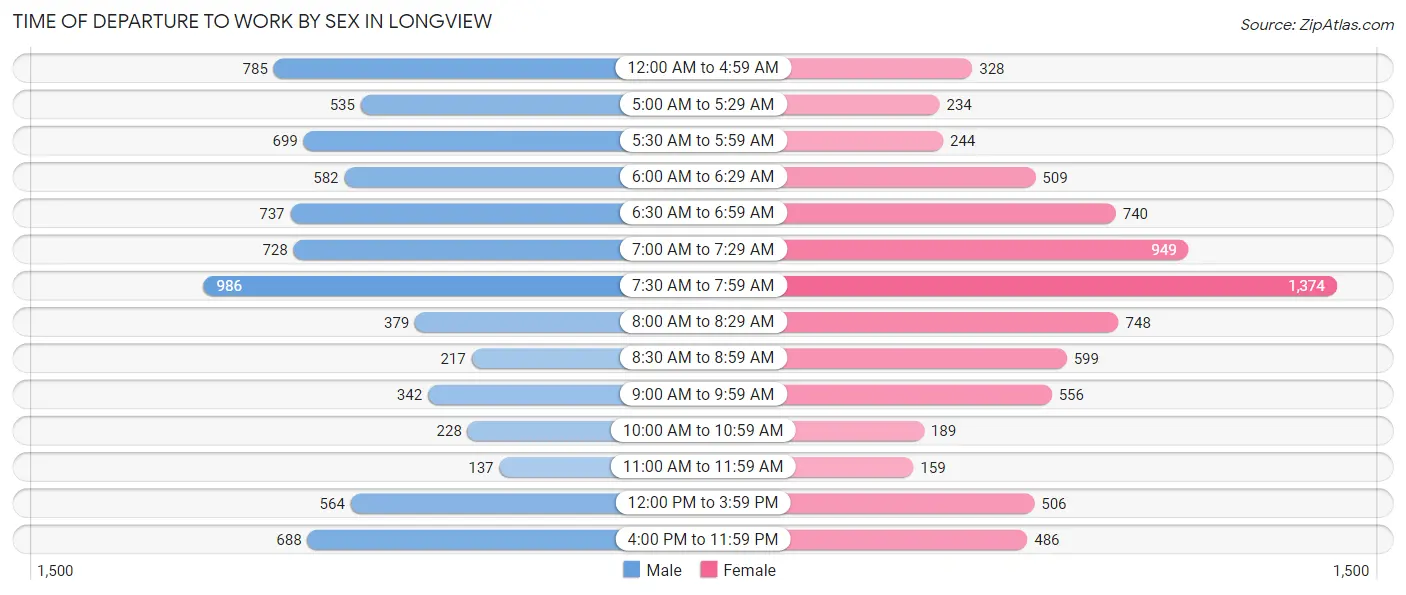
| Time of Departure | Male | Female |
| 12:00 AM to 4:59 AM | 785 (10.3%) | 328 (4.3%) |
| 5:00 AM to 5:29 AM | 535 (7.0%) | 234 (3.1%) |
| 5:30 AM to 5:59 AM | 699 (9.2%) | 244 (3.2%) |
| 6:00 AM to 6:29 AM | 582 (7.6%) | 509 (6.7%) |
| 6:30 AM to 6:59 AM | 737 (9.7%) | 740 (9.7%) |
| 7:00 AM to 7:29 AM | 728 (9.6%) | 949 (12.4%) |
| 7:30 AM to 7:59 AM | 986 (13.0%) | 1,374 (18.0%) |
| 8:00 AM to 8:29 AM | 379 (5.0%) | 748 (9.8%) |
| 8:30 AM to 8:59 AM | 217 (2.9%) | 599 (7.9%) |
| 9:00 AM to 9:59 AM | 342 (4.5%) | 556 (7.3%) |
| 10:00 AM to 10:59 AM | 228 (3.0%) | 189 (2.5%) |
| 11:00 AM to 11:59 AM | 137 (1.8%) | 159 (2.1%) |
| 12:00 PM to 3:59 PM | 564 (7.4%) | 506 (6.6%) |
| 4:00 PM to 11:59 PM | 688 (9.0%) | 486 (6.4%) |
| Total | 7,607 (100.0%) | 7,621 (100.0%) |
Housing Occupancy in Longview
Occupancy by Ownership in Longview
Of the total 16,030 dwellings in Longview, owner-occupied units account for 8,445 (52.7%), while renter-occupied units make up 7,585 (47.3%).
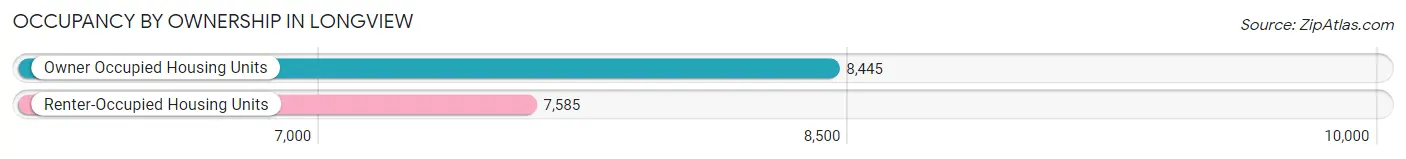
| Occupancy | # Housing Units | % Housing Units |
| Owner Occupied Housing Units | 8,445 | 52.7% |
| Renter-Occupied Housing Units | 7,585 | 47.3% |
| Total Occupied Housing Units | 16,030 | 100.0% |
Occupancy by Household Size in Longview
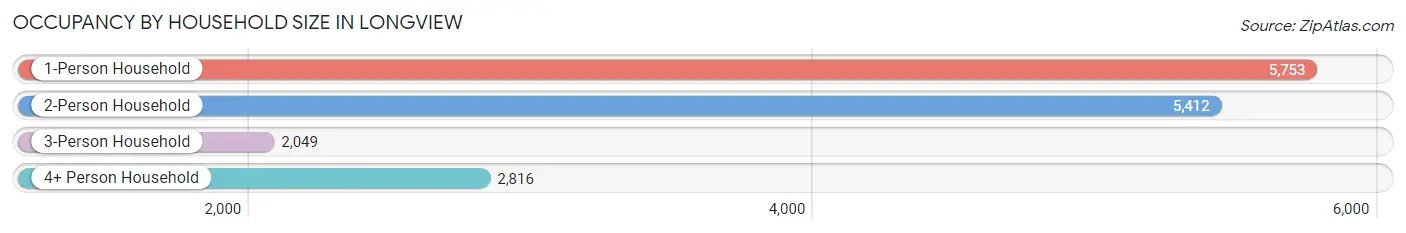
| Household Size | # Housing Units | % Housing Units |
| 1-Person Household | 5,753 | 35.9% |
| 2-Person Household | 5,412 | 33.8% |
| 3-Person Household | 2,049 | 12.8% |
| 4+ Person Household | 2,816 | 17.6% |
| Total Housing Units | 16,030 | 100.0% |
Occupancy by Ownership by Household Size in Longview
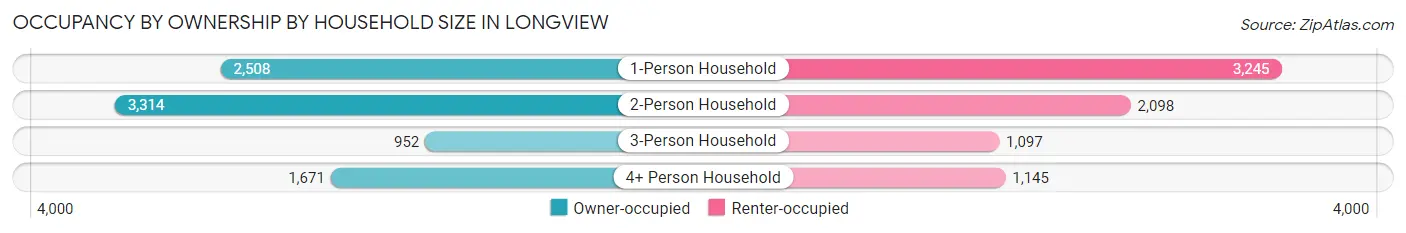
| Household Size | Owner-occupied | Renter-occupied |
| 1-Person Household | 2,508 (43.6%) | 3,245 (56.4%) |
| 2-Person Household | 3,314 (61.2%) | 2,098 (38.8%) |
| 3-Person Household | 952 (46.5%) | 1,097 (53.5%) |
| 4+ Person Household | 1,671 (59.3%) | 1,145 (40.7%) |
| Total Housing Units | 8,445 (52.7%) | 7,585 (47.3%) |
Occupancy by Educational Attainment in Longview
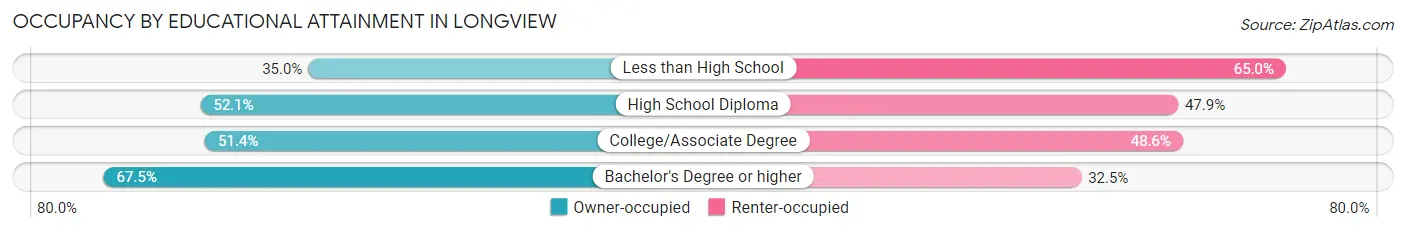
| Household Size | Owner-occupied | Renter-occupied |
| Less than High School | 540 (35.0%) | 1,002 (65.0%) |
| High School Diploma | 2,330 (52.1%) | 2,140 (47.9%) |
| College/Associate Degree | 3,776 (51.4%) | 3,576 (48.6%) |
| Bachelor's Degree or higher | 1,799 (67.5%) | 867 (32.5%) |
Occupancy by Age of Householder in Longview
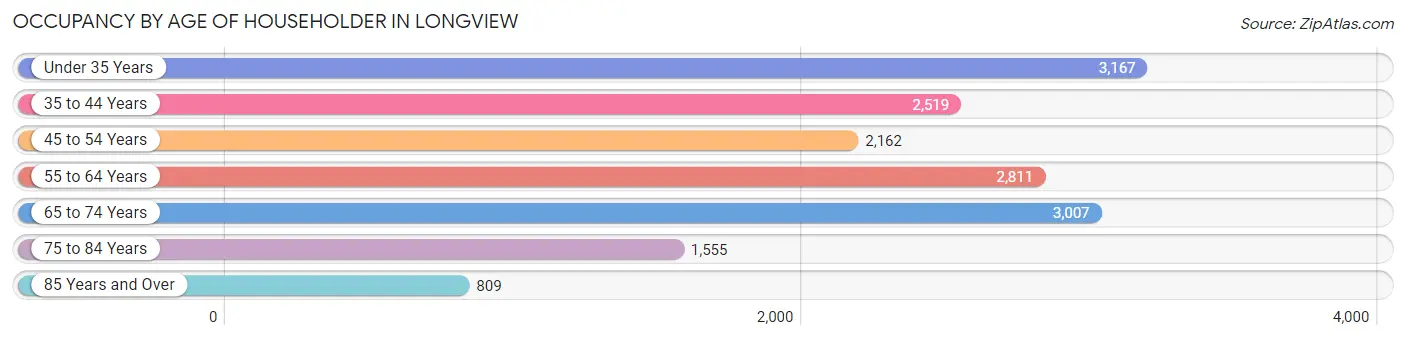
| Age Bracket | # Households | % Households |
| Under 35 Years | 3,167 | 19.8% |
| 35 to 44 Years | 2,519 | 15.7% |
| 45 to 54 Years | 2,162 | 13.5% |
| 55 to 64 Years | 2,811 | 17.5% |
| 65 to 74 Years | 3,007 | 18.8% |
| 75 to 84 Years | 1,555 | 9.7% |
| 85 Years and Over | 809 | 5.1% |
| Total | 16,030 | 100.0% |
Housing Finances in Longview
Median Income by Occupancy in Longview
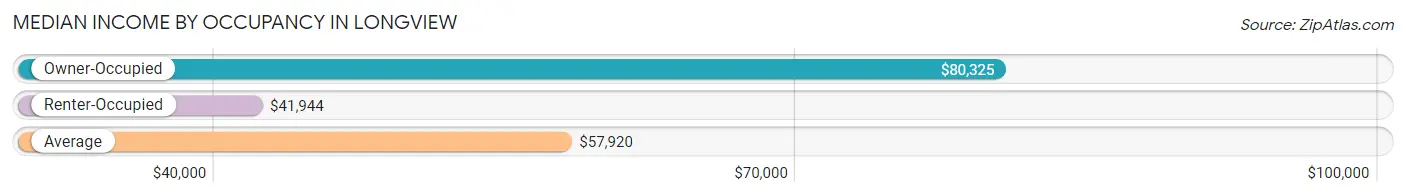
| Occupancy Type | # Households | Median Income |
| Owner-Occupied | 8,445 (52.7%) | $80,325 |
| Renter-Occupied | 7,585 (47.3%) | $41,944 |
| Average | 16,030 (100.0%) | $57,920 |
Occupancy by Householder Income Bracket in Longview
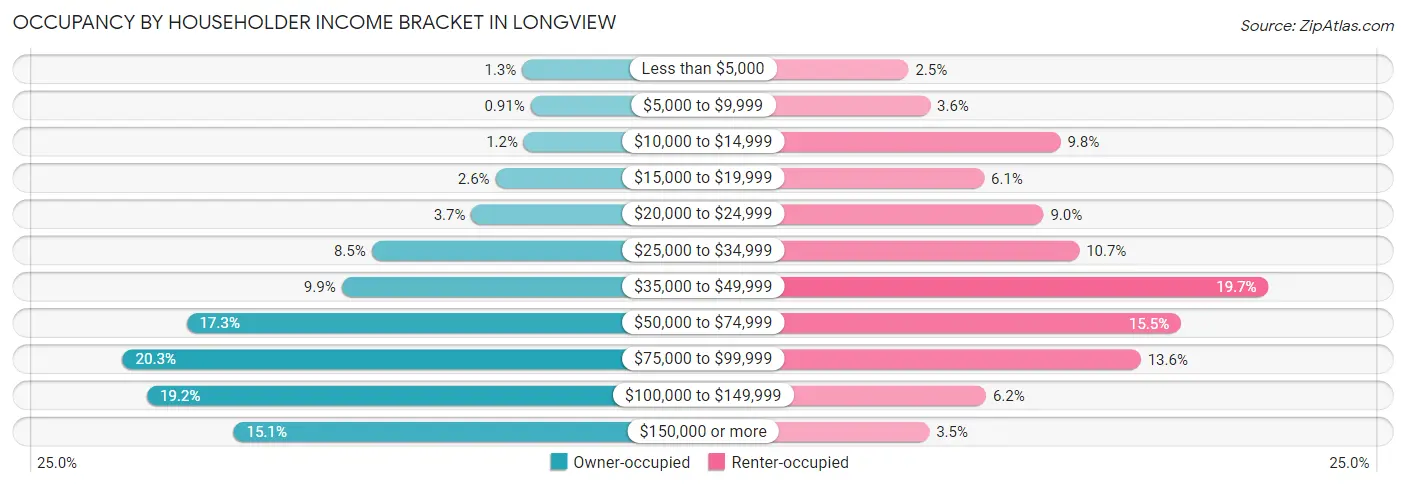
| Income Bracket | Owner-occupied | Renter-occupied |
| Less than $5,000 | 111 (1.3%) | 191 (2.5%) |
| $5,000 to $9,999 | 77 (0.9%) | 269 (3.5%) |
| $10,000 to $14,999 | 104 (1.2%) | 740 (9.8%) |
| $15,000 to $19,999 | 218 (2.6%) | 464 (6.1%) |
| $20,000 to $24,999 | 315 (3.7%) | 679 (8.9%) |
| $25,000 to $34,999 | 716 (8.5%) | 808 (10.6%) |
| $35,000 to $49,999 | 837 (9.9%) | 1,491 (19.7%) |
| $50,000 to $74,999 | 1,460 (17.3%) | 1,176 (15.5%) |
| $75,000 to $99,999 | 1,717 (20.3%) | 1,030 (13.6%) |
| $100,000 to $149,999 | 1,619 (19.2%) | 471 (6.2%) |
| $150,000 or more | 1,271 (15.0%) | 266 (3.5%) |
| Total | 8,445 (100.0%) | 7,585 (100.0%) |
Monthly Housing Cost Tiers in Longview
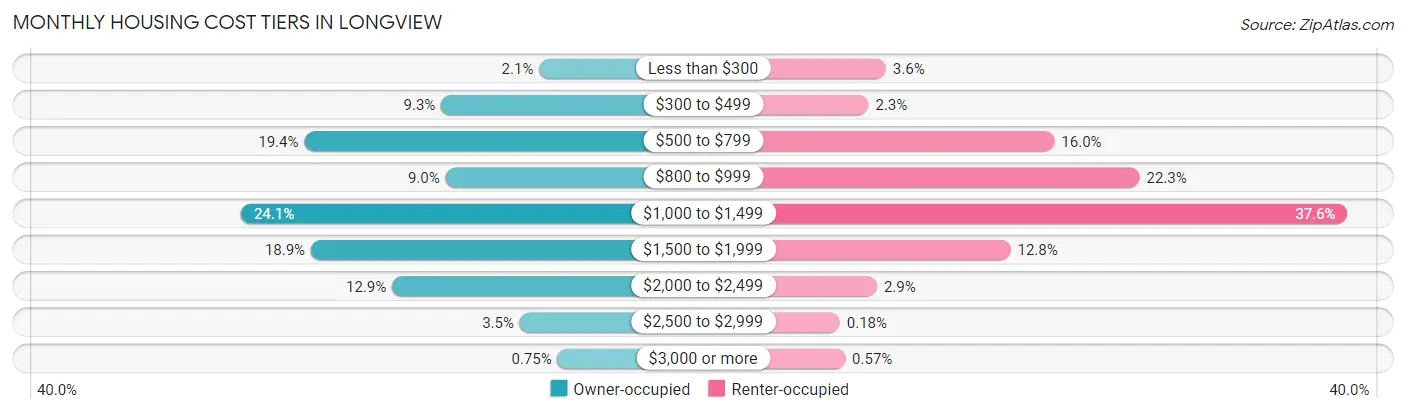
| Monthly Cost | Owner-occupied | Renter-occupied |
| Less than $300 | 177 (2.1%) | 271 (3.6%) |
| $300 to $499 | 787 (9.3%) | 174 (2.3%) |
| $500 to $799 | 1,638 (19.4%) | 1,212 (16.0%) |
| $800 to $999 | 760 (9.0%) | 1,688 (22.3%) |
| $1,000 to $1,499 | 2,032 (24.1%) | 2,849 (37.6%) |
| $1,500 to $1,999 | 1,597 (18.9%) | 967 (12.8%) |
| $2,000 to $2,499 | 1,093 (12.9%) | 221 (2.9%) |
| $2,500 to $2,999 | 298 (3.5%) | 14 (0.2%) |
| $3,000 or more | 63 (0.7%) | 43 (0.6%) |
| Total | 8,445 (100.0%) | 7,585 (100.0%) |
Physical Housing Characteristics in Longview
Housing Structures in Longview
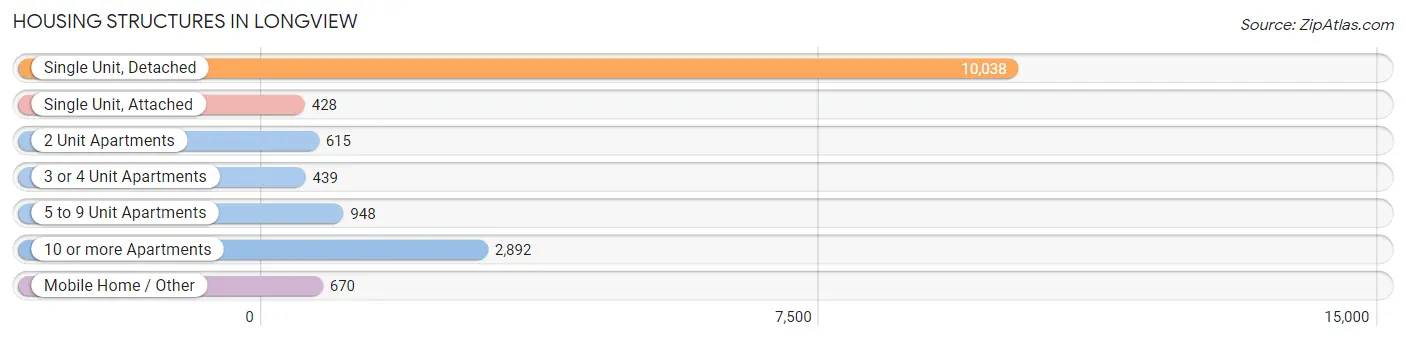
| Structure Type | # Housing Units | % Housing Units |
| Single Unit, Detached | 10,038 | 62.6% |
| Single Unit, Attached | 428 | 2.7% |
| 2 Unit Apartments | 615 | 3.8% |
| 3 or 4 Unit Apartments | 439 | 2.7% |
| 5 to 9 Unit Apartments | 948 | 5.9% |
| 10 or more Apartments | 2,892 | 18.0% |
| Mobile Home / Other | 670 | 4.2% |
| Total | 16,030 | 100.0% |
Housing Structures by Occupancy in Longview
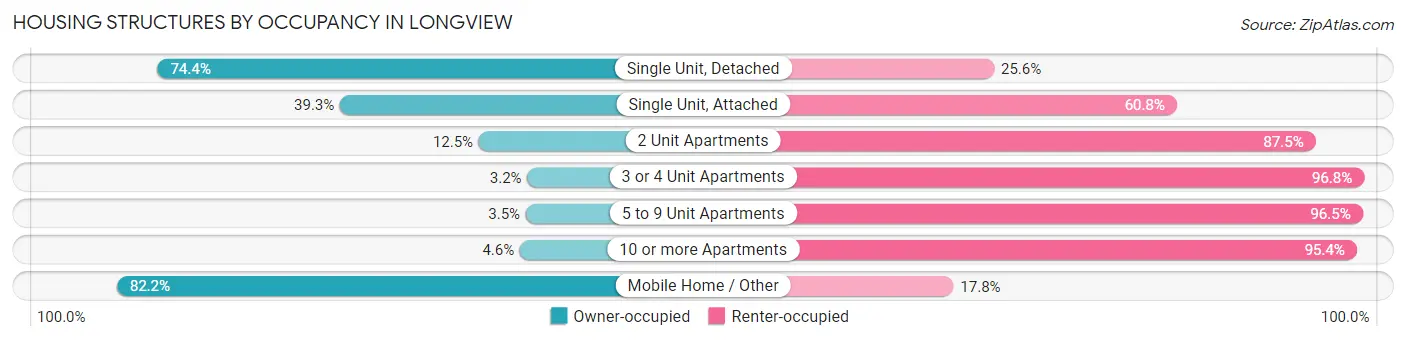
| Structure Type | Owner-occupied | Renter-occupied |
| Single Unit, Detached | 7,469 (74.4%) | 2,569 (25.6%) |
| Single Unit, Attached | 168 (39.3%) | 260 (60.8%) |
| 2 Unit Apartments | 77 (12.5%) | 538 (87.5%) |
| 3 or 4 Unit Apartments | 14 (3.2%) | 425 (96.8%) |
| 5 to 9 Unit Apartments | 33 (3.5%) | 915 (96.5%) |
| 10 or more Apartments | 133 (4.6%) | 2,759 (95.4%) |
| Mobile Home / Other | 551 (82.2%) | 119 (17.8%) |
| Total | 8,445 (52.7%) | 7,585 (47.3%) |
Housing Structures by Number of Rooms in Longview
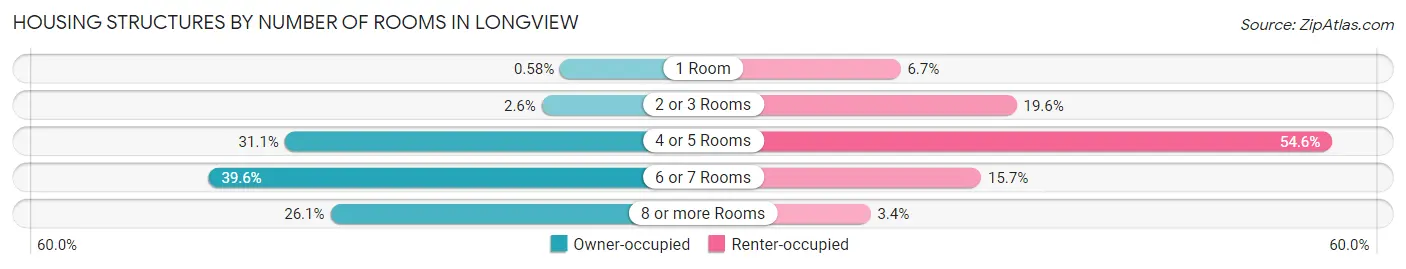
| Number of Rooms | Owner-occupied | Renter-occupied |
| 1 Room | 49 (0.6%) | 510 (6.7%) |
| 2 or 3 Rooms | 221 (2.6%) | 1,487 (19.6%) |
| 4 or 5 Rooms | 2,630 (31.1%) | 4,143 (54.6%) |
| 6 or 7 Rooms | 3,343 (39.6%) | 1,188 (15.7%) |
| 8 or more Rooms | 2,202 (26.1%) | 257 (3.4%) |
| Total | 8,445 (100.0%) | 7,585 (100.0%) |
Housing Structure by Heating Type in Longview
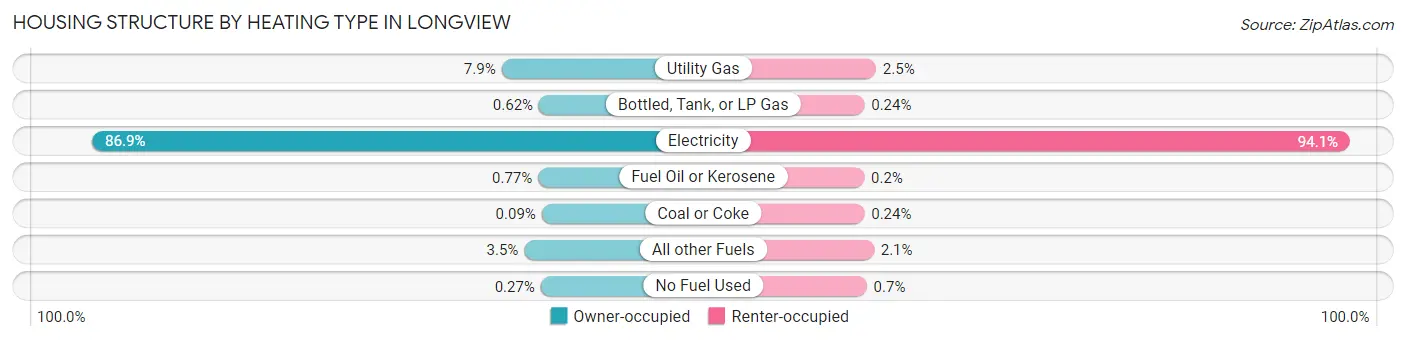
| Heating Type | Owner-occupied | Renter-occupied |
| Utility Gas | 663 (7.9%) | 189 (2.5%) |
| Bottled, Tank, or LP Gas | 52 (0.6%) | 18 (0.2%) |
| Electricity | 7,342 (86.9%) | 7,135 (94.1%) |
| Fuel Oil or Kerosene | 65 (0.8%) | 15 (0.2%) |
| Coal or Coke | 8 (0.1%) | 18 (0.2%) |
| All other Fuels | 292 (3.5%) | 157 (2.1%) |
| No Fuel Used | 23 (0.3%) | 53 (0.7%) |
| Total | 8,445 (100.0%) | 7,585 (100.0%) |
Household Vehicle Usage in Longview
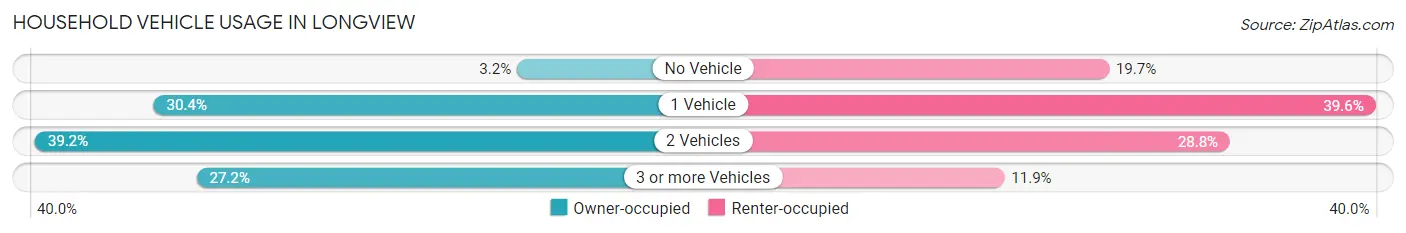
| Vehicles per Household | Owner-occupied | Renter-occupied |
| No Vehicle | 273 (3.2%) | 1,496 (19.7%) |
| 1 Vehicle | 2,565 (30.4%) | 3,005 (39.6%) |
| 2 Vehicles | 3,313 (39.2%) | 2,181 (28.7%) |
| 3 or more Vehicles | 2,294 (27.2%) | 903 (11.9%) |
| Total | 8,445 (100.0%) | 7,585 (100.0%) |
Real Estate & Mortgages in Longview
Real Estate and Mortgage Overview in Longview
| Characteristic | Without Mortgage | With Mortgage |
| Housing Units | 3,184 | 5,261 |
| Median Property Value | $297,900 | $312,400 |
| Median Household Income | $68,846 | $838 |
| Monthly Housing Costs | $622 | $63 |
| Real Estate Taxes | $2,697 | $78 |
Property Value by Mortgage Status in Longview
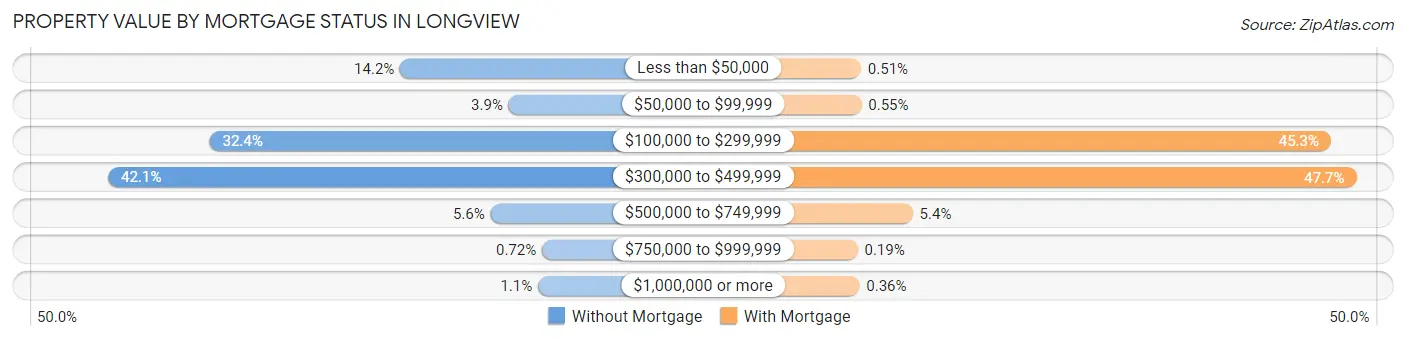
| Property Value | Without Mortgage | With Mortgage |
| Less than $50,000 | 453 (14.2%) | 27 (0.5%) |
| $50,000 to $99,999 | 124 (3.9%) | 29 (0.5%) |
| $100,000 to $299,999 | 1,031 (32.4%) | 2,381 (45.3%) |
| $300,000 to $499,999 | 1,339 (42.0%) | 2,509 (47.7%) |
| $500,000 to $749,999 | 179 (5.6%) | 286 (5.4%) |
| $750,000 to $999,999 | 23 (0.7%) | 10 (0.2%) |
| $1,000,000 or more | 35 (1.1%) | 19 (0.4%) |
| Total | 3,184 (100.0%) | 5,261 (100.0%) |
Household Income by Mortgage Status in Longview
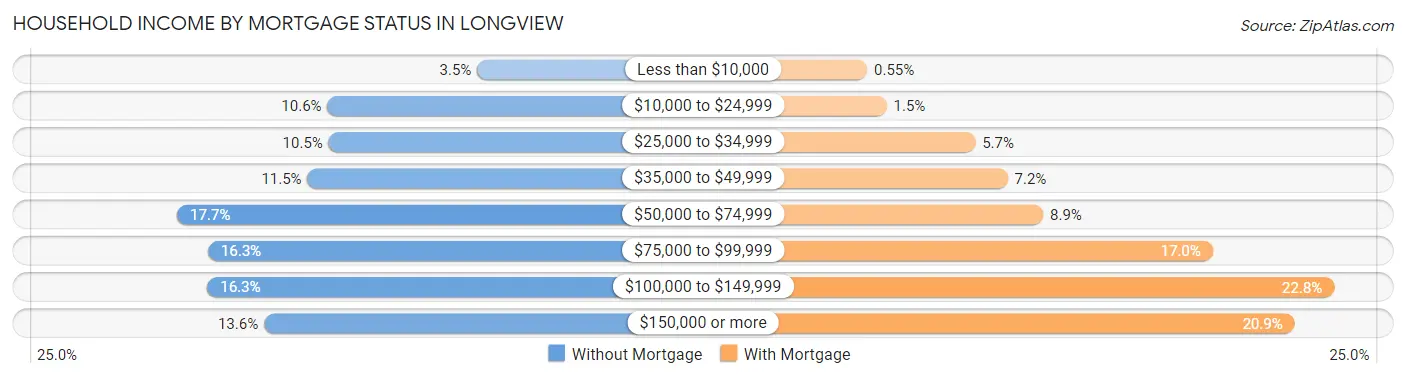
| Household Income | Without Mortgage | With Mortgage |
| Less than $10,000 | 110 (3.5%) | 29 (0.5%) |
| $10,000 to $24,999 | 337 (10.6%) | 78 (1.5%) |
| $25,000 to $34,999 | 335 (10.5%) | 300 (5.7%) |
| $35,000 to $49,999 | 367 (11.5%) | 381 (7.2%) |
| $50,000 to $74,999 | 565 (17.7%) | 470 (8.9%) |
| $75,000 to $99,999 | 518 (16.3%) | 895 (17.0%) |
| $100,000 to $149,999 | 519 (16.3%) | 1,199 (22.8%) |
| $150,000 or more | 433 (13.6%) | 1,100 (20.9%) |
| Total | 3,184 (100.0%) | 5,261 (100.0%) |
Property Value to Household Income Ratio in Longview
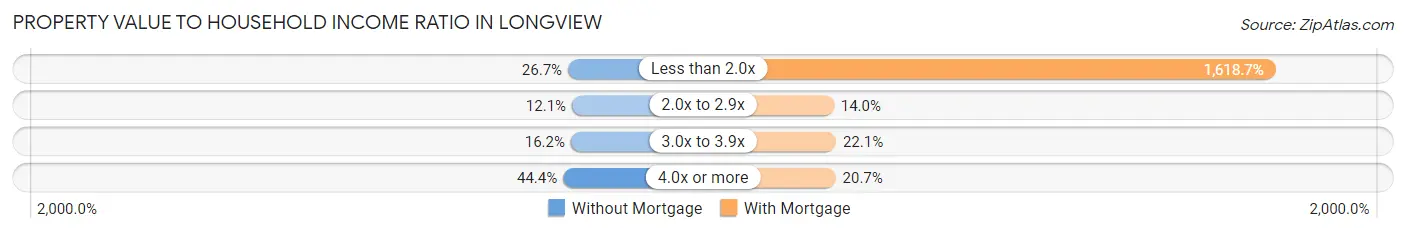
| Value-to-Income Ratio | Without Mortgage | With Mortgage |
| Less than 2.0x | 849 (26.7%) | 85,158 (1,618.7%) |
| 2.0x to 2.9x | 385 (12.1%) | 734 (14.0%) |
| 3.0x to 3.9x | 515 (16.2%) | 1,163 (22.1%) |
| 4.0x or more | 1,412 (44.4%) | 1,088 (20.7%) |
| Total | 3,184 (100.0%) | 5,261 (100.0%) |
Real Estate Taxes by Mortgage Status in Longview
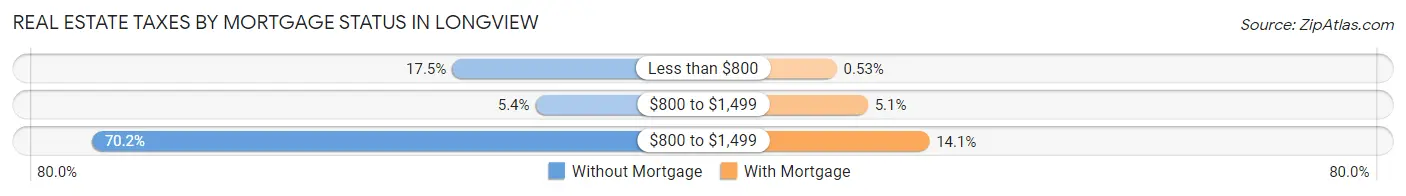
| Property Taxes | Without Mortgage | With Mortgage |
| Less than $800 | 558 (17.5%) | 28 (0.5%) |
| $800 to $1,499 | 171 (5.4%) | 266 (5.1%) |
| $800 to $1,499 | 2,235 (70.2%) | 739 (14.1%) |
| Total | 3,184 (100.0%) | 5,261 (100.0%) |
Health & Disability in Longview
Health Insurance Coverage by Age in Longview
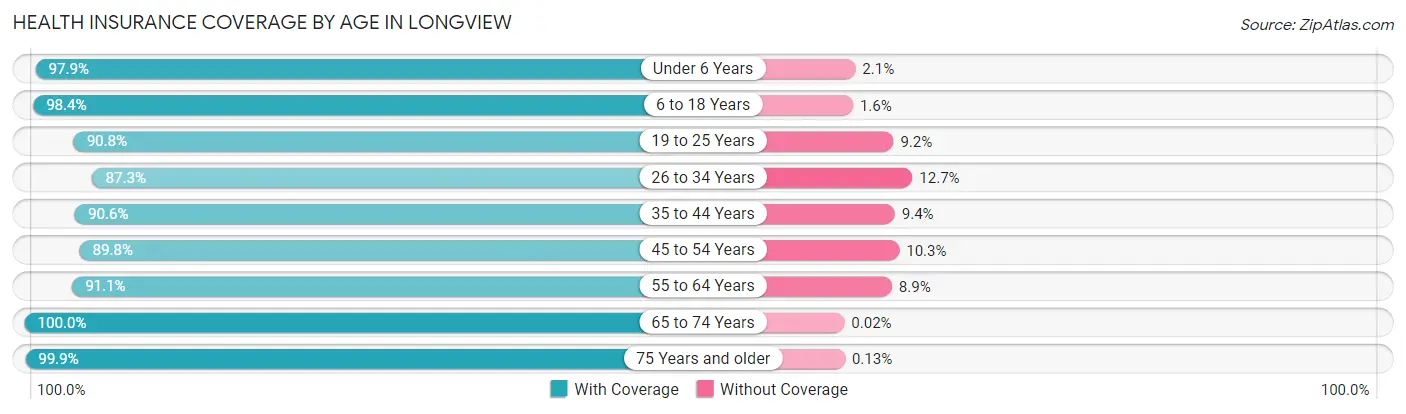
| Age Bracket | With Coverage | Without Coverage |
| Under 6 Years | 2,559 (97.9%) | 54 (2.1%) |
| 6 to 18 Years | 5,575 (98.4%) | 92 (1.6%) |
| 19 to 25 Years | 3,158 (90.8%) | 319 (9.2%) |
| 26 to 34 Years | 3,892 (87.3%) | 566 (12.7%) |
| 35 to 44 Years | 4,232 (90.6%) | 440 (9.4%) |
| 45 to 54 Years | 3,555 (89.7%) | 406 (10.2%) |
| 55 to 64 Years | 4,218 (91.1%) | 411 (8.9%) |
| 65 to 74 Years | 4,444 (100.0%) | 1 (0.0%) |
| 75 Years and older | 3,120 (99.9%) | 4 (0.1%) |
| Total | 34,753 (93.8%) | 2,293 (6.2%) |
Health Insurance Coverage by Citizenship Status in Longview

| Citizenship Status | With Coverage | Without Coverage |
| Native Born | 2,559 (97.9%) | 54 (2.1%) |
| Foreign Born, Citizen | 5,575 (98.4%) | 92 (1.6%) |
| Foreign Born, not a Citizen | 3,158 (90.8%) | 319 (9.2%) |
Health Insurance Coverage by Household Income in Longview
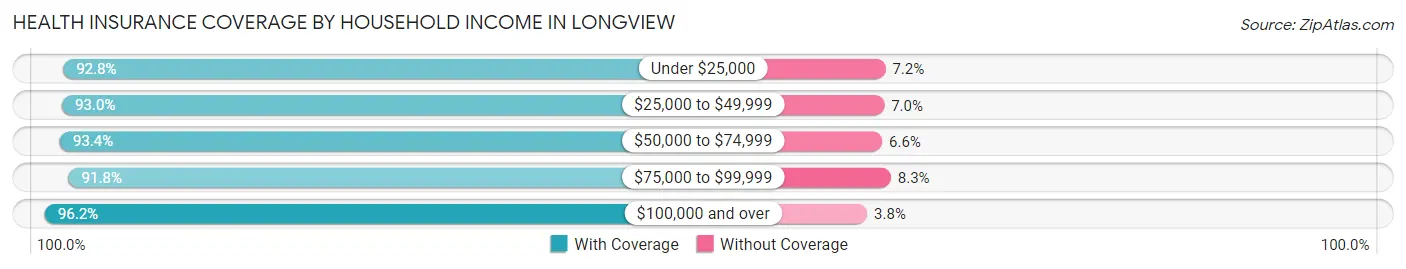
| Household Income | With Coverage | Without Coverage |
| Under $25,000 | 4,201 (92.8%) | 328 (7.2%) |
| $25,000 to $49,999 | 7,547 (93.0%) | 569 (7.0%) |
| $50,000 to $74,999 | 5,492 (93.4%) | 389 (6.6%) |
| $75,000 to $99,999 | 6,409 (91.7%) | 576 (8.3%) |
| $100,000 and over | 10,873 (96.2%) | 431 (3.8%) |
Public vs Private Health Insurance Coverage by Age in Longview
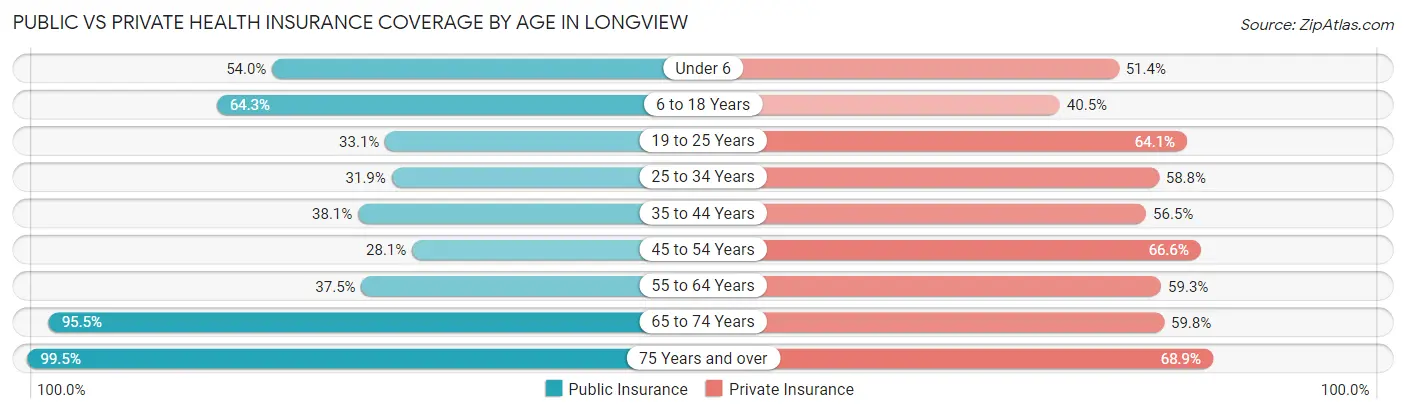
| Age Bracket | Public Insurance | Private Insurance |
| Under 6 | 1,412 (54.0%) | 1,343 (51.4%) |
| 6 to 18 Years | 3,646 (64.3%) | 2,294 (40.5%) |
| 19 to 25 Years | 1,150 (33.1%) | 2,227 (64.0%) |
| 25 to 34 Years | 1,421 (31.9%) | 2,623 (58.8%) |
| 35 to 44 Years | 1,780 (38.1%) | 2,639 (56.5%) |
| 45 to 54 Years | 1,112 (28.1%) | 2,639 (66.6%) |
| 55 to 64 Years | 1,735 (37.5%) | 2,744 (59.3%) |
| 65 to 74 Years | 4,246 (95.5%) | 2,659 (59.8%) |
| 75 Years and over | 3,107 (99.5%) | 2,151 (68.9%) |
| Total | 19,609 (52.9%) | 21,319 (57.6%) |
Disability Status by Sex by Age in Longview
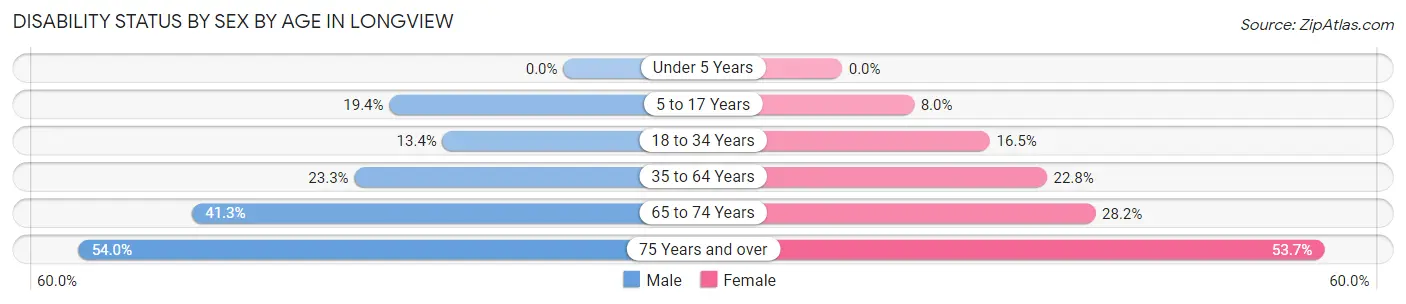
| Age Bracket | Male | Female |
| Under 5 Years | 0 (0.0%) | 0 (0.0%) |
| 5 to 17 Years | 500 (19.4%) | 237 (8.0%) |
| 18 to 34 Years | 542 (13.4%) | 716 (16.5%) |
| 35 to 64 Years | 1,554 (23.3%) | 1,501 (22.8%) |
| 65 to 74 Years | 826 (41.3%) | 690 (28.2%) |
| 75 Years and over | 653 (54.0%) | 1,028 (53.7%) |
Disability Class by Sex by Age in Longview
Disability Class: Hearing Difficulty
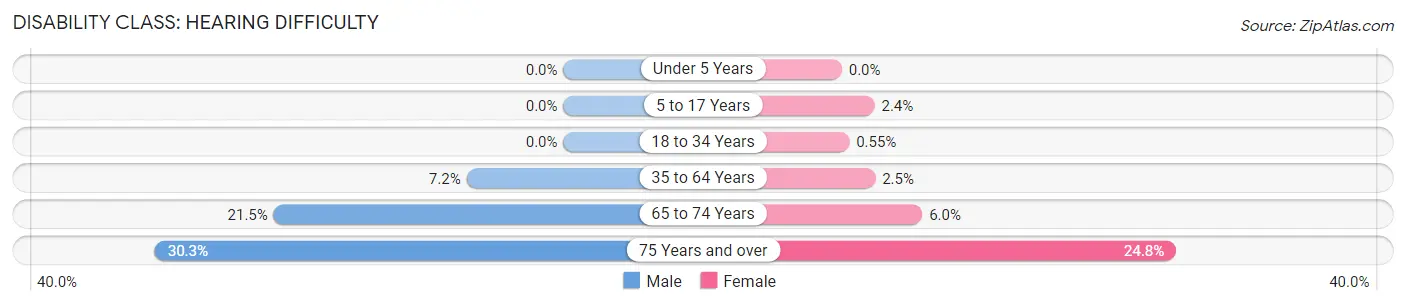
| Age Bracket | Male | Female |
| Under 5 Years | 0 (0.0%) | 0 (0.0%) |
| 5 to 17 Years | 0 (0.0%) | 72 (2.4%) |
| 18 to 34 Years | 0 (0.0%) | 24 (0.5%) |
| 35 to 64 Years | 480 (7.2%) | 163 (2.5%) |
| 65 to 74 Years | 430 (21.5%) | 146 (6.0%) |
| 75 Years and over | 367 (30.3%) | 475 (24.8%) |
Disability Class: Vision Difficulty
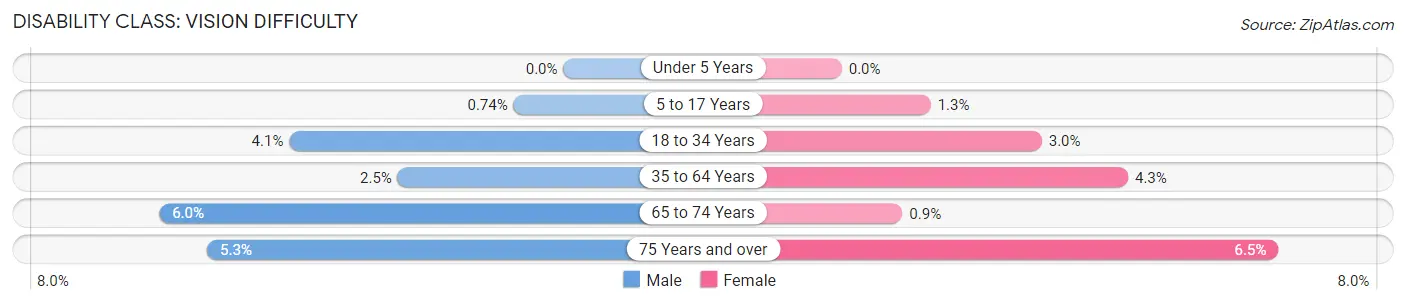
| Age Bracket | Male | Female |
| Under 5 Years | 0 (0.0%) | 0 (0.0%) |
| 5 to 17 Years | 19 (0.7%) | 39 (1.3%) |
| 18 to 34 Years | 164 (4.1%) | 129 (3.0%) |
| 35 to 64 Years | 164 (2.5%) | 280 (4.3%) |
| 65 to 74 Years | 120 (6.0%) | 22 (0.9%) |
| 75 Years and over | 64 (5.3%) | 124 (6.5%) |
Disability Class: Cognitive Difficulty
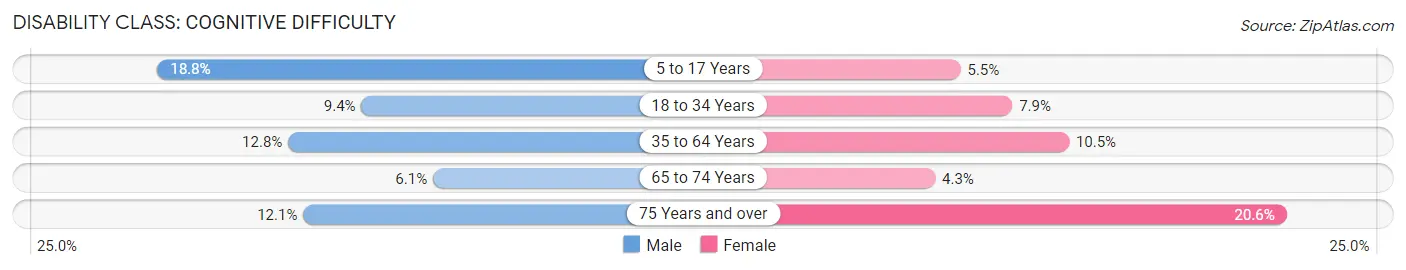
| Age Bracket | Male | Female |
| 5 to 17 Years | 486 (18.8%) | 163 (5.5%) |
| 18 to 34 Years | 378 (9.4%) | 344 (7.9%) |
| 35 to 64 Years | 853 (12.8%) | 694 (10.5%) |
| 65 to 74 Years | 121 (6.0%) | 106 (4.3%) |
| 75 Years and over | 146 (12.1%) | 395 (20.6%) |
Disability Class: Ambulatory Difficulty
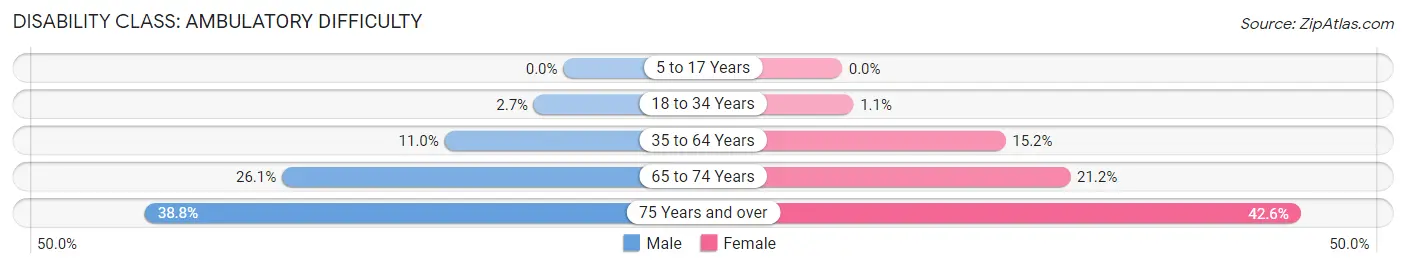
| Age Bracket | Male | Female |
| 5 to 17 Years | 0 (0.0%) | 0 (0.0%) |
| 18 to 34 Years | 110 (2.7%) | 46 (1.1%) |
| 35 to 64 Years | 736 (11.0%) | 999 (15.2%) |
| 65 to 74 Years | 522 (26.1%) | 518 (21.2%) |
| 75 Years and over | 470 (38.8%) | 815 (42.6%) |
Disability Class: Self-Care Difficulty
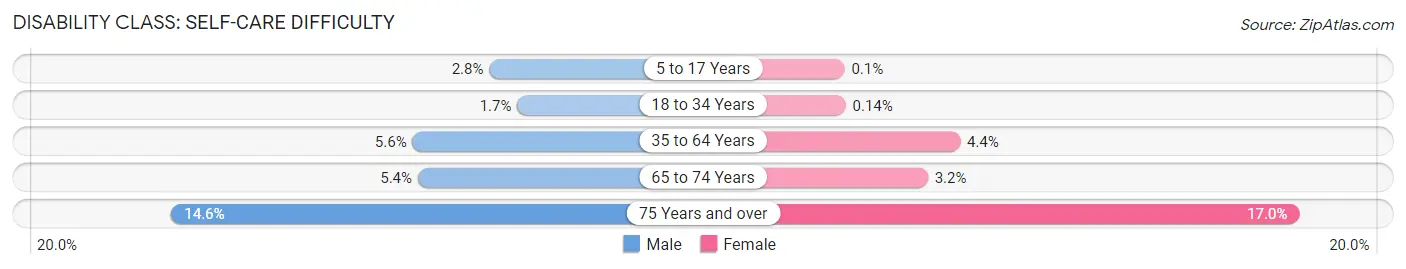
| Age Bracket | Male | Female |
| 5 to 17 Years | 71 (2.8%) | 3 (0.1%) |
| 18 to 34 Years | 69 (1.7%) | 6 (0.1%) |
| 35 to 64 Years | 374 (5.6%) | 289 (4.4%) |
| 65 to 74 Years | 108 (5.4%) | 78 (3.2%) |
| 75 Years and over | 176 (14.5%) | 325 (17.0%) |
Technology Access in Longview
Computing Device Access in Longview
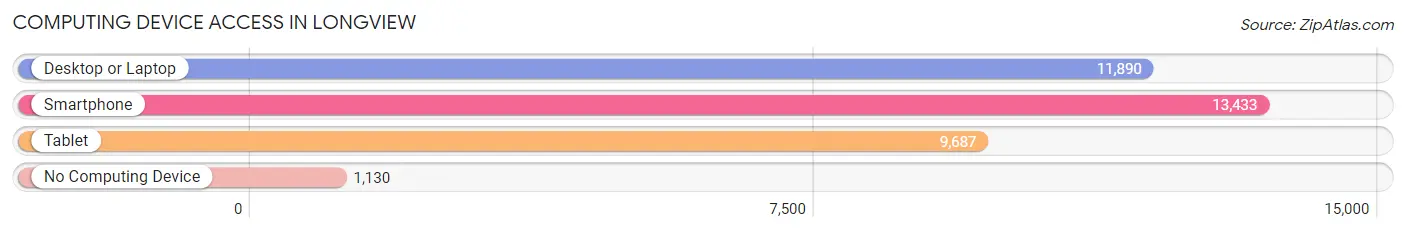
| Device Type | # Households | % Households |
| Desktop or Laptop | 11,890 | 74.2% |
| Smartphone | 13,433 | 83.8% |
| Tablet | 9,687 | 60.4% |
| No Computing Device | 1,130 | 7.0% |
| Total | 16,030 | 100.0% |
Internet Access in Longview
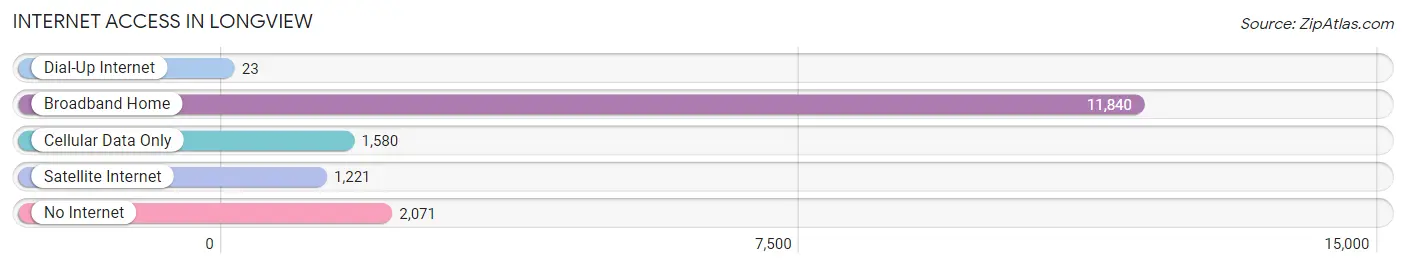
| Internet Type | # Households | % Households |
| Dial-Up Internet | 23 | 0.1% |
| Broadband Home | 11,840 | 73.9% |
| Cellular Data Only | 1,580 | 9.9% |
| Satellite Internet | 1,221 | 7.6% |
| No Internet | 2,071 | 12.9% |
| Total | 16,030 | 100.0% |
Longview Summary
Longview, Washington is a city located in Cowlitz County, Washington, United States. It is situated along the Columbia River, approximately 50 miles north of Portland, Oregon. The city has a population of approximately 36,000 people, making it the largest city in Cowlitz County.
History
Longview was founded in 1923 by Robert A. Long, a lumber baron from Kansas City, Missouri. Long envisioned the city as a major port and industrial center, and he purchased over 10,000 acres of land in the area. He built a sawmill and a railroad line to connect the city to the rest of the country. The city was incorporated in 1924, and the first mayor was elected in 1925.
The city grew rapidly in the 1920s and 1930s, and by the 1940s it was the largest city in Cowlitz County. During World War II, the city was home to a large shipbuilding industry, and it was also the site of a major aluminum plant. After the war, the city continued to grow, and by the 1970s it was home to several large industries, including a paper mill and a steel mill.
Geography
Longview is located in southwestern Washington, along the Columbia River. The city is situated at the confluence of the Cowlitz and Columbia Rivers, and it is surrounded by hills and mountains. The city has a total area of 16.3 square miles, and it is located at an elevation of approximately 200 feet.
The climate in Longview is mild and temperate, with warm summers and cool winters. The average annual temperature is around 50 degrees Fahrenheit, and the average annual precipitation is around 40 inches.
Economy
Longview’s economy is largely based on manufacturing and shipping. The city is home to several large industries, including a paper mill, a steel mill, and a shipbuilding facility. The city is also home to several large retail stores, including Walmart and Target.
The city is also home to several large employers, including Weyerhaeuser, Georgia-Pacific, and the Port of Longview. The Port of Longview is the largest port in the state of Washington, and it is a major hub for international trade.
Demographics
As of the 2010 census, the population of Longview was 36,648. The racial makeup of the city was 87.3% White, 4.2% African American, 0.7% Native American, 1.7% Asian, 0.2% Pacific Islander, and 4.9% from other races. The median household income was $41,945, and the median family income was $50,945.
Longview is home to several large religious organizations, including the Church of Jesus Christ of Latter-day Saints, the Catholic Church, and the United Methodist Church. The city is also home to several large educational institutions, including Lower Columbia College and the University of Washington-Longview.
Conclusion
Longview, Washington is a city located in Cowlitz County, Washington, United States. It is situated along the Columbia River, approximately 50 miles north of Portland, Oregon. The city has a population of approximately 36,000 people, making it the largest city in Cowlitz County. Longview was founded in 1923 by Robert A. Long, and it has since grown to become a major port and industrial center. The city’s economy is largely based on manufacturing and shipping, and it is home to several large employers, including Weyerhaeuser, Georgia-Pacific, and the Port of Longview. The city is also home to several large religious organizations, and it is home to several large educational institutions.
Common Questions
What is Per Capita Income in Longview?
Per Capita income in Longview is $34,737.
What is the Median Family Income in Longview?
Median Family Income in Longview is $76,160.
What is the Median Household income in Longview?
Median Household Income in Longview is $57,920.
What is Income or Wage Gap in Longview?
Income or Wage Gap in Longview is 22.1%.
Women in Longview earn 77.9 cents for every dollar earned by a man.
What is Family Income Deficit in Longview?
Family Income Deficit in Longview is $11,178.
Families that are below poverty line in Longview earn $11,178 less on average than the poverty threshold level.
What is Inequality or Gini Index in Longview?
Inequality or Gini Index in Longview is 0.46.
What is the Total Population of Longview?
Total Population of Longview is 37,722.
What is the Total Male Population of Longview?
Total Male Population of Longview is 18,042.
What is the Total Female Population of Longview?
Total Female Population of Longview is 19,680.
What is the Ratio of Males per 100 Females in Longview?
There are 91.68 Males per 100 Females in Longview.
What is the Ratio of Females per 100 Males in Longview?
There are 109.08 Females per 100 Males in Longview.
What is the Median Population Age in Longview?
Median Population Age in Longview is 39.9 Years.
What is the Average Family Size in Longview
Average Family Size in Longview is 3.0 People.
What is the Average Household Size in Longview
Average Household Size in Longview is 2.3 People.
How Large is the Labor Force in Longview?
There are 17,327 People in the Labor Forcein in Longview.
What is the Percentage of People in the Labor Force in Longview?
56.2% of People are in the Labor Force in Longview.
What is the Unemployment Rate in Longview?
Unemployment Rate in Longview is 4.5%.