Cities with the Lowest Unemployment Rate Amomg Seniors Over the Age of 65 in New York
RELATED REPORTS & OPTIONS
Lowest Unemployment | Senior > 65
New York
Compare Cities
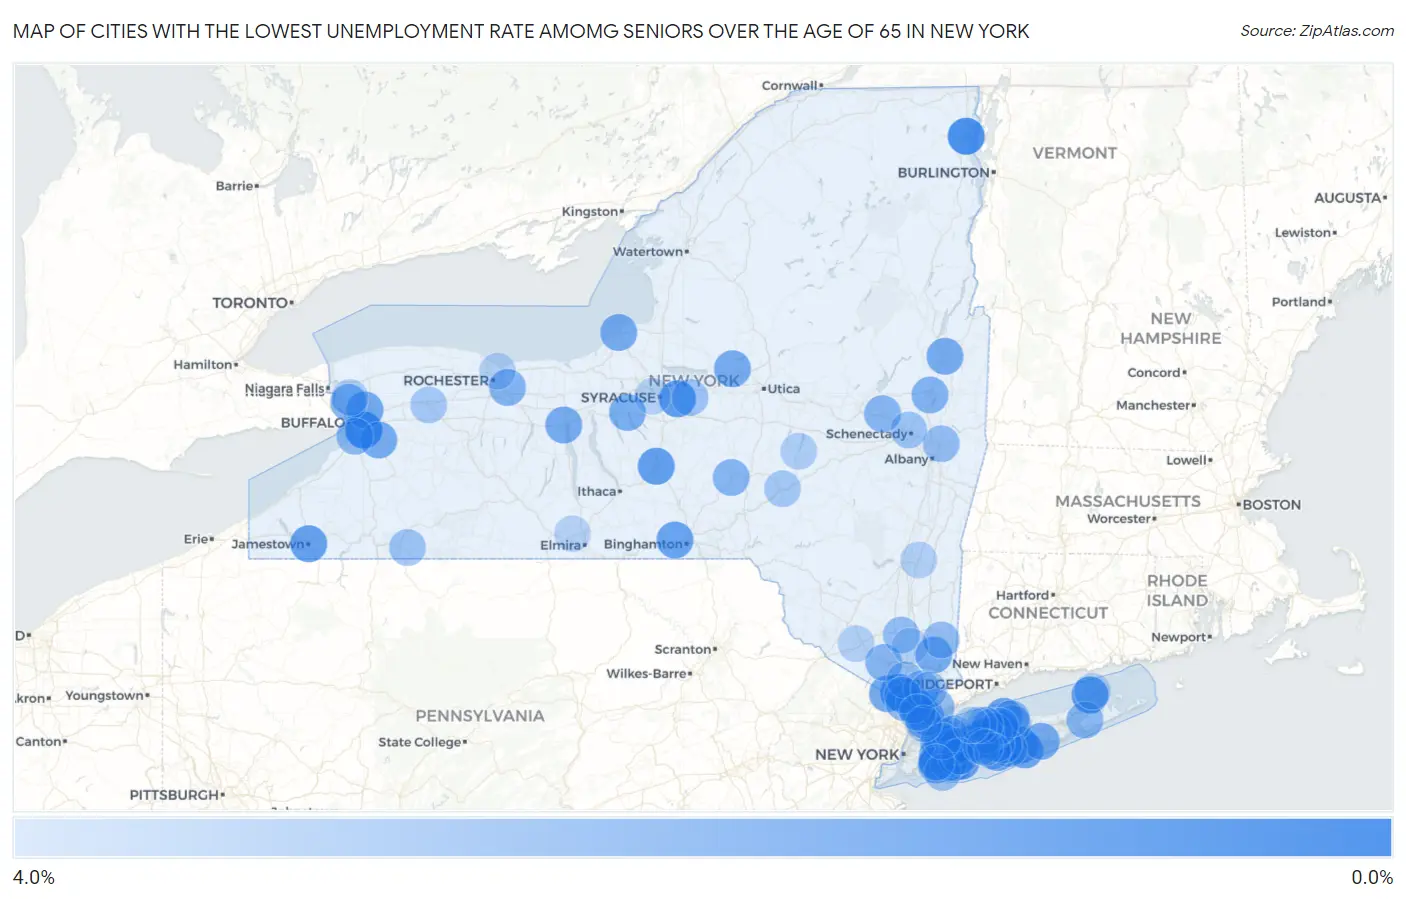
Map of Cities with the Lowest Unemployment Rate Amomg Seniors Over the Age of 65 in New York
4.0%
0.0%
Cities with the Lowest Unemployment Rate Amomg Seniors Over the Age of 65 in New York
| City | Senior Unemployment | vs State | vs National | |
| 1. | North Hills | 0.10% | 4.6%(-4.50)#1 | 3.9%(-3.80)#7 |
| 2. | West Seneca | 0.50% | 4.6%(-4.10)#2 | 3.9%(-3.40)#53 |
| 3. | Plattsburgh | 0.50% | 4.6%(-4.10)#3 | 3.9%(-3.40)#65 |
| 4. | Westbury | 0.50% | 4.6%(-4.10)#4 | 3.9%(-3.40)#69 |
| 5. | Dix Hills | 0.60% | 4.6%(-4.00)#5 | 3.9%(-3.30)#88 |
| 6. | Spring Valley | 0.90% | 4.6%(-3.70)#6 | 3.9%(-3.00)#164 |
| 7. | Melville | 0.90% | 4.6%(-3.70)#7 | 3.9%(-3.00)#178 |
| 8. | Fayetteville | 1.0% | 4.6%(-3.60)#8 | 3.9%(-2.90)#230 |
| 9. | Greenport | 1.0% | 4.6%(-3.60)#9 | 3.9%(-2.90)#235 |
| 10. | Valley Stream | 1.1% | 4.6%(-3.50)#10 | 3.9%(-2.80)#248 |
| 11. | East Patchogue | 1.1% | 4.6%(-3.50)#11 | 3.9%(-2.80)#261 |
| 12. | Cortland | 1.1% | 4.6%(-3.50)#12 | 3.9%(-2.80)#267 |
| 13. | Jamestown | 1.2% | 4.6%(-3.40)#13 | 3.9%(-2.70)#294 |
| 14. | Lake Ronkonkoma | 1.2% | 4.6%(-3.40)#14 | 3.9%(-2.70)#307 |
| 15. | Merrick | 1.3% | 4.6%(-3.30)#15 | 3.9%(-2.60)#361 |
| 16. | Kings Park | 1.3% | 4.6%(-3.30)#16 | 3.9%(-2.60)#368 |
| 17. | Seaford | 1.3% | 4.6%(-3.30)#17 | 3.9%(-2.60)#370 |
| 18. | Endwell | 1.3% | 4.6%(-3.30)#18 | 3.9%(-2.60)#376 |
| 19. | Port Washington | 1.4% | 4.6%(-3.20)#19 | 3.9%(-2.50)#408 |
| 20. | East Islip | 1.4% | 4.6%(-3.20)#20 | 3.9%(-2.50)#415 |
| 21. | Dobbs Ferry | 1.4% | 4.6%(-3.20)#21 | 3.9%(-2.50)#418 |
| 22. | Bellport | 1.4% | 4.6%(-3.20)#22 | 3.9%(-2.50)#432 |
| 23. | Old Field | 1.4% | 4.6%(-3.20)#23 | 3.9%(-2.50)#434 |
| 24. | St James | 1.5% | 4.6%(-3.10)#24 | 3.9%(-2.40)#471 |
| 25. | Suffern | 1.5% | 4.6%(-3.10)#25 | 3.9%(-2.40)#473 |
| 26. | Williamsville | 1.5% | 4.6%(-3.10)#26 | 3.9%(-2.40)#481 |
| 27. | Rome | 1.6% | 4.6%(-3.00)#27 | 3.9%(-2.30)#500 |
| 28. | Oswego | 1.6% | 4.6%(-3.00)#28 | 3.9%(-2.30)#517 |
| 29. | Glens Falls | 1.6% | 4.6%(-3.00)#29 | 3.9%(-2.30)#523 |
| 30. | Geneva | 1.6% | 4.6%(-3.00)#30 | 3.9%(-2.30)#526 |
| 31. | Mahopac | 1.6% | 4.6%(-3.00)#31 | 3.9%(-2.30)#533 |
| 32. | Center Moriches | 1.6% | 4.6%(-3.00)#32 | 3.9%(-2.30)#534 |
| 33. | East Aurora | 1.6% | 4.6%(-3.00)#33 | 3.9%(-2.30)#539 |
| 34. | Terryville | 1.7% | 4.6%(-2.90)#34 | 3.9%(-2.20)#585 |
| 35. | Bronxville | 1.7% | 4.6%(-2.90)#35 | 3.9%(-2.20)#594 |
| 36. | Skaneateles | 1.7% | 4.6%(-2.90)#36 | 3.9%(-2.20)#597 |
| 37. | Tonawanda | 1.8% | 4.6%(-2.80)#37 | 3.9%(-2.10)#615 |
| 38. | Sayville | 1.8% | 4.6%(-2.80)#38 | 3.9%(-2.10)#641 |
| 39. | Manhasset | 1.8% | 4.6%(-2.80)#39 | 3.9%(-2.10)#659 |
| 40. | Roslyn Heights | 1.8% | 4.6%(-2.80)#40 | 3.9%(-2.10)#662 |
| 41. | Elmont | 1.9% | 4.6%(-2.70)#41 | 3.9%(-2.00)#685 |
| 42. | Saratoga Springs | 1.9% | 4.6%(-2.70)#42 | 3.9%(-2.00)#689 |
| 43. | Woodmere | 1.9% | 4.6%(-2.70)#43 | 3.9%(-2.00)#697 |
| 44. | Bohemia | 1.9% | 4.6%(-2.70)#44 | 3.9%(-2.00)#709 |
| 45. | East Rochester | 1.9% | 4.6%(-2.70)#45 | 3.9%(-2.00)#716 |
| 46. | Old Brookville | 1.9% | 4.6%(-2.70)#46 | 3.9%(-2.00)#727 |
| 47. | Central Islip | 2.0% | 4.6%(-2.60)#47 | 3.9%(-1.90)#744 |
| 48. | Harrison | 2.0% | 4.6%(-2.60)#48 | 3.9%(-1.90)#751 |
| 49. | Roosevelt | 2.0% | 4.6%(-2.60)#49 | 3.9%(-1.90)#763 |
| 50. | Amsterdam | 2.0% | 4.6%(-2.60)#50 | 3.9%(-1.90)#766 |
| 51. | Monroe | 2.0% | 4.6%(-2.60)#51 | 3.9%(-1.90)#781 |
| 52. | Norwich | 2.0% | 4.6%(-2.60)#52 | 3.9%(-1.90)#785 |
| 53. | Baldwin | 2.1% | 4.6%(-2.50)#53 | 3.9%(-1.80)#810 |
| 54. | Eastchester | 2.1% | 4.6%(-2.50)#54 | 3.9%(-1.80)#822 |
| 55. | Pearl River | 2.1% | 4.6%(-2.50)#55 | 3.9%(-1.80)#829 |
| 56. | New Cassel | 2.1% | 4.6%(-2.50)#56 | 3.9%(-1.80)#830 |
| 57. | Port Jefferson | 2.1% | 4.6%(-2.50)#57 | 3.9%(-1.80)#839 |
| 58. | North Sea | 2.1% | 4.6%(-2.50)#58 | 3.9%(-1.80)#843 |
| 59. | Blasdell | 2.1% | 4.6%(-2.50)#59 | 3.9%(-1.80)#853 |
| 60. | Piermont | 2.1% | 4.6%(-2.50)#60 | 3.9%(-1.80)#854 |
| 61. | Smithtown | 2.2% | 4.6%(-2.40)#61 | 3.9%(-1.70)#885 |
| 62. | Troy | 2.3% | 4.6%(-2.30)#62 | 3.9%(-1.60)#944 |
| 63. | Hicksville | 2.3% | 4.6%(-2.30)#63 | 3.9%(-1.60)#946 |
| 64. | Newburgh | 2.3% | 4.6%(-2.30)#64 | 3.9%(-1.60)#952 |
| 65. | West Haverstraw | 2.3% | 4.6%(-2.30)#65 | 3.9%(-1.60)#976 |
| 66. | Lake Carmel | 2.3% | 4.6%(-2.30)#66 | 3.9%(-1.60)#981 |
| 67. | North Bellmore | 2.4% | 4.6%(-2.20)#67 | 3.9%(-1.50)#1,036 |
| 68. | Briarcliff Manor | 2.4% | 4.6%(-2.20)#68 | 3.9%(-1.50)#1,068 |
| 69. | Commack | 2.5% | 4.6%(-2.10)#69 | 3.9%(-1.40)#1,105 |
| 70. | Long Beach | 2.5% | 4.6%(-2.10)#70 | 3.9%(-1.40)#1,106 |
| 71. | De Witt | 2.5% | 4.6%(-2.10)#71 | 3.9%(-1.40)#1,124 |
| 72. | Scotia | 2.5% | 4.6%(-2.10)#72 | 3.9%(-1.40)#1,134 |
| 73. | Chittenango | 2.5% | 4.6%(-2.10)#73 | 3.9%(-1.40)#1,138 |
| 74. | Upper Brookville | 2.5% | 4.6%(-2.10)#74 | 3.9%(-1.40)#1,146 |
| 75. | Weston Mills | 2.5% | 4.6%(-2.10)#75 | 3.9%(-1.40)#1,150 |
| 76. | North Wantagh | 2.6% | 4.6%(-2.00)#76 | 3.9%(-1.30)#1,196 |
| 77. | Nanuet | 2.7% | 4.6%(-1.90)#77 | 3.9%(-1.20)#1,252 |
| 78. | Batavia | 2.7% | 4.6%(-1.90)#78 | 3.9%(-1.20)#1,260 |
| 79. | Oneonta | 2.7% | 4.6%(-1.90)#79 | 3.9%(-1.20)#1,264 |
| 80. | Pleasantville | 2.7% | 4.6%(-1.90)#80 | 3.9%(-1.20)#1,276 |
| 81. | Head Of The Harbor | 2.7% | 4.6%(-1.90)#81 | 3.9%(-1.20)#1,288 |
| 82. | Roslyn Estates | 2.7% | 4.6%(-1.90)#82 | 3.9%(-1.20)#1,289 |
| 83. | Mount Vernon | 2.8% | 4.6%(-1.80)#83 | 3.9%(-1.10)#1,305 |
| 84. | Fort Salonga | 2.8% | 4.6%(-1.80)#84 | 3.9%(-1.10)#1,342 |
| 85. | North Tonawanda | 2.9% | 4.6%(-1.70)#85 | 3.9%(-1.00)#1,396 |
| 86. | Deer Park | 2.9% | 4.6%(-1.70)#86 | 3.9%(-1.00)#1,401 |
| 87. | Hastings On Hudson | 2.9% | 4.6%(-1.70)#87 | 3.9%(-1.00)#1,425 |
| 88. | Cooperstown | 2.9% | 4.6%(-1.70)#88 | 3.9%(-1.00)#1,441 |
| 89. | Irondequoit | 3.0% | 4.6%(-1.60)#89 | 3.9%(-0.900)#1,463 |
| 90. | Middletown | 3.0% | 4.6%(-1.60)#90 | 3.9%(-0.900)#1,472 |
| 91. | Islip | 3.0% | 4.6%(-1.60)#91 | 3.9%(-0.900)#1,489 |
| 92. | Northport | 3.0% | 4.6%(-1.60)#92 | 3.9%(-0.900)#1,507 |
| 93. | Baywood | 3.0% | 4.6%(-1.60)#93 | 3.9%(-0.900)#1,508 |
| 94. | South Valley Stream | 3.0% | 4.6%(-1.60)#94 | 3.9%(-0.900)#1,510 |
| 95. | Red Hook | 3.0% | 4.6%(-1.60)#95 | 3.9%(-0.900)#1,520 |
| 96. | East Marion | 3.0% | 4.6%(-1.60)#96 | 3.9%(-0.900)#1,523 |
| 97. | Solvay | 3.1% | 4.6%(-1.50)#97 | 3.9%(-0.800)#1,591 |
| 98. | Big Flats | 3.1% | 4.6%(-1.50)#98 | 3.9%(-0.800)#1,594 |
| 99. | Huntington Bay | 3.1% | 4.6%(-1.50)#99 | 3.9%(-0.800)#1,603 |
| 100. | Nelsonville | 3.1% | 4.6%(-1.50)#100 | 3.9%(-0.800)#1,612 |
Common Questions
What are the Top 10 Cities with the Lowest Unemployment Rate Amomg Seniors Over the Age of 65 in New York?
Top 10 Cities with the Lowest Unemployment Rate Amomg Seniors Over the Age of 65 in New York are:
#1
0.10%
#2
0.50%
#3
0.50%
#4
0.50%
#5
0.60%
#6
0.90%
#7
0.90%
#8
1.0%
#9
1.0%
#10
1.1%
What city has the Lowest Unemployment Rate Amomg Seniors Over the Age of 65 in New York?
North Hills has the Lowest Unemployment Rate Amomg Seniors Over the Age of 65 in New York with 0.10%.
What is the Unemployment Rate Amomg Seniors Over the Age of 65 in the State of New York?
Unemployment Rate Amomg Seniors Over the Age of 65 in New York is 4.6%.
What is the Unemployment Rate Amomg Seniors Over the Age of 65 in the United States?
Unemployment Rate Amomg Seniors Over the Age of 65 in the United States is 3.9%.