Vancouver, WA Map & Demographics
Vancouver Map
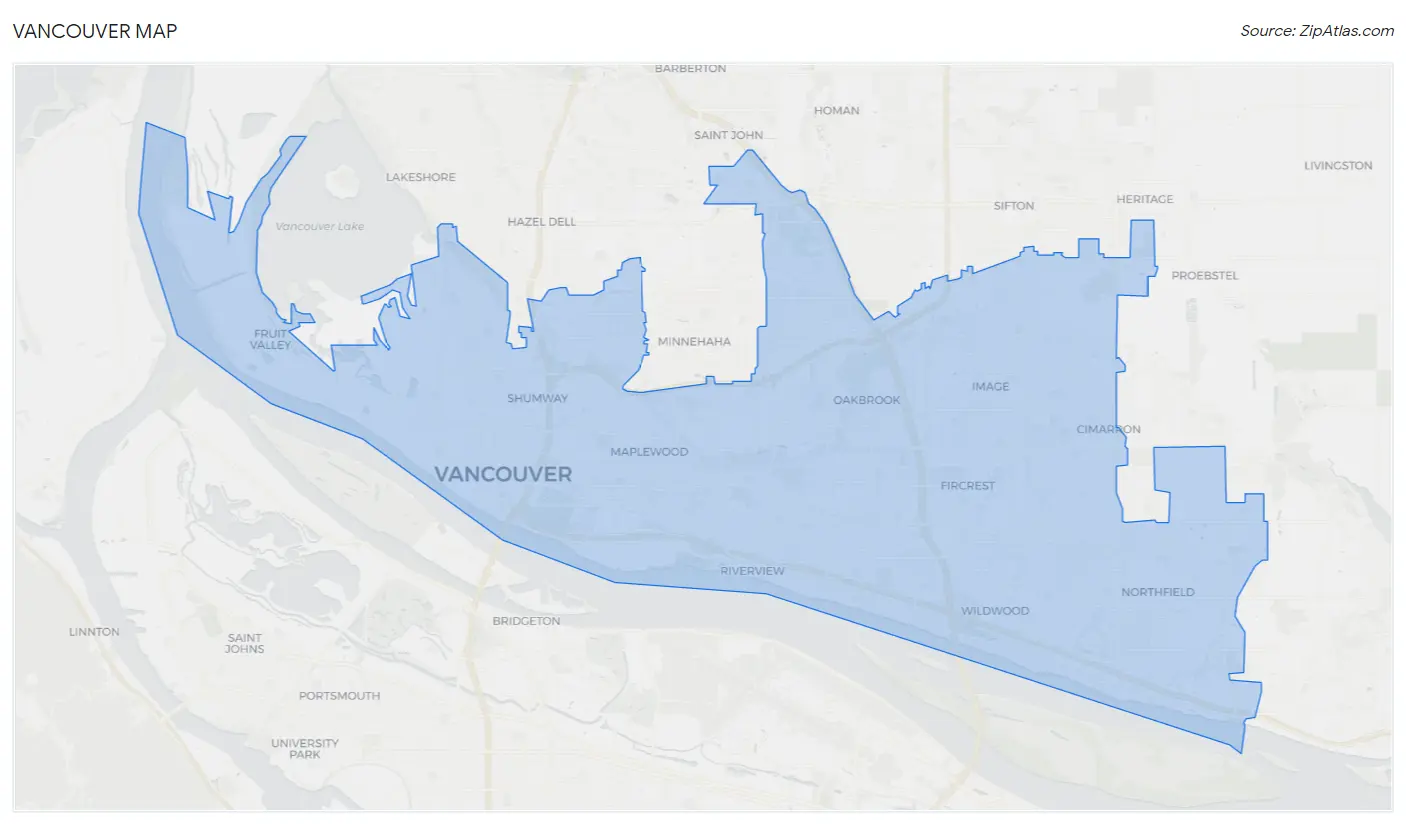
Vancouver Overview
$40,219
PER CAPITA INCOME
$86,704
AVG FAMILY INCOME
$73,626
AVG HOUSEHOLD INCOME
27.4%
WAGE / INCOME GAP [ % ]
72.6¢/ $1
WAGE / INCOME GAP [ $ ]
$10,575
FAMILY INCOME DEFICIT
0.44
INEQUALITY / GINI INDEX
190,700
TOTAL POPULATION
94,176
MALE POPULATION
96,524
FEMALE POPULATION
97.57
MALES / 100 FEMALES
102.49
FEMALES / 100 MALES
37.4
MEDIAN AGE
3.1
AVG FAMILY SIZE
2.4
AVG HOUSEHOLD SIZE
99,811
LABOR FORCE [ PEOPLE ]
64.9%
PERCENT IN LABOR FORCE
5.6%
UNEMPLOYMENT RATE
Vancouver Area Codes
Income in Vancouver
Income Overview in Vancouver
Per Capita Income in Vancouver is $40,219, while median incomes of families and households are $86,704 and $73,626 respectively.
| Characteristic | Number | Measure |
| Per Capita Income | 190,700 | $40,219 |
| Median Family Income | 45,316 | $86,704 |
| Mean Family Income | 45,316 | $111,232 |
| Median Household Income | 77,418 | $73,626 |
| Mean Household Income | 77,418 | $96,115 |
| Income Deficit | 45,316 | $10,575 |
| Wage / Income Gap (%) | 190,700 | 27.38% |
| Wage / Income Gap ($) | 190,700 | 72.62¢ per $1 |
| Gini / Inequality Index | 190,700 | 0.44 |
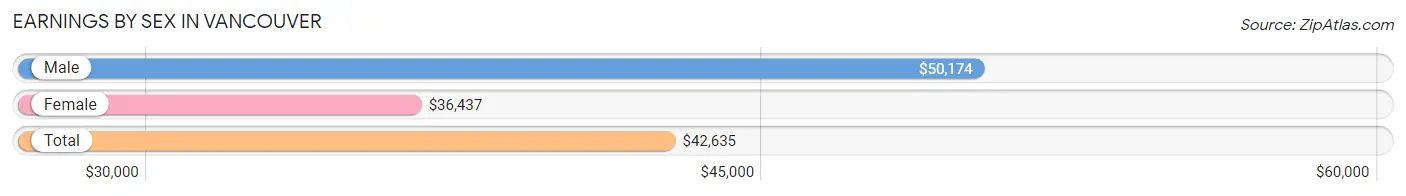
Earnings by Sex in Vancouver
Average Earnings in Vancouver are $42,635, $50,174 for men and $36,437 for women, a difference of 27.4%.
| Sex | Number | Average Earnings |
| Male | 54,388 (52.6%) | $50,174 |
| Female | 49,010 (47.4%) | $36,437 |
| Total | 103,398 (100.0%) | $42,635 |
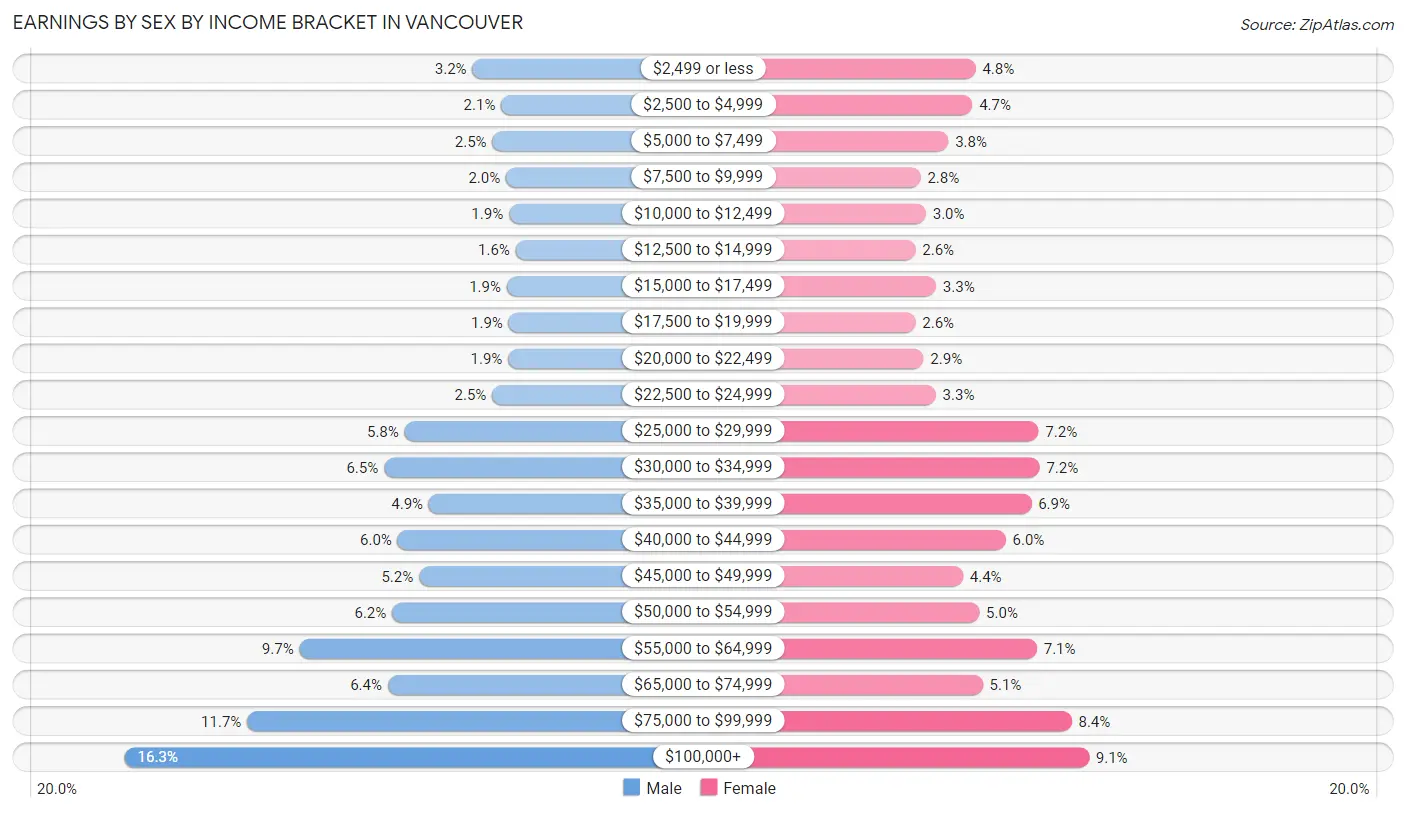
Earnings by Sex by Income Bracket in Vancouver
The most common earnings brackets in Vancouver are $100,000+ for men (8,837 | 16.3%) and $100,000+ for women (4,447 | 9.1%).
| Income | Male | Female |
| $2,499 or less | 1,749 (3.2%) | 2,363 (4.8%) |
| $2,500 to $4,999 | 1,163 (2.1%) | 2,305 (4.7%) |
| $5,000 to $7,499 | 1,341 (2.5%) | 1,863 (3.8%) |
| $7,500 to $9,999 | 1,068 (2.0%) | 1,353 (2.8%) |
| $10,000 to $12,499 | 1,007 (1.8%) | 1,451 (3.0%) |
| $12,500 to $14,999 | 872 (1.6%) | 1,258 (2.6%) |
| $15,000 to $17,499 | 1,050 (1.9%) | 1,638 (3.3%) |
| $17,500 to $19,999 | 1,014 (1.9%) | 1,258 (2.6%) |
| $20,000 to $22,499 | 1,023 (1.9%) | 1,409 (2.9%) |
| $22,500 to $24,999 | 1,351 (2.5%) | 1,630 (3.3%) |
| $25,000 to $29,999 | 3,131 (5.8%) | 3,521 (7.2%) |
| $30,000 to $34,999 | 3,552 (6.5%) | 3,538 (7.2%) |
| $35,000 to $39,999 | 2,640 (4.9%) | 3,386 (6.9%) |
| $40,000 to $44,999 | 3,275 (6.0%) | 2,917 (5.9%) |
| $45,000 to $49,999 | 2,837 (5.2%) | 2,132 (4.3%) |
| $50,000 to $54,999 | 3,388 (6.2%) | 2,429 (5.0%) |
| $55,000 to $64,999 | 5,273 (9.7%) | 3,490 (7.1%) |
| $65,000 to $74,999 | 3,476 (6.4%) | 2,495 (5.1%) |
| $75,000 to $99,999 | 6,341 (11.7%) | 4,127 (8.4%) |
| $100,000+ | 8,837 (16.3%) | 4,447 (9.1%) |
| Total | 54,388 (100.0%) | 49,010 (100.0%) |
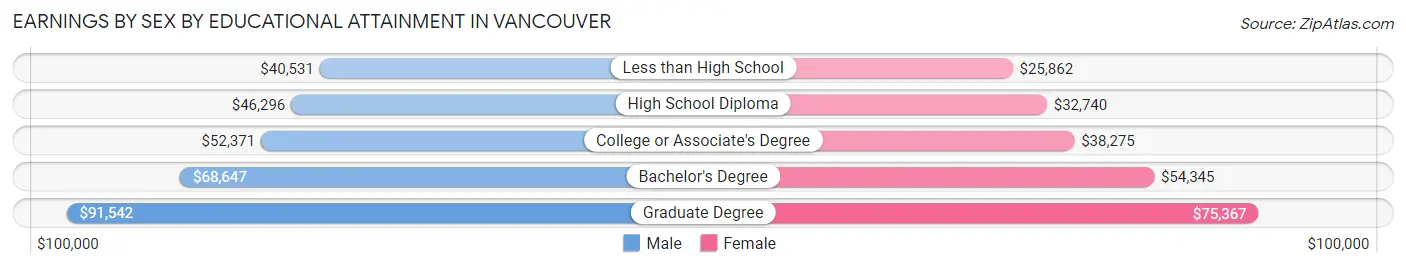
Earnings by Sex by Educational Attainment in Vancouver
Average earnings in Vancouver are $54,434 for men and $40,579 for women, a difference of 25.5%. Men with an educational attainment of graduate degree enjoy the highest average annual earnings of $91,542, while those with less than high school education earn the least with $40,531. Women with an educational attainment of graduate degree earn the most with the average annual earnings of $75,367, while those with less than high school education have the smallest earnings of $25,862.
| Educational Attainment | Male Income | Female Income |
| Less than High School | $40,531 | $25,862 |
| High School Diploma | $46,296 | $32,740 |
| College or Associate's Degree | $52,371 | $38,275 |
| Bachelor's Degree | $68,647 | $54,345 |
| Graduate Degree | $91,542 | $75,367 |
| Total | $54,434 | $40,579 |
Family Income in Vancouver
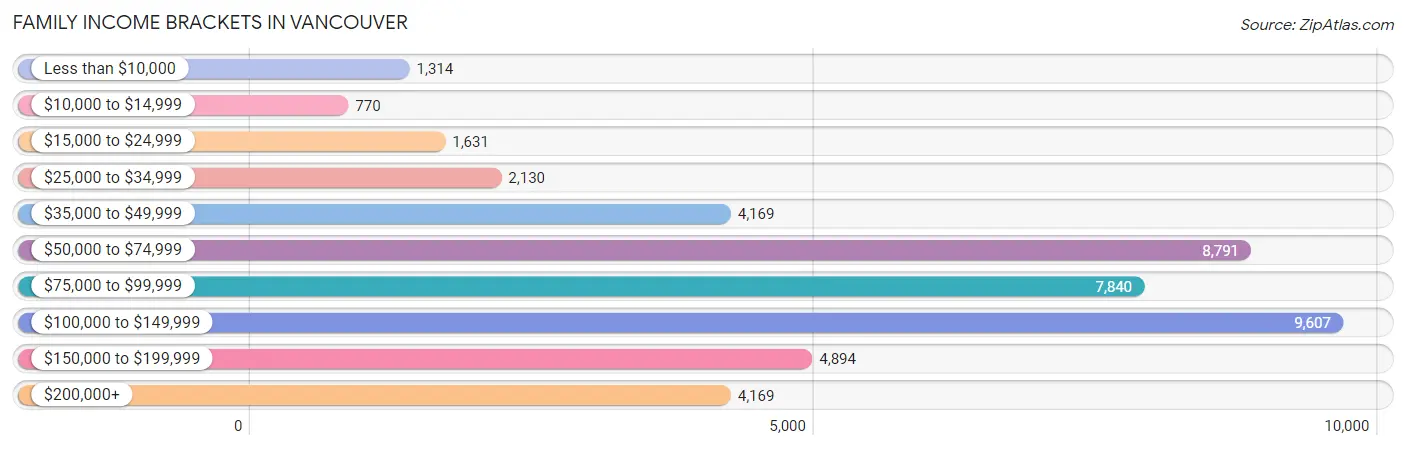
Family Income Brackets in Vancouver
According to the Vancouver family income data, there are 9,607 families falling into the $100,000 to $149,999 income range, which is the most common income bracket and makes up 21.2% of all families. Conversely, the $10,000 to $14,999 income bracket is the least frequent group with only 770 families (1.7%) belonging to this category.
| Income Bracket | # Families | % Families |
| Less than $10,000 | 1,314 | 2.9% |
| $10,000 to $14,999 | 770 | 1.7% |
| $15,000 to $24,999 | 1,631 | 3.6% |
| $25,000 to $34,999 | 2,130 | 4.7% |
| $35,000 to $49,999 | 4,169 | 9.2% |
| $50,000 to $74,999 | 8,791 | 19.4% |
| $75,000 to $99,999 | 7,840 | 17.3% |
| $100,000 to $149,999 | 9,607 | 21.2% |
| $150,000 to $199,999 | 4,894 | 10.8% |
| $200,000+ | 4,169 | 9.2% |
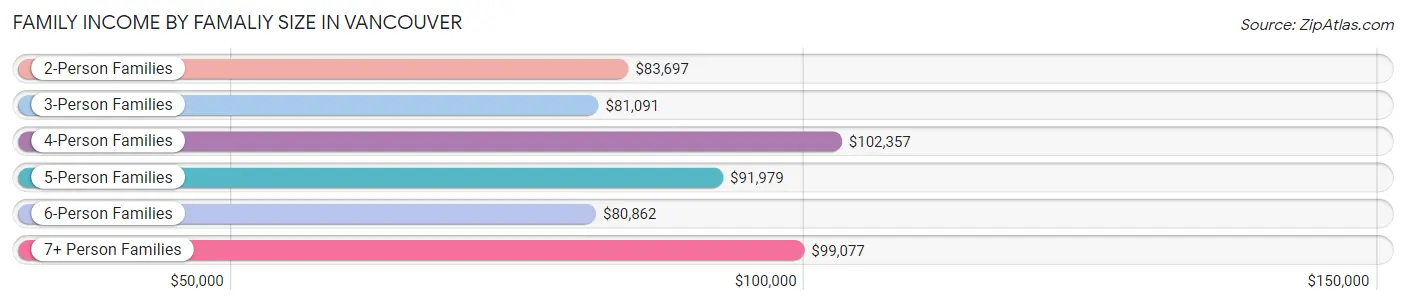
Family Income by Famaliy Size in Vancouver
4-person families (7,389 | 16.3%) account for the highest median family income in Vancouver with $102,357 per family, while 2-person families (22,405 | 49.4%) have the highest median income of $41,848 per family member.
| Income Bracket | # Families | Median Income |
| 2-Person Families | 22,405 (49.4%) | $83,697 |
| 3-Person Families | 10,088 (22.3%) | $81,091 |
| 4-Person Families | 7,389 (16.3%) | $102,357 |
| 5-Person Families | 3,247 (7.2%) | $91,979 |
| 6-Person Families | 1,336 (2.9%) | $80,862 |
| 7+ Person Families | 851 (1.9%) | $99,077 |
| Total | 45,316 (100.0%) | $86,704 |
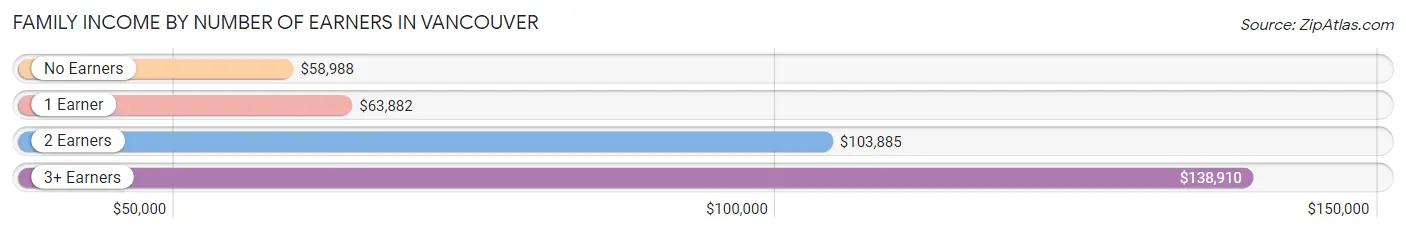
Family Income by Number of Earners in Vancouver
The median family income in Vancouver is $86,704, with families comprising 3+ earners (4,328) having the highest median family income of $138,910, while families with no earners (6,776) have the lowest median family income of $58,988, accounting for 9.6% and 14.9% of families, respectively.
| Number of Earners | # Families | Median Income |
| No Earners | 6,776 (14.9%) | $58,988 |
| 1 Earner | 15,296 (33.8%) | $63,882 |
| 2 Earners | 18,916 (41.7%) | $103,885 |
| 3+ Earners | 4,328 (9.6%) | $138,910 |
| Total | 45,316 (100.0%) | $86,704 |
Household Income in Vancouver
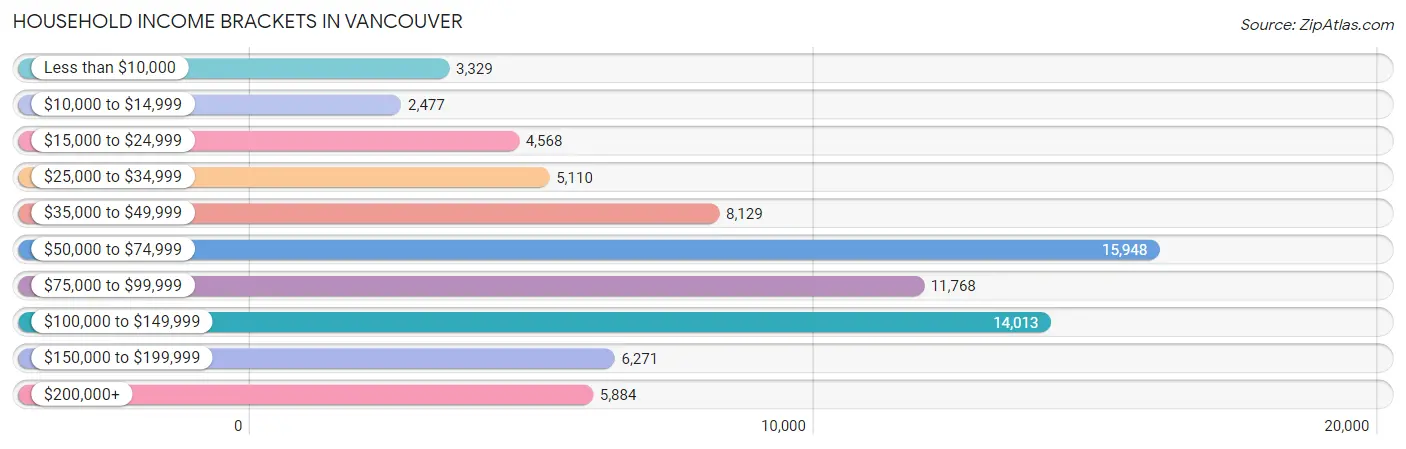
Household Income Brackets in Vancouver
With 15,948 households falling in the category, the $50,000 to $74,999 income range is the most frequent in Vancouver, accounting for 20.6% of all households. In contrast, only 2,477 households (3.2%) fall into the $10,000 to $14,999 income bracket, making it the least populous group.
| Income Bracket | # Households | % Households |
| Less than $10,000 | 3,329 | 4.3% |
| $10,000 to $14,999 | 2,477 | 3.2% |
| $15,000 to $24,999 | 4,568 | 5.9% |
| $25,000 to $34,999 | 5,110 | 6.6% |
| $35,000 to $49,999 | 8,129 | 10.5% |
| $50,000 to $74,999 | 15,948 | 20.6% |
| $75,000 to $99,999 | 11,768 | 15.2% |
| $100,000 to $149,999 | 14,013 | 18.1% |
| $150,000 to $199,999 | 6,271 | 8.1% |
| $200,000+ | 5,884 | 7.6% |
Household Income by Householder Age in Vancouver
The median household income in Vancouver is $73,626, with the highest median household income of $86,525 found in the 45 to 64 years age bracket for the primary householder. A total of 26,500 households (34.2%) fall into this category. Meanwhile, the 15 to 24 years age bracket for the primary householder has the lowest median household income of $54,593, with 4,037 households (5.2%) in this group.
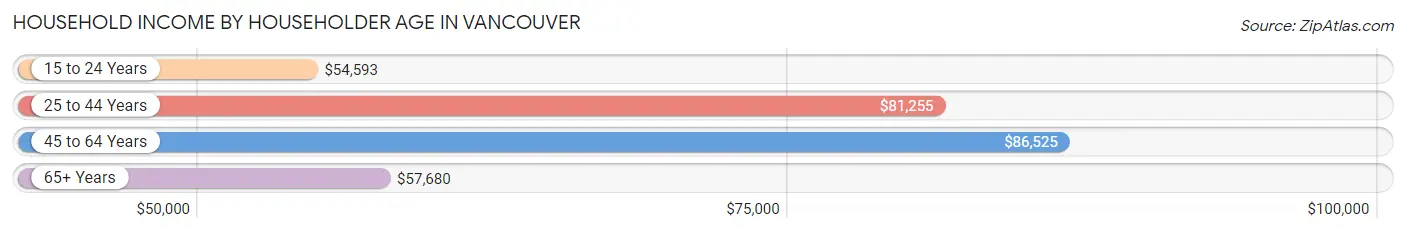
| Income Bracket | # Households | Median Income |
| 15 to 24 Years | 4,037 (5.2%) | $54,593 |
| 25 to 44 Years | 26,877 (34.7%) | $81,255 |
| 45 to 64 Years | 26,500 (34.2%) | $86,525 |
| 65+ Years | 20,004 (25.8%) | $57,680 |
| Total | 77,418 (100.0%) | $73,626 |
Poverty in Vancouver
Income Below Poverty by Sex and Age in Vancouver
With 11.4% poverty level for males and 13.3% for females among the residents of Vancouver, 5 year old males and 5 year old females are the most vulnerable to poverty, with 359 males (30.7%) and 343 females (30.8%) in their respective age groups living below the poverty level.
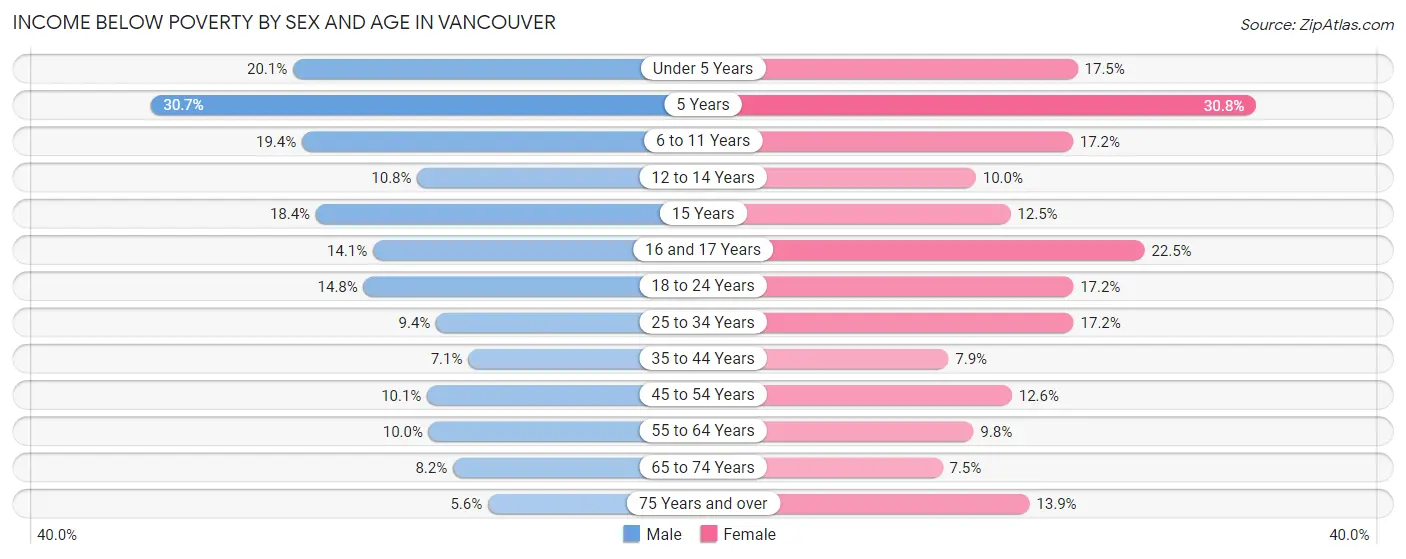
| Age Bracket | Male | Female |
| Under 5 Years | 1,215 (20.1%) | 798 (17.5%) |
| 5 Years | 359 (30.7%) | 343 (30.8%) |
| 6 to 11 Years | 1,299 (19.4%) | 1,184 (17.2%) |
| 12 to 14 Years | 422 (10.8%) | 306 (10.0%) |
| 15 Years | 244 (18.4%) | 146 (12.5%) |
| 16 and 17 Years | 233 (14.1%) | 564 (22.5%) |
| 18 to 24 Years | 1,223 (14.8%) | 1,524 (17.2%) |
| 25 to 34 Years | 1,457 (9.4%) | 2,478 (17.2%) |
| 35 to 44 Years | 905 (7.1%) | 1,029 (7.9%) |
| 45 to 54 Years | 1,168 (10.1%) | 1,393 (12.6%) |
| 55 to 64 Years | 1,106 (10.0%) | 1,135 (9.8%) |
| 65 to 74 Years | 679 (8.2%) | 733 (7.5%) |
| 75 Years and over | 267 (5.6%) | 1,030 (13.9%) |
| Total | 10,577 (11.4%) | 12,663 (13.3%) |
Income Above Poverty by Sex and Age in Vancouver
According to the poverty statistics in Vancouver, males aged 75 years and over and females aged 65 to 74 years are the age groups that are most secure financially, with 94.4% of males and 92.5% of females in these age groups living above the poverty line.
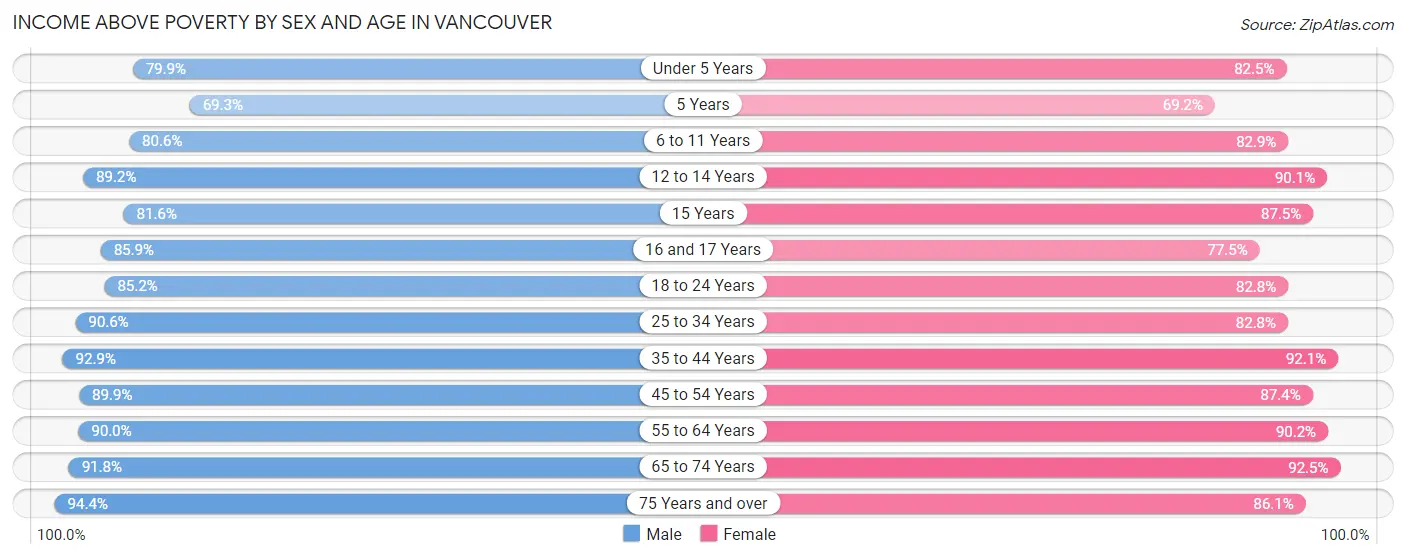
| Age Bracket | Male | Female |
| Under 5 Years | 4,839 (79.9%) | 3,759 (82.5%) |
| 5 Years | 812 (69.3%) | 772 (69.2%) |
| 6 to 11 Years | 5,397 (80.6%) | 5,719 (82.9%) |
| 12 to 14 Years | 3,471 (89.2%) | 2,768 (90.0%) |
| 15 Years | 1,084 (81.6%) | 1,020 (87.5%) |
| 16 and 17 Years | 1,416 (85.9%) | 1,946 (77.5%) |
| 18 to 24 Years | 7,026 (85.2%) | 7,348 (82.8%) |
| 25 to 34 Years | 13,980 (90.6%) | 11,921 (82.8%) |
| 35 to 44 Years | 11,915 (92.9%) | 11,981 (92.1%) |
| 45 to 54 Years | 10,382 (89.9%) | 9,648 (87.4%) |
| 55 to 64 Years | 9,960 (90.0%) | 10,486 (90.2%) |
| 65 to 74 Years | 7,608 (91.8%) | 9,070 (92.5%) |
| 75 Years and over | 4,511 (94.4%) | 6,365 (86.1%) |
| Total | 82,401 (88.6%) | 82,803 (86.7%) |
Income Below Poverty Among Married-Couple Families in Vancouver
The poverty statistics for married-couple families in Vancouver show that 3.9% or 1,236 of the total 32,011 families live below the poverty line. Families with 5 or more children have the highest poverty rate of 33.5%, comprising of 134 families. On the other hand, families with no children have the lowest poverty rate of 2.0%, which includes 381 families.
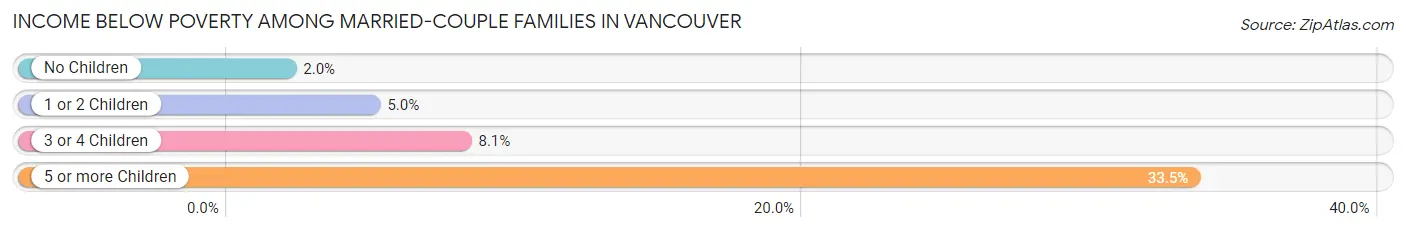
| Children | Above Poverty | Below Poverty |
| No Children | 18,345 (98.0%) | 381 (2.0%) |
| 1 or 2 Children | 9,781 (95.0%) | 510 (5.0%) |
| 3 or 4 Children | 2,383 (91.9%) | 211 (8.1%) |
| 5 or more Children | 266 (66.5%) | 134 (33.5%) |
| Total | 30,775 (96.1%) | 1,236 (3.9%) |
Income Below Poverty Among Single-Parent Households in Vancouver
According to the poverty data in Vancouver, 11.1% or 448 single-father households and 22.8% or 2,107 single-mother households are living below the poverty line. Among single-father households, those with 3 or 4 children have the highest poverty rate, with 66 households (21.1%) experiencing poverty. Likewise, among single-mother households, those with 3 or 4 children have the highest poverty rate, with 403 households (48.2%) falling below the poverty line.
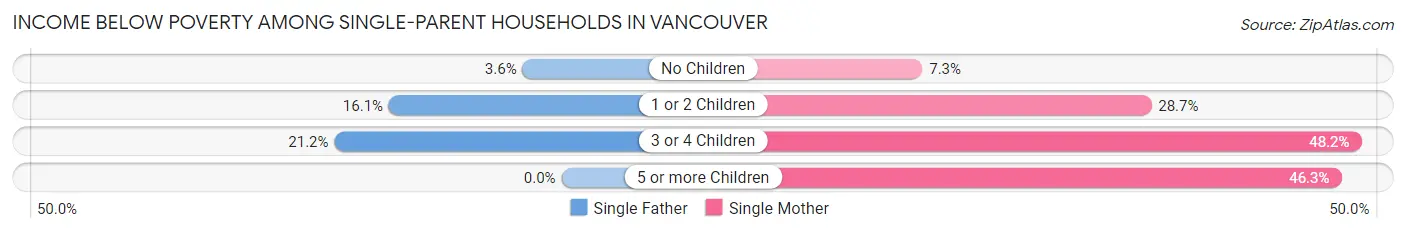
| Children | Single Father | Single Mother |
| No Children | 64 (3.6%) | 245 (7.3%) |
| 1 or 2 Children | 318 (16.1%) | 1,440 (28.6%) |
| 3 or 4 Children | 66 (21.1%) | 403 (48.2%) |
| 5 or more Children | 0 (0.0%) | 19 (46.3%) |
| Total | 448 (11.1%) | 2,107 (22.8%) |
Income Below Poverty Among Married-Couple vs Single-Parent Households in Vancouver
The poverty data for Vancouver shows that 1,236 of the married-couple family households (3.9%) and 2,555 of the single-parent households (19.2%) are living below the poverty level. Within the married-couple family households, those with 5 or more children have the highest poverty rate, with 134 households (33.5%) falling below the poverty line. Among the single-parent households, those with 5 or more children have the highest poverty rate, with 19 household (46.3%) living below poverty.
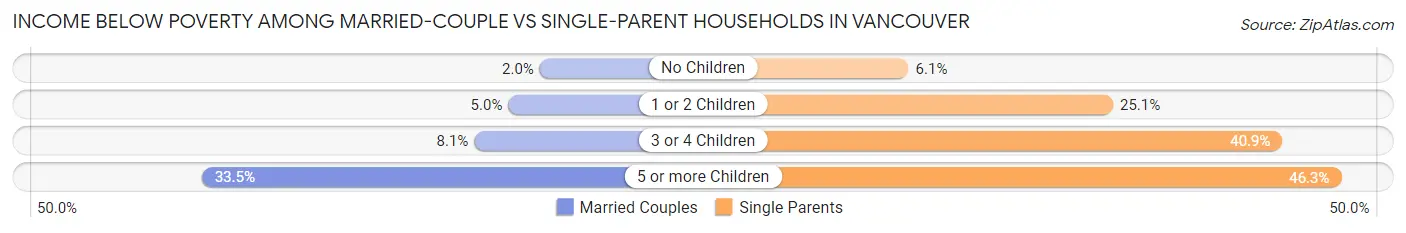
| Children | Married-Couple Families | Single-Parent Households |
| No Children | 381 (2.0%) | 309 (6.0%) |
| 1 or 2 Children | 510 (5.0%) | 1,758 (25.1%) |
| 3 or 4 Children | 211 (8.1%) | 469 (40.8%) |
| 5 or more Children | 134 (33.5%) | 19 (46.3%) |
| Total | 1,236 (3.9%) | 2,555 (19.2%) |
Race in Vancouver
The most populous races in Vancouver are White / Caucasian (140,219 | 73.5%), Hispanic or Latino (29,389 | 15.4%), and Two or more Races (21,168 | 11.1%).
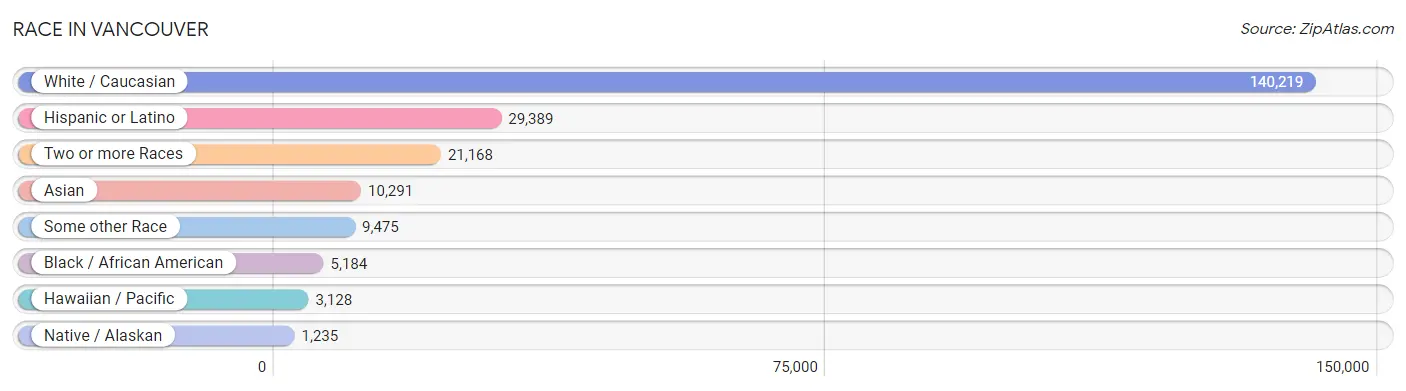
| Race | # Population | % Population |
| Asian | 10,291 | 5.4% |
| Black / African American | 5,184 | 2.7% |
| Hawaiian / Pacific | 3,128 | 1.6% |
| Hispanic or Latino | 29,389 | 15.4% |
| Native / Alaskan | 1,235 | 0.6% |
| White / Caucasian | 140,219 | 73.5% |
| Two or more Races | 21,168 | 11.1% |
| Some other Race | 9,475 | 5.0% |
| Total | 190,700 | 100.0% |
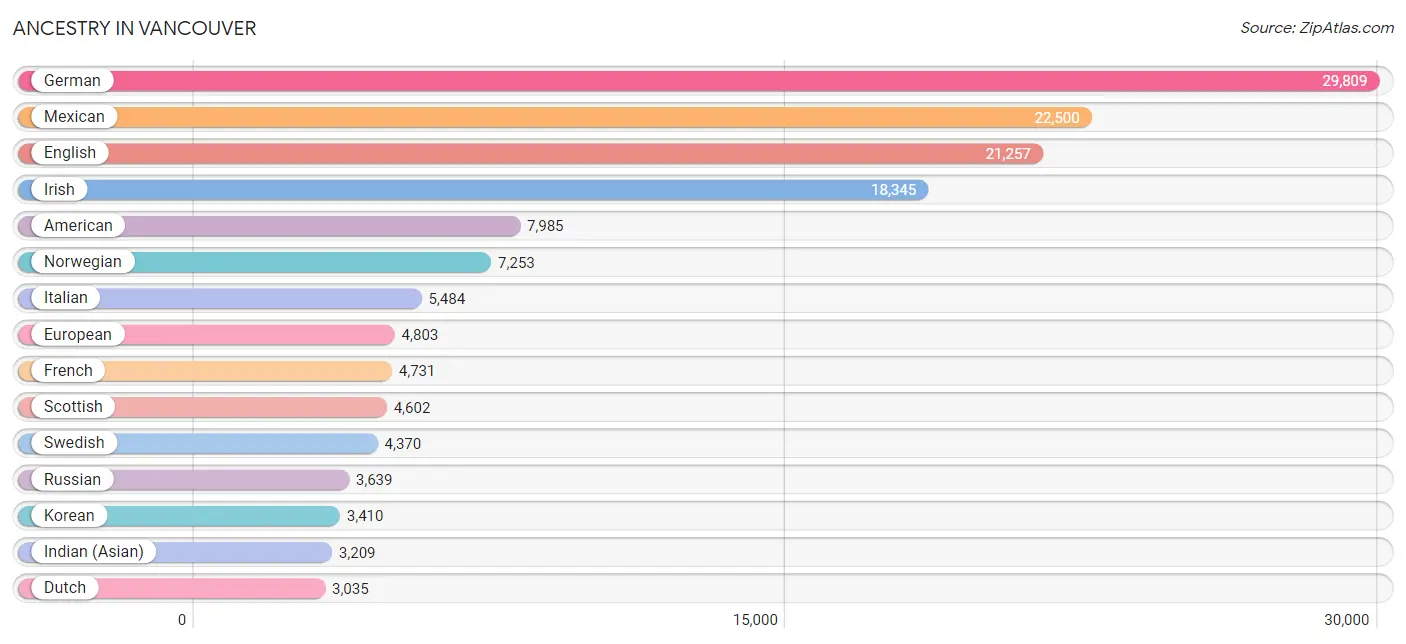
Ancestry in Vancouver
The most populous ancestries reported in Vancouver are German (29,809 | 15.6%), Mexican (22,500 | 11.8%), English (21,257 | 11.2%), Irish (18,345 | 9.6%), and American (7,985 | 4.2%), together accounting for 52.4% of all Vancouver residents.
| Ancestry | # Population | % Population |
| Afghan | 31 | 0.0% |
| African | 464 | 0.2% |
| Alaska Native | 10 | 0.0% |
| Alaskan Athabascan | 12 | 0.0% |
| Albanian | 23 | 0.0% |
| Aleut | 55 | 0.0% |
| American | 7,985 | 4.2% |
| Apache | 325 | 0.2% |
| Arab | 891 | 0.5% |
| Argentinean | 56 | 0.0% |
| Armenian | 304 | 0.2% |
| Australian | 130 | 0.1% |
| Austrian | 362 | 0.2% |
| Bahamian | 12 | 0.0% |
| Bangladeshi | 434 | 0.2% |
| Basque | 48 | 0.0% |
| Belgian | 85 | 0.0% |
| Bhutanese | 1,609 | 0.8% |
| Blackfeet | 403 | 0.2% |
| Brazilian | 31 | 0.0% |
| British | 1,809 | 0.9% |
| British West Indian | 14 | 0.0% |
| Bulgarian | 46 | 0.0% |
| Burmese | 1,924 | 1.0% |
| Canadian | 416 | 0.2% |
| Carpatho Rusyn | 141 | 0.1% |
| Celtic | 36 | 0.0% |
| Central American | 2,745 | 1.4% |
| Central American Indian | 88 | 0.1% |
| Cherokee | 921 | 0.5% |
| Cheyenne | 114 | 0.1% |
| Chilean | 145 | 0.1% |
| Chippewa | 342 | 0.2% |
| Choctaw | 31 | 0.0% |
| Colombian | 336 | 0.2% |
| Colville | 5 | 0.0% |
| Costa Rican | 74 | 0.0% |
| Cree | 13 | 0.0% |
| Creek | 31 | 0.0% |
| Croatian | 162 | 0.1% |
| Crow | 26 | 0.0% |
| Cuban | 437 | 0.2% |
| Czech | 530 | 0.3% |
| Czechoslovakian | 64 | 0.0% |
| Danish | 1,406 | 0.7% |
| Delaware | 12 | 0.0% |
| Dominican | 75 | 0.0% |
| Dutch | 3,035 | 1.6% |
| Eastern European | 398 | 0.2% |
| Ecuadorian | 52 | 0.0% |
| Egyptian | 24 | 0.0% |
| English | 21,257 | 11.2% |
| Estonian | 116 | 0.1% |
| Ethiopian | 331 | 0.2% |
| European | 4,803 | 2.5% |
| Filipino | 210 | 0.1% |
| Finnish | 1,127 | 0.6% |
| French | 4,731 | 2.5% |
| French Canadian | 1,359 | 0.7% |
| German | 29,809 | 15.6% |
| Greek | 673 | 0.4% |
| Guamanian / Chamorro | 778 | 0.4% |
| Guatemalan | 1,687 | 0.9% |
| Guyanese | 6 | 0.0% |
| Haitian | 77 | 0.0% |
| Honduran | 65 | 0.0% |
| Hungarian | 611 | 0.3% |
| Icelander | 69 | 0.0% |
| Indian (Asian) | 3,209 | 1.7% |
| Indonesian | 70 | 0.0% |
| Iranian | 258 | 0.1% |
| Iraqi | 213 | 0.1% |
| Irish | 18,345 | 9.6% |
| Iroquois | 34 | 0.0% |
| Israeli | 21 | 0.0% |
| Italian | 5,484 | 2.9% |
| Jamaican | 7 | 0.0% |
| Japanese | 601 | 0.3% |
| Jordanian | 84 | 0.0% |
| Korean | 3,410 | 1.8% |
| Laotian | 107 | 0.1% |
| Latvian | 68 | 0.0% |
| Lebanese | 92 | 0.1% |
| Liberian | 161 | 0.1% |
| Lithuanian | 357 | 0.2% |
| Lumbee | 18 | 0.0% |
| Luxembourger | 50 | 0.0% |
| Macedonian | 22 | 0.0% |
| Malaysian | 356 | 0.2% |
| Maltese | 3 | 0.0% |
| Marshallese | 263 | 0.1% |
| Mexican | 22,500 | 11.8% |
| Mexican American Indian | 148 | 0.1% |
| Mongolian | 76 | 0.0% |
| Native Hawaiian | 1,195 | 0.6% |
| Navajo | 59 | 0.0% |
| New Zealander | 315 | 0.2% |
| Nicaraguan | 110 | 0.1% |
| Nigerian | 121 | 0.1% |
| Northern European | 1,052 | 0.5% |
| Norwegian | 7,253 | 3.8% |
| Osage | 43 | 0.0% |
| Ottawa | 55 | 0.0% |
| Paiute | 10 | 0.0% |
| Pakistani | 297 | 0.2% |
| Palestinian | 76 | 0.0% |
| Panamanian | 49 | 0.0% |
| Paraguayan | 9 | 0.0% |
| Pennsylvania German | 55 | 0.0% |
| Peruvian | 153 | 0.1% |
| Polish | 2,791 | 1.5% |
| Portuguese | 645 | 0.3% |
| Potawatomi | 25 | 0.0% |
| Pueblo | 34 | 0.0% |
| Puerto Rican | 919 | 0.5% |
| Puget Sound Salish | 80 | 0.0% |
| Romanian | 1,422 | 0.7% |
| Russian | 3,639 | 1.9% |
| Salvadoran | 748 | 0.4% |
| Samoan | 863 | 0.4% |
| Scandinavian | 1,932 | 1.0% |
| Scotch-Irish | 1,776 | 0.9% |
| Scottish | 4,602 | 2.4% |
| Seminole | 31 | 0.0% |
| Senegalese | 48 | 0.0% |
| Serbian | 132 | 0.1% |
| Sioux | 228 | 0.1% |
| Slavic | 123 | 0.1% |
| Slovak | 143 | 0.1% |
| Slovene | 102 | 0.1% |
| Somali | 139 | 0.1% |
| South African | 53 | 0.0% |
| South American | 779 | 0.4% |
| South American Indian | 23 | 0.0% |
| Spaniard | 747 | 0.4% |
| Spanish | 488 | 0.3% |
| Spanish American | 22 | 0.0% |
| Sri Lankan | 2,225 | 1.2% |
| Subsaharan African | 1,602 | 0.8% |
| Sudanese | 67 | 0.0% |
| Swedish | 4,370 | 2.3% |
| Swiss | 766 | 0.4% |
| Syrian | 56 | 0.0% |
| Thai | 1,571 | 0.8% |
| Tlingit-Haida | 76 | 0.0% |
| Trinidadian and Tobagonian | 26 | 0.0% |
| Turkish | 29 | 0.0% |
| Ukrainian | 2,989 | 1.6% |
| Venezuelan | 28 | 0.0% |
| Welsh | 1,613 | 0.9% |
| West Indian | 9 | 0.0% |
| Yakama | 23 | 0.0% |
| Yaqui | 12 | 0.0% |
| Yugoslavian | 672 | 0.4% |
| Yup'ik | 14 | 0.0% | View All 155 Rows |
Immigrants in Vancouver
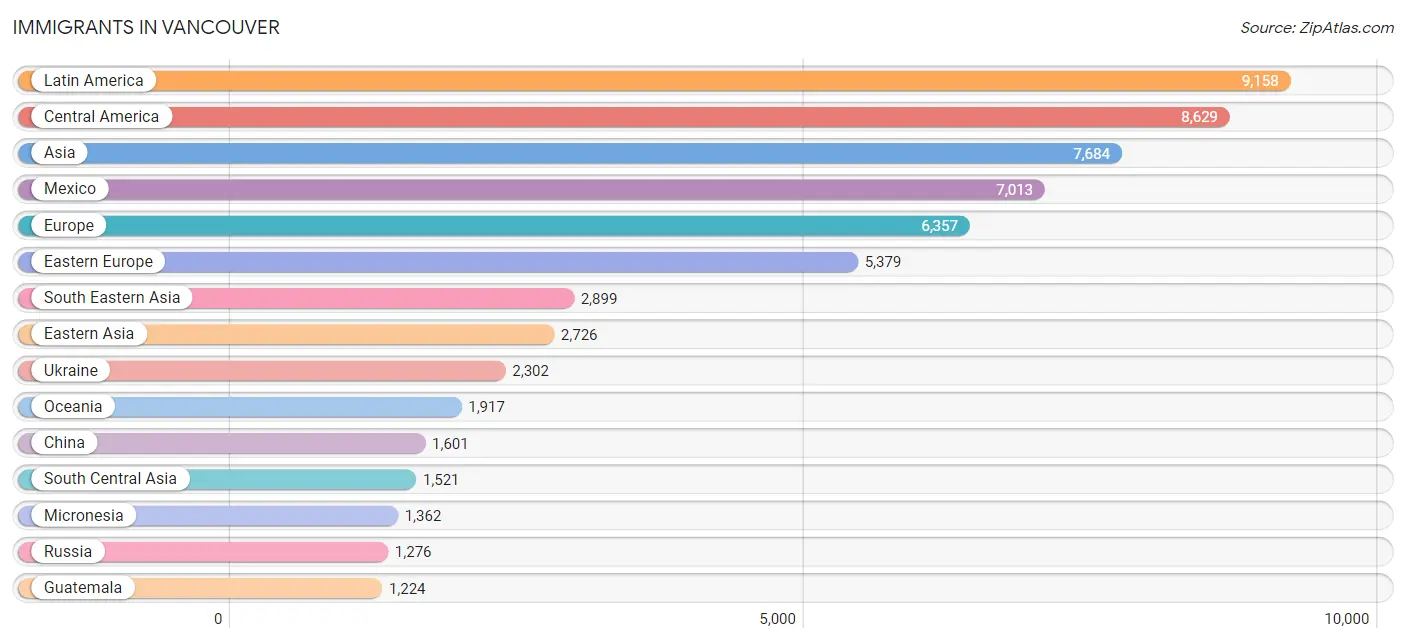
The most numerous immigrant groups reported in Vancouver came from Latin America (9,158 | 4.8%), Central America (8,629 | 4.5%), Asia (7,684 | 4.0%), Mexico (7,013 | 3.7%), and Europe (6,357 | 3.3%), together accounting for 20.4% of all Vancouver residents.
| Immigration Origin | # Population | % Population |
| Afghanistan | 31 | 0.0% |
| Africa | 780 | 0.4% |
| Argentina | 37 | 0.0% |
| Armenia | 35 | 0.0% |
| Asia | 7,684 | 4.0% |
| Australia | 134 | 0.1% |
| Austria | 25 | 0.0% |
| Azores | 3 | 0.0% |
| Belarus | 101 | 0.1% |
| Belgium | 10 | 0.0% |
| Bosnia and Herzegovina | 387 | 0.2% |
| Brazil | 96 | 0.1% |
| Bulgaria | 83 | 0.0% |
| Cambodia | 197 | 0.1% |
| Canada | 557 | 0.3% |
| Caribbean | 139 | 0.1% |
| Central America | 8,629 | 4.5% |
| Chile | 85 | 0.0% |
| China | 1,601 | 0.8% |
| Colombia | 40 | 0.0% |
| Costa Rica | 11 | 0.0% |
| Cuba | 34 | 0.0% |
| Czechoslovakia | 37 | 0.0% |
| Denmark | 4 | 0.0% |
| Dominican Republic | 8 | 0.0% |
| Eastern Africa | 414 | 0.2% |
| Eastern Asia | 2,726 | 1.4% |
| Eastern Europe | 5,379 | 2.8% |
| Ecuador | 42 | 0.0% |
| Egypt | 45 | 0.0% |
| El Salvador | 246 | 0.1% |
| England | 125 | 0.1% |
| Eritrea | 108 | 0.1% |
| Ethiopia | 117 | 0.1% |
| Europe | 6,357 | 3.3% |
| Fiji | 265 | 0.1% |
| France | 48 | 0.0% |
| Germany | 248 | 0.1% |
| Greece | 12 | 0.0% |
| Guatemala | 1,224 | 0.6% |
| Haiti | 52 | 0.0% |
| Honduras | 37 | 0.0% |
| Hong Kong | 184 | 0.1% |
| India | 632 | 0.3% |
| Indonesia | 87 | 0.1% |
| Iran | 128 | 0.1% |
| Iraq | 262 | 0.1% |
| Ireland | 35 | 0.0% |
| Italy | 15 | 0.0% |
| Jamaica | 1 | 0.0% |
| Japan | 301 | 0.2% |
| Jordan | 41 | 0.0% |
| Kazakhstan | 227 | 0.1% |
| Kenya | 50 | 0.0% |
| Korea | 824 | 0.4% |
| Kuwait | 51 | 0.0% |
| Laos | 166 | 0.1% |
| Latin America | 9,158 | 4.8% |
| Latvia | 8 | 0.0% |
| Liberia | 70 | 0.0% |
| Malaysia | 65 | 0.0% |
| Mexico | 7,013 | 3.7% |
| Micronesia | 1,362 | 0.7% |
| Moldova | 197 | 0.1% |
| Morocco | 10 | 0.0% |
| Nepal | 7 | 0.0% |
| Netherlands | 21 | 0.0% |
| Nicaragua | 91 | 0.1% |
| Nigeria | 51 | 0.0% |
| North Macedonia | 7 | 0.0% |
| Northern Africa | 75 | 0.0% |
| Northern Europe | 474 | 0.3% |
| Oceania | 1,917 | 1.0% |
| Pakistan | 7 | 0.0% |
| Panama | 7 | 0.0% |
| Peru | 60 | 0.0% |
| Philippines | 1,075 | 0.6% |
| Poland | 126 | 0.1% |
| Portugal | 16 | 0.0% |
| Romania | 546 | 0.3% |
| Russia | 1,276 | 0.7% |
| Saudi Arabia | 51 | 0.0% |
| Scotland | 79 | 0.0% |
| Serbia | 89 | 0.1% |
| Singapore | 10 | 0.0% |
| Somalia | 123 | 0.1% |
| South Africa | 19 | 0.0% |
| South America | 390 | 0.2% |
| South Central Asia | 1,521 | 0.8% |
| South Eastern Asia | 2,899 | 1.5% |
| Southern Europe | 97 | 0.1% |
| Spain | 34 | 0.0% |
| Sri Lanka | 63 | 0.0% |
| Sweden | 30 | 0.0% |
| Switzerland | 55 | 0.0% |
| Syria | 32 | 0.0% |
| Taiwan | 426 | 0.2% |
| Thailand | 187 | 0.1% |
| Trinidad and Tobago | 24 | 0.0% |
| Turkey | 9 | 0.0% |
| Uganda | 16 | 0.0% |
| Ukraine | 2,302 | 1.2% |
| Uzbekistan | 152 | 0.1% |
| Venezuela | 17 | 0.0% |
| Vietnam | 1,054 | 0.5% |
| West Indies | 20 | 0.0% |
| Western Africa | 189 | 0.1% |
| Western Asia | 538 | 0.3% |
| Western Europe | 407 | 0.2% |
| Yemen | 33 | 0.0% | View All 110 Rows |
Sex and Age in Vancouver
Sex and Age in Vancouver
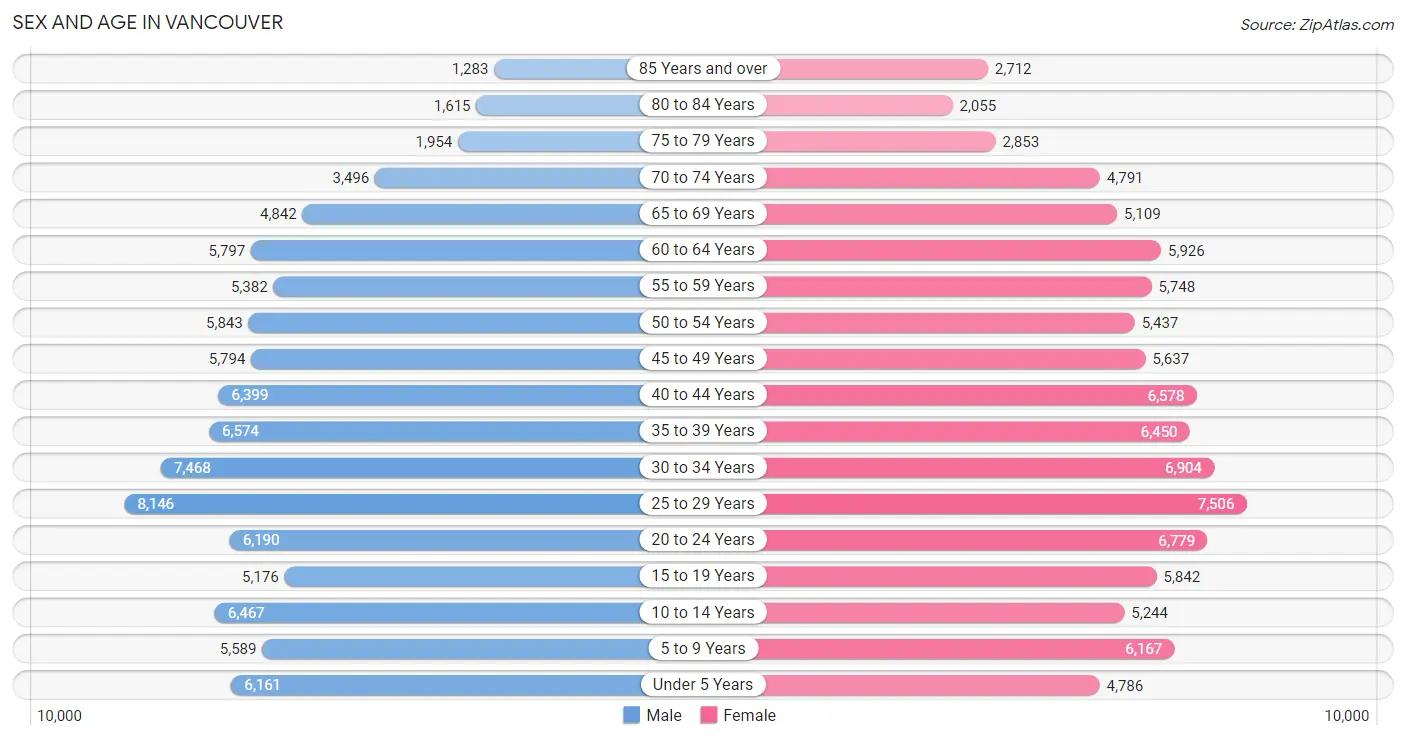
The most populous age groups in Vancouver are 25 to 29 Years (8,146 | 8.6%) for men and 25 to 29 Years (7,506 | 7.8%) for women.
| Age Bracket | Male | Female |
| Under 5 Years | 6,161 (6.5%) | 4,786 (5.0%) |
| 5 to 9 Years | 5,589 (5.9%) | 6,167 (6.4%) |
| 10 to 14 Years | 6,467 (6.9%) | 5,244 (5.4%) |
| 15 to 19 Years | 5,176 (5.5%) | 5,842 (6.0%) |
| 20 to 24 Years | 6,190 (6.6%) | 6,779 (7.0%) |
| 25 to 29 Years | 8,146 (8.6%) | 7,506 (7.8%) |
| 30 to 34 Years | 7,468 (7.9%) | 6,904 (7.1%) |
| 35 to 39 Years | 6,574 (7.0%) | 6,450 (6.7%) |
| 40 to 44 Years | 6,399 (6.8%) | 6,578 (6.8%) |
| 45 to 49 Years | 5,794 (6.1%) | 5,637 (5.8%) |
| 50 to 54 Years | 5,843 (6.2%) | 5,437 (5.6%) |
| 55 to 59 Years | 5,382 (5.7%) | 5,748 (5.9%) |
| 60 to 64 Years | 5,797 (6.2%) | 5,926 (6.1%) |
| 65 to 69 Years | 4,842 (5.1%) | 5,109 (5.3%) |
| 70 to 74 Years | 3,496 (3.7%) | 4,791 (5.0%) |
| 75 to 79 Years | 1,954 (2.1%) | 2,853 (3.0%) |
| 80 to 84 Years | 1,615 (1.7%) | 2,055 (2.1%) |
| 85 Years and over | 1,283 (1.4%) | 2,712 (2.8%) |
| Total | 94,176 (100.0%) | 96,524 (100.0%) |
Families and Households in Vancouver
Median Family Size in Vancouver
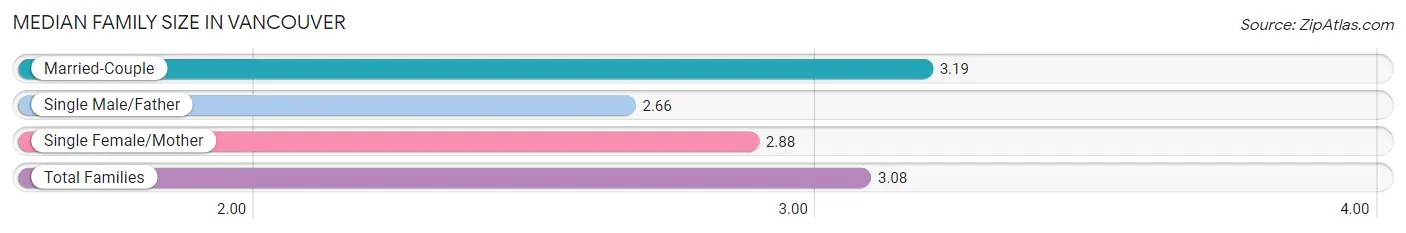
The median family size in Vancouver is 3.08 persons per family, with married-couple families (32,011 | 70.6%) accounting for the largest median family size of 3.19 persons per family. On the other hand, single male/father families (4,056 | 8.9%) represent the smallest median family size with 2.66 persons per family.
| Family Type | # Families | Family Size |
| Married-Couple | 32,011 (70.6%) | 3.19 |
| Single Male/Father | 4,056 (8.9%) | 2.66 |
| Single Female/Mother | 9,249 (20.4%) | 2.88 |
| Total Families | 45,316 (100.0%) | 3.08 |
Median Household Size in Vancouver
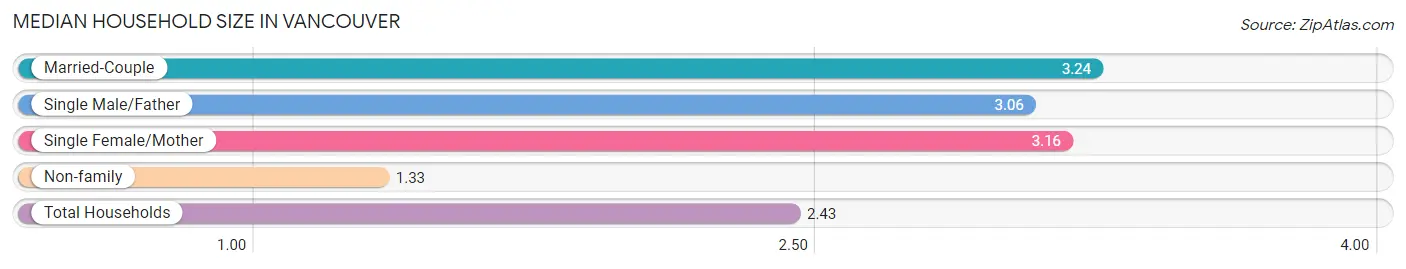
The median household size in Vancouver is 2.43 persons per household, with married-couple households (32,011 | 41.3%) accounting for the largest median household size of 3.24 persons per household. non-family households (32,102 | 41.5%) represent the smallest median household size with 1.33 persons per household.
| Household Type | # Households | Household Size |
| Married-Couple | 32,011 (41.3%) | 3.24 |
| Single Male/Father | 4,056 (5.2%) | 3.06 |
| Single Female/Mother | 9,249 (11.9%) | 3.16 |
| Non-family | 32,102 (41.5%) | 1.33 |
| Total Households | 77,418 (100.0%) | 2.43 |
Household Size by Marriage Status in Vancouver
Out of a total of 77,418 households in Vancouver, 45,316 (58.5%) are family households, while 32,102 (41.5%) are nonfamily households. The most numerous type of family households are 2-person households, comprising 20,496, and the most common type of nonfamily households are 1-person households, comprising 23,977.
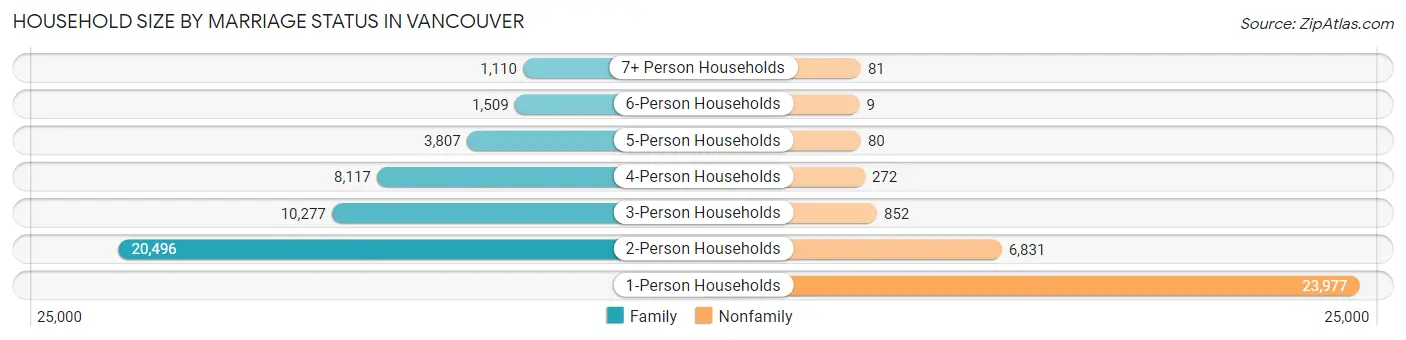
| Household Size | Family Households | Nonfamily Households |
| 1-Person Households | - | 23,977 (31.0%) |
| 2-Person Households | 20,496 (26.5%) | 6,831 (8.8%) |
| 3-Person Households | 10,277 (13.3%) | 852 (1.1%) |
| 4-Person Households | 8,117 (10.5%) | 272 (0.4%) |
| 5-Person Households | 3,807 (4.9%) | 80 (0.1%) |
| 6-Person Households | 1,509 (1.9%) | 9 (0.0%) |
| 7+ Person Households | 1,110 (1.4%) | 81 (0.1%) |
| Total | 45,316 (58.5%) | 32,102 (41.5%) |
Female Fertility in Vancouver
Fertility by Age in Vancouver
Average fertility rate in Vancouver is 55.0 births per 1,000 women. Women in the age bracket of 20 to 34 years have the highest fertility rate with 83.0 births per 1,000 women. Women in the age bracket of 20 to 34 years acount for 67.5% of all women with births.
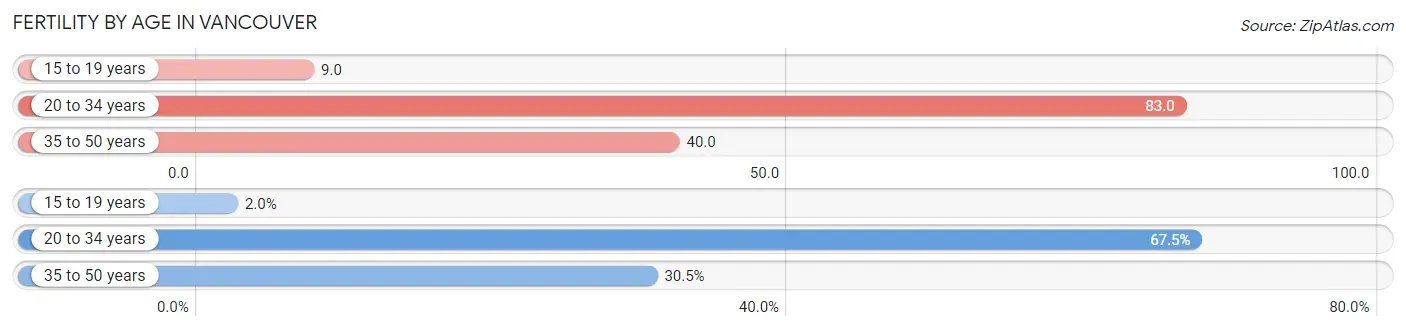
| Age Bracket | Women with Births | Births / 1,000 Women |
| 15 to 19 years | 53 (2.0%) | 9.0 |
| 20 to 34 years | 1,761 (67.5%) | 83.0 |
| 35 to 50 years | 796 (30.5%) | 40.0 |
| Total | 2,610 (100.0%) | 55.0 |
Fertility by Age by Marriage Status in Vancouver
74.4% of women with births (2,610) in Vancouver are married. The highest percentage of unmarried women with births falls into 15 to 19 years age bracket with 100.0% of them unmarried at the time of birth, while the lowest percentage of unmarried women with births belong to 35 to 50 years age bracket with 13.9% of them unmarried.
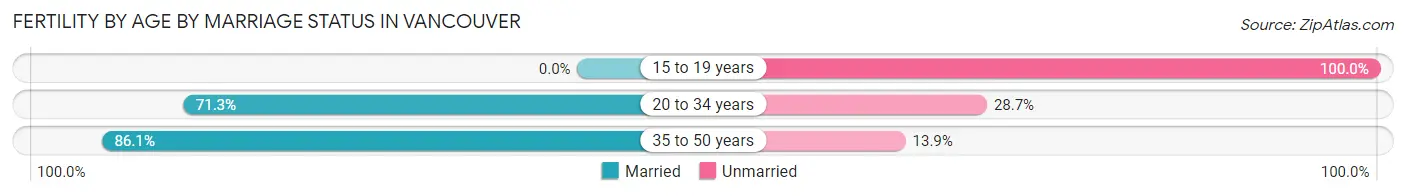
| Age Bracket | Married | Unmarried |
| 15 to 19 years | 0 (0.0%) | 53 (100.0%) |
| 20 to 34 years | 1,256 (71.3%) | 505 (28.7%) |
| 35 to 50 years | 685 (86.1%) | 111 (13.9%) |
| Total | 1,942 (74.4%) | 668 (25.6%) |
Fertility by Education in Vancouver
Average fertility rate in Vancouver is 55.0 births per 1,000 women. Women with the education attainment of graduate degree have the highest fertility rate of 75.0 births per 1,000 women, while women with the education attainment of less than high school have the lowest fertility at 42.0 births per 1,000 women. Women with the education attainment of college or associate's degree represent 40.6% of all women with births.
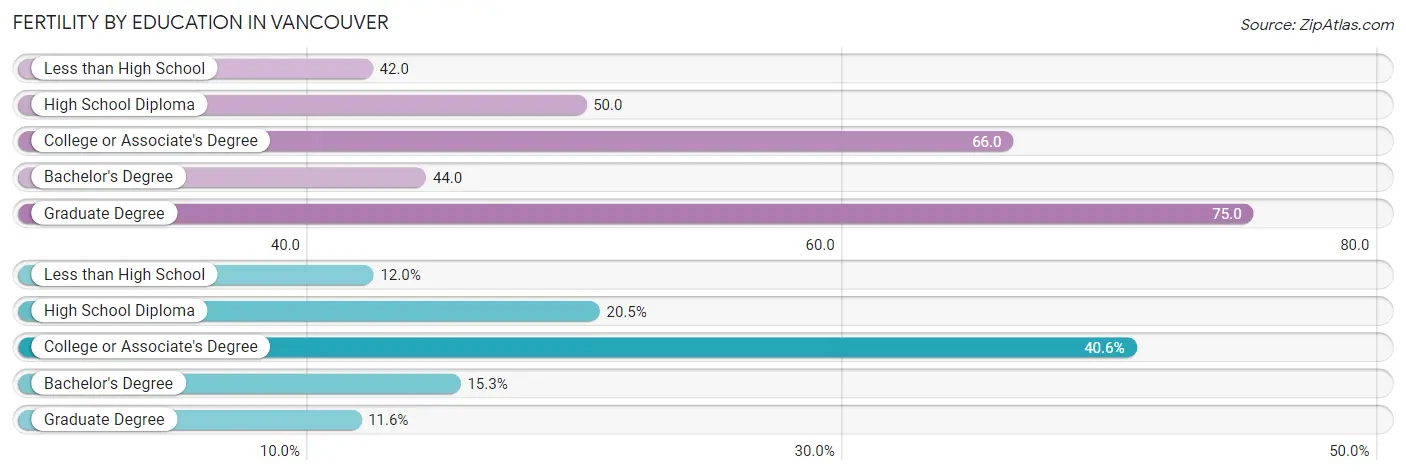
| Educational Attainment | Women with Births | Births / 1,000 Women |
| Less than High School | 314 (12.0%) | 42.0 |
| High School Diploma | 535 (20.5%) | 50.0 |
| College or Associate's Degree | 1,060 (40.6%) | 66.0 |
| Bachelor's Degree | 399 (15.3%) | 44.0 |
| Graduate Degree | 302 (11.6%) | 75.0 |
| Total | 2,610 (100.0%) | 55.0 |
Fertility by Education by Marriage Status in Vancouver
25.6% of women with births in Vancouver are unmarried. Women with the educational attainment of graduate degree are most likely to be married with 93.0% of them married at childbirth, while women with the educational attainment of high school diploma are least likely to be married with 40.0% of them unmarried at childbirth.
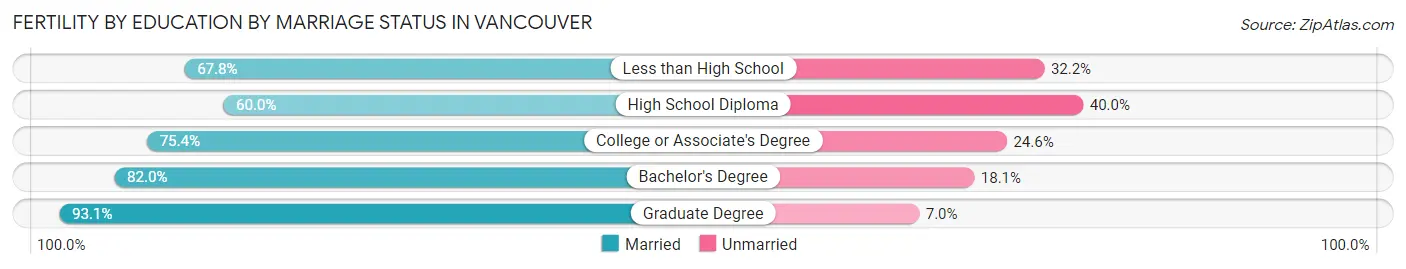
| Educational Attainment | Married | Unmarried |
| Less than High School | 213 (67.8%) | 101 (32.2%) |
| High School Diploma | 321 (60.0%) | 214 (40.0%) |
| College or Associate's Degree | 799 (75.4%) | 261 (24.6%) |
| Bachelor's Degree | 327 (82.0%) | 72 (18.0%) |
| Graduate Degree | 281 (93.0%) | 21 (7.0%) |
| Total | 1,942 (74.4%) | 668 (25.6%) |
Employment Characteristics in Vancouver
Employment by Class of Employer in Vancouver
Among the 92,381 employed individuals in Vancouver, private company employees (65,223 | 70.6%), not-for-profit organizations (7,717 | 8.4%), and self-employed (not incorporated) (5,107 | 5.5%) make up the most common classes of employment.
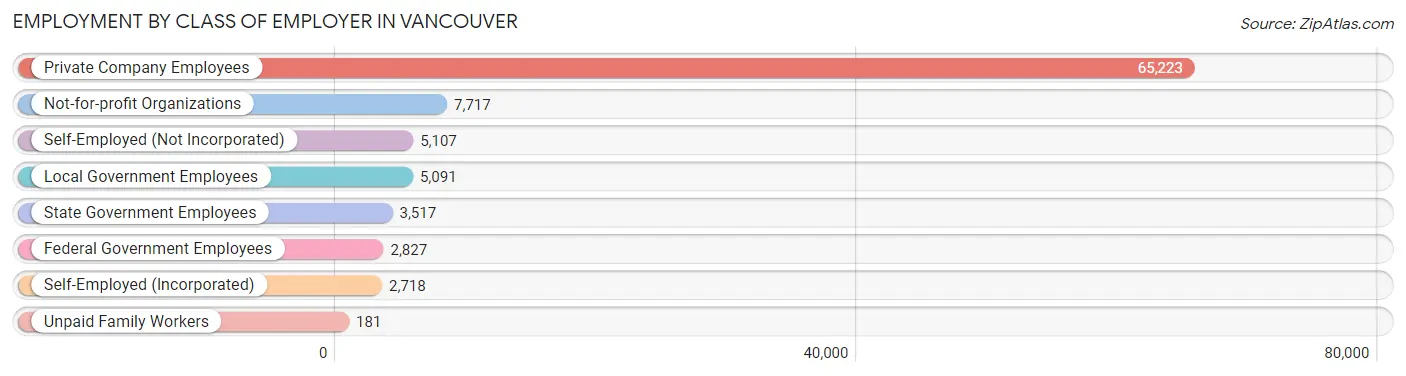
| Employer Class | # Employees | % Employees |
| Private Company Employees | 65,223 | 70.6% |
| Self-Employed (Incorporated) | 2,718 | 2.9% |
| Self-Employed (Not Incorporated) | 5,107 | 5.5% |
| Not-for-profit Organizations | 7,717 | 8.4% |
| Local Government Employees | 5,091 | 5.5% |
| State Government Employees | 3,517 | 3.8% |
| Federal Government Employees | 2,827 | 3.1% |
| Unpaid Family Workers | 181 | 0.2% |
| Total | 92,381 | 100.0% |
Employment Status by Age in Vancouver
According to the labor force statistics for Vancouver, out of the total population over 16 years of age (153,792), 64.9% or 99,811 individuals are in the labor force, with 5.6% or 5,589 of them unemployed. The age group with the highest labor force participation rate is 20 to 24 years, with 88.5% or 11,478 individuals in the labor force. Within the labor force, the 16 to 19 years age range has the highest percentage of unemployed individuals, with 19.4% or 663 of them being unemployed.
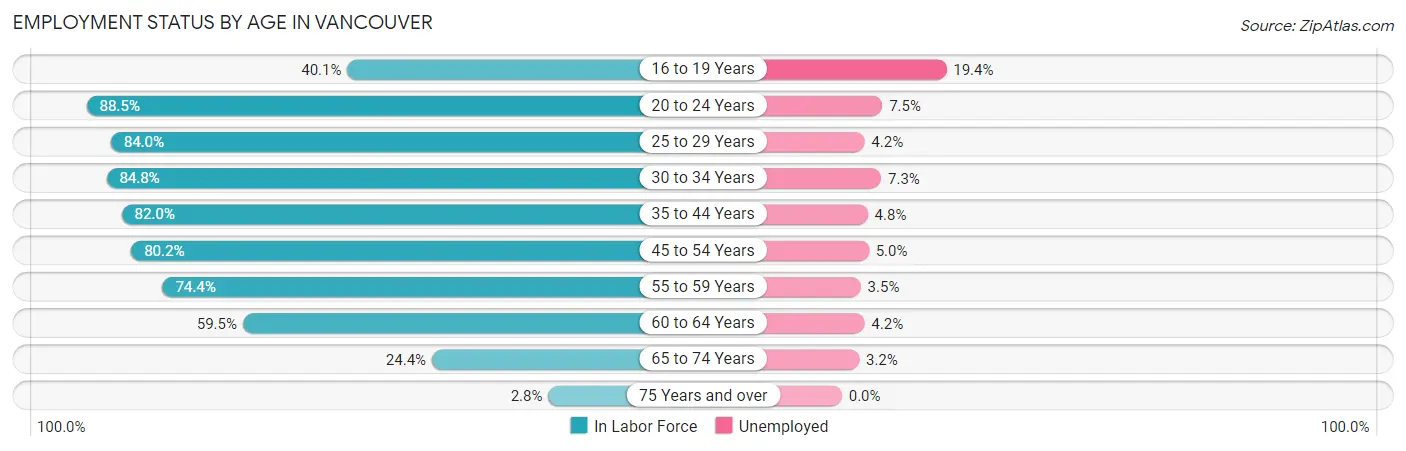
| Age Bracket | In Labor Force | Unemployed |
| 16 to 19 Years | 3,418 (40.1%) | 663 (19.4%) |
| 20 to 24 Years | 11,478 (88.5%) | 861 (7.5%) |
| 25 to 29 Years | 13,148 (84.0%) | 552 (4.2%) |
| 30 to 34 Years | 12,187 (84.8%) | 890 (7.3%) |
| 35 to 44 Years | 21,321 (82.0%) | 1,023 (4.8%) |
| 45 to 54 Years | 18,214 (80.2%) | 911 (5.0%) |
| 55 to 59 Years | 8,281 (74.4%) | 290 (3.5%) |
| 60 to 64 Years | 6,975 (59.5%) | 293 (4.2%) |
| 65 to 74 Years | 4,450 (24.4%) | 142 (3.2%) |
| 75 Years and over | 349 (2.8%) | 0 (0.0%) |
| Total | 99,811 (64.9%) | 5,589 (5.6%) |
Employment Status by Educational Attainment in Vancouver
According to labor force statistics for Vancouver, 78.9% of individuals (80,154) out of the total population between 25 and 64 years of age (101,589) are in the labor force, with 4.9% or 3,928 of them being unemployed. The group with the highest labor force participation rate are those with the educational attainment of bachelor's degree or higher, with 86.1% or 26,849 individuals in the labor force. Within the labor force, individuals with college / associate degree education have the highest percentage of unemployment, with 6.9% or 1,910 of them being unemployed.
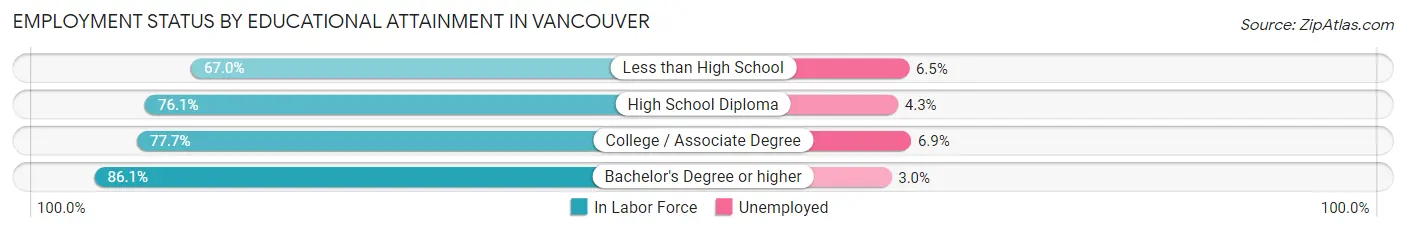
| Educational Attainment | In Labor Force | Unemployed |
| Less than High School | 6,348 (67.0%) | 616 (6.5%) |
| High School Diploma | 19,260 (76.1%) | 1,088 (4.3%) |
| College / Associate Degree | 27,679 (77.7%) | 2,458 (6.9%) |
| Bachelor's Degree or higher | 26,849 (86.1%) | 935 (3.0%) |
| Total | 80,154 (78.9%) | 4,978 (4.9%) |
Employment Occupations by Sex in Vancouver
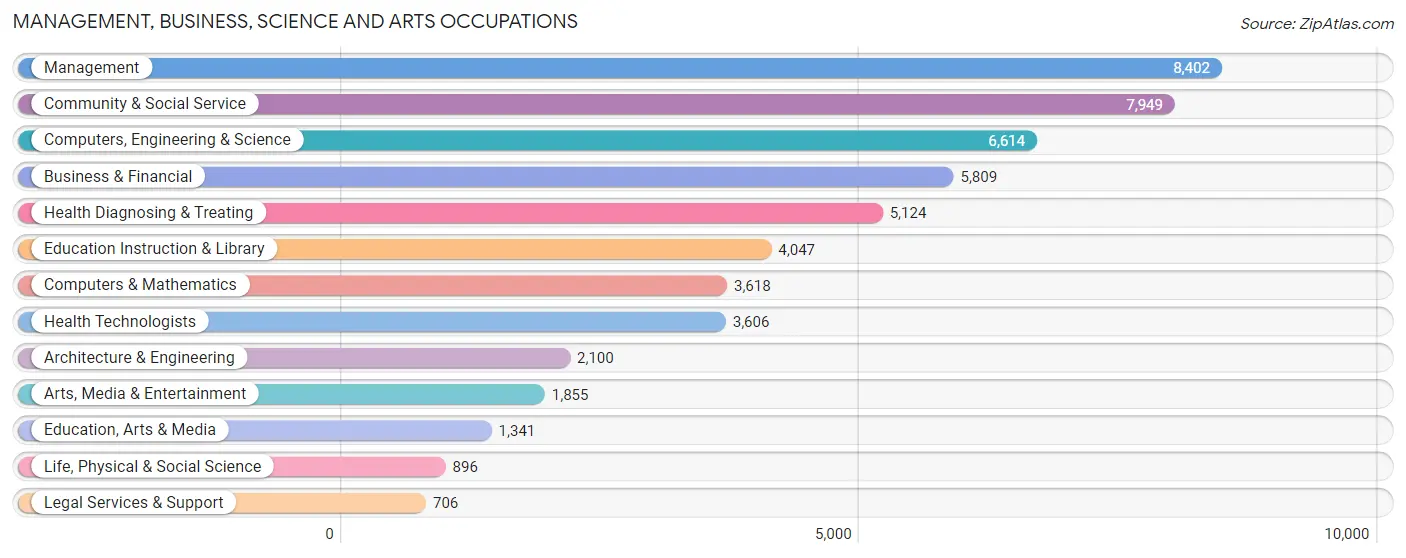
Management, Business, Science and Arts Occupations
The most common Management, Business, Science and Arts occupations in Vancouver are Management (8,402 | 8.9%), Community & Social Service (7,949 | 8.5%), Computers, Engineering & Science (6,614 | 7.0%), Business & Financial (5,809 | 6.2%), and Health Diagnosing & Treating (5,124 | 5.4%).
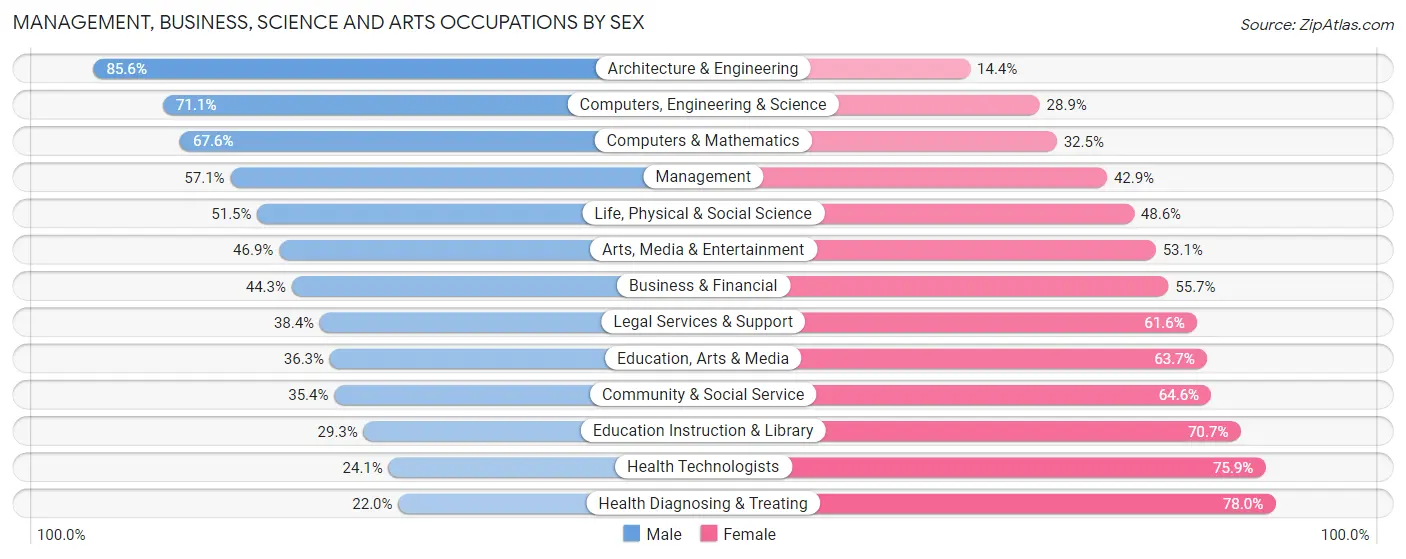
Management, Business, Science and Arts Occupations by Sex
Within the Management, Business, Science and Arts occupations in Vancouver, the most male-oriented occupations are Architecture & Engineering (85.6%), Computers, Engineering & Science (71.1%), and Computers & Mathematics (67.5%), while the most female-oriented occupations are Health Diagnosing & Treating (78.0%), Health Technologists (75.9%), and Education Instruction & Library (70.7%).
| Occupation | Male | Female |
| Management | 4,795 (57.1%) | 3,607 (42.9%) |
| Business & Financial | 2,571 (44.3%) | 3,238 (55.7%) |
| Computers, Engineering & Science | 4,703 (71.1%) | 1,911 (28.9%) |
| Computers & Mathematics | 2,444 (67.5%) | 1,174 (32.5%) |
| Architecture & Engineering | 1,798 (85.6%) | 302 (14.4%) |
| Life, Physical & Social Science | 461 (51.4%) | 435 (48.5%) |
| Community & Social Service | 2,813 (35.4%) | 5,136 (64.6%) |
| Education, Arts & Media | 487 (36.3%) | 854 (63.7%) |
| Legal Services & Support | 271 (38.4%) | 435 (61.6%) |
| Education Instruction & Library | 1,185 (29.3%) | 2,862 (70.7%) |
| Arts, Media & Entertainment | 870 (46.9%) | 985 (53.1%) |
| Health Diagnosing & Treating | 1,129 (22.0%) | 3,995 (78.0%) |
| Health Technologists | 868 (24.1%) | 2,738 (75.9%) |
| Total (Category) | 16,011 (47.2%) | 17,887 (52.8%) |
| Total (Overall) | 49,910 (53.1%) | 44,085 (46.9%) |
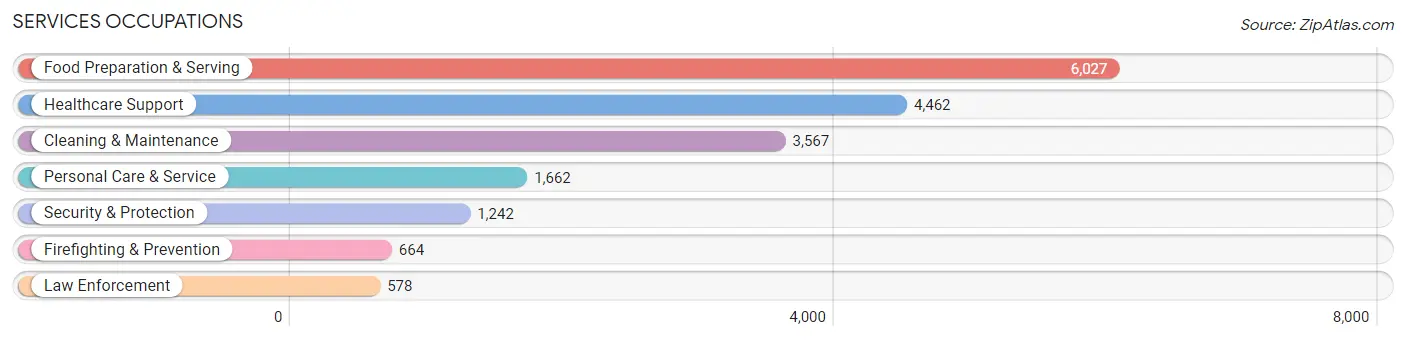
Services Occupations
The most common Services occupations in Vancouver are Food Preparation & Serving (6,027 | 6.4%), Healthcare Support (4,462 | 4.8%), Cleaning & Maintenance (3,567 | 3.8%), Personal Care & Service (1,662 | 1.8%), and Security & Protection (1,242 | 1.3%).
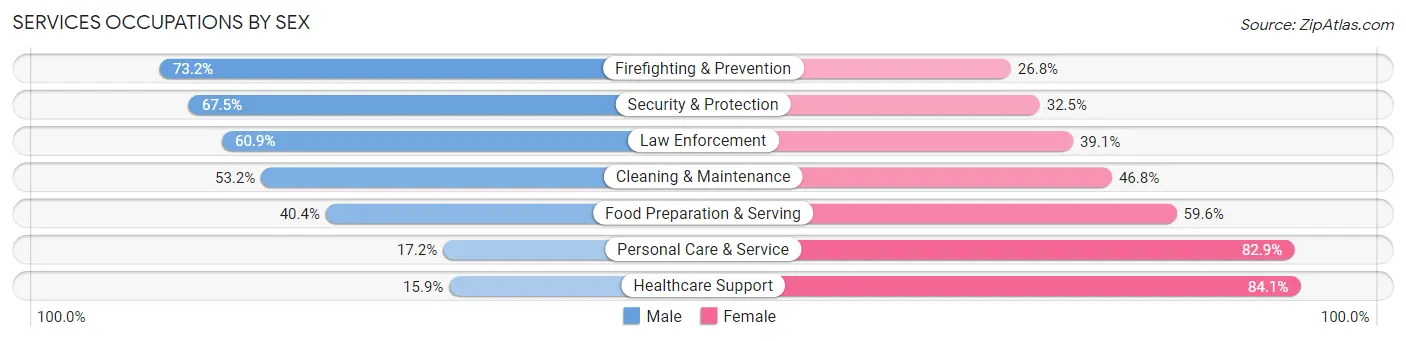
Services Occupations by Sex
Within the Services occupations in Vancouver, the most male-oriented occupations are Firefighting & Prevention (73.2%), Security & Protection (67.5%), and Law Enforcement (60.9%), while the most female-oriented occupations are Healthcare Support (84.1%), Personal Care & Service (82.9%), and Food Preparation & Serving (59.6%).
| Occupation | Male | Female |
| Healthcare Support | 711 (15.9%) | 3,751 (84.1%) |
| Security & Protection | 838 (67.5%) | 404 (32.5%) |
| Firefighting & Prevention | 486 (73.2%) | 178 (26.8%) |
| Law Enforcement | 352 (60.9%) | 226 (39.1%) |
| Food Preparation & Serving | 2,433 (40.4%) | 3,594 (59.6%) |
| Cleaning & Maintenance | 1,897 (53.2%) | 1,670 (46.8%) |
| Personal Care & Service | 285 (17.2%) | 1,377 (82.9%) |
| Total (Category) | 6,164 (36.3%) | 10,796 (63.7%) |
| Total (Overall) | 49,910 (53.1%) | 44,085 (46.9%) |
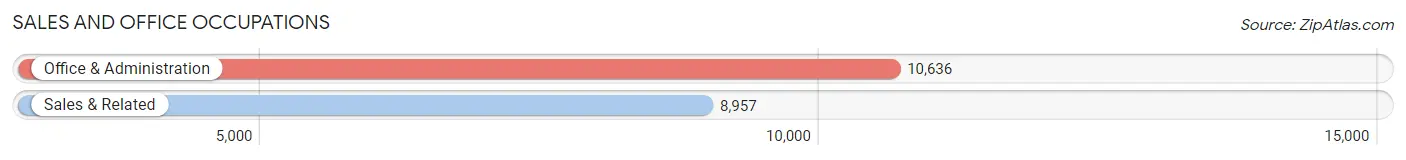
Sales and Office Occupations
The most common Sales and Office occupations in Vancouver are Office & Administration (10,636 | 11.3%), and Sales & Related (8,957 | 9.5%).
Sales and Office Occupations by Sex
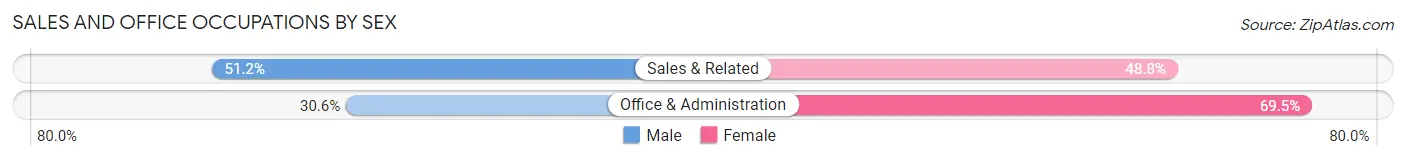
| Occupation | Male | Female |
| Sales & Related | 4,588 (51.2%) | 4,369 (48.8%) |
| Office & Administration | 3,249 (30.5%) | 7,387 (69.5%) |
| Total (Category) | 7,837 (40.0%) | 11,756 (60.0%) |
| Total (Overall) | 49,910 (53.1%) | 44,085 (46.9%) |
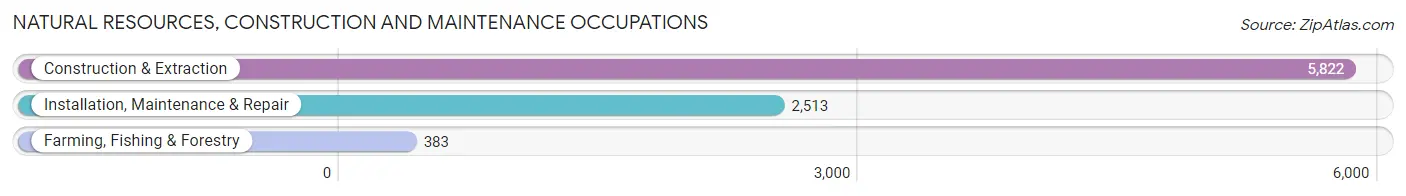
Natural Resources, Construction and Maintenance Occupations
The most common Natural Resources, Construction and Maintenance occupations in Vancouver are Construction & Extraction (5,822 | 6.2%), Installation, Maintenance & Repair (2,513 | 2.7%), and Farming, Fishing & Forestry (383 | 0.4%).
Natural Resources, Construction and Maintenance Occupations by Sex
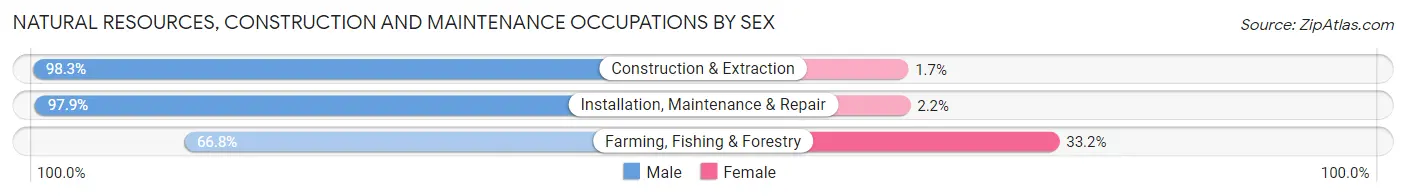
| Occupation | Male | Female |
| Farming, Fishing & Forestry | 256 (66.8%) | 127 (33.2%) |
| Construction & Extraction | 5,721 (98.3%) | 101 (1.7%) |
| Installation, Maintenance & Repair | 2,459 (97.9%) | 54 (2.1%) |
| Total (Category) | 8,436 (96.8%) | 282 (3.2%) |
| Total (Overall) | 49,910 (53.1%) | 44,085 (46.9%) |
Production, Transportation and Moving Occupations
The most common Production, Transportation and Moving occupations in Vancouver are Production (5,592 | 5.9%), Transportation (5,315 | 5.7%), and Material Moving (3,919 | 4.2%).
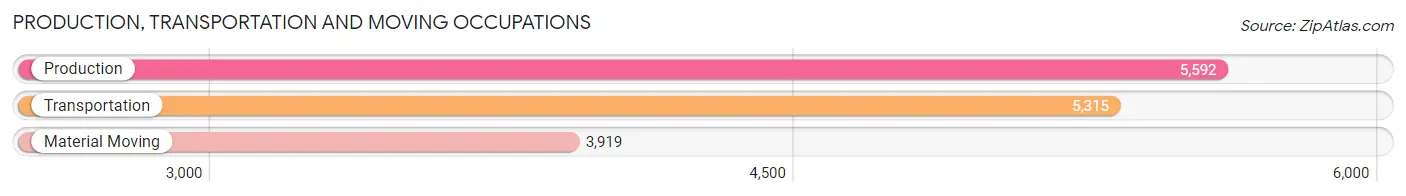
Production, Transportation and Moving Occupations by Sex
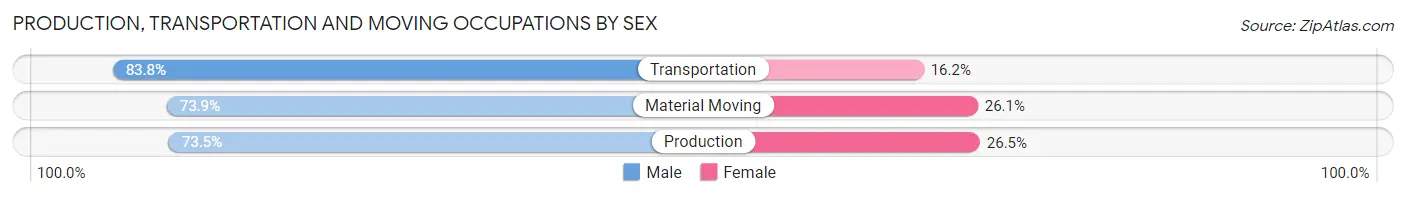
| Occupation | Male | Female |
| Production | 4,111 (73.5%) | 1,481 (26.5%) |
| Transportation | 4,455 (83.8%) | 860 (16.2%) |
| Material Moving | 2,896 (73.9%) | 1,023 (26.1%) |
| Total (Category) | 11,462 (77.3%) | 3,364 (22.7%) |
| Total (Overall) | 49,910 (53.1%) | 44,085 (46.9%) |
Employment Industries by Sex in Vancouver
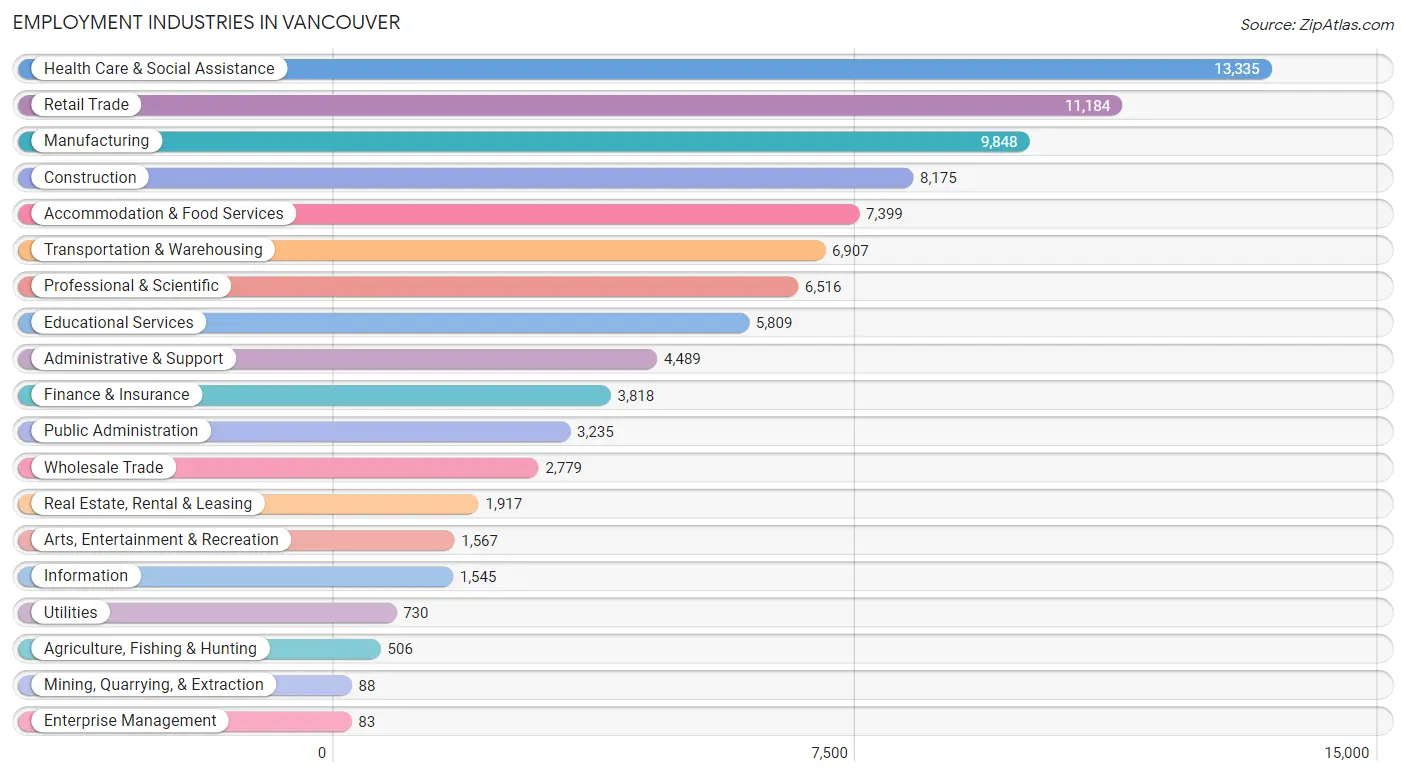
Employment Industries in Vancouver
The major employment industries in Vancouver include Health Care & Social Assistance (13,335 | 14.2%), Retail Trade (11,184 | 11.9%), Manufacturing (9,848 | 10.5%), Construction (8,175 | 8.7%), and Accommodation & Food Services (7,399 | 7.9%).
Employment Industries by Sex in Vancouver
The Vancouver industries that see more men than women are Construction (91.2%), Transportation & Warehousing (76.7%), and Manufacturing (75.4%), whereas the industries that tend to have a higher number of women are Enterprise Management (86.8%), Health Care & Social Assistance (79.6%), and Educational Services (70.7%).
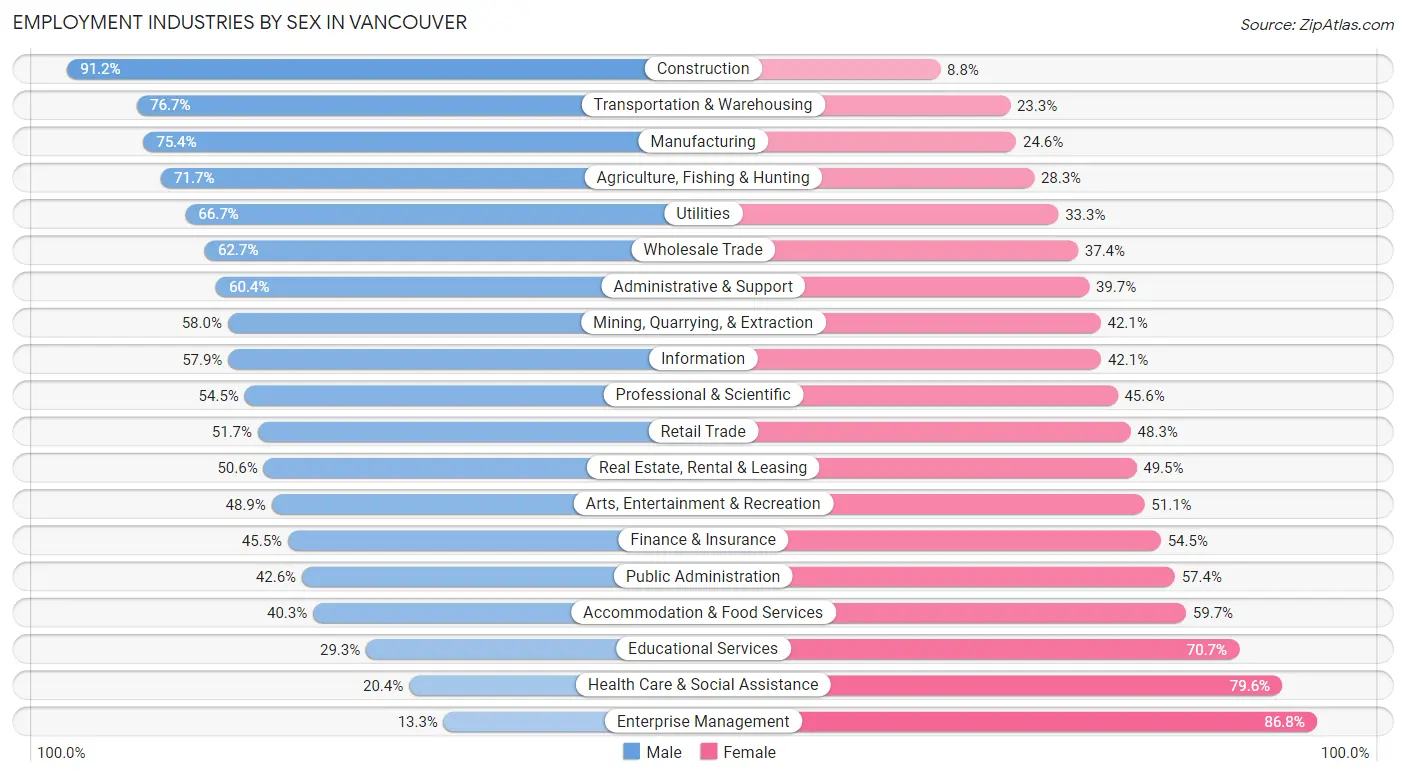
| Industry | Male | Female |
| Agriculture, Fishing & Hunting | 363 (71.7%) | 143 (28.3%) |
| Mining, Quarrying, & Extraction | 51 (58.0%) | 37 (42.0%) |
| Construction | 7,452 (91.2%) | 723 (8.8%) |
| Manufacturing | 7,428 (75.4%) | 2,420 (24.6%) |
| Wholesale Trade | 1,741 (62.6%) | 1,038 (37.3%) |
| Retail Trade | 5,784 (51.7%) | 5,400 (48.3%) |
| Transportation & Warehousing | 5,298 (76.7%) | 1,609 (23.3%) |
| Utilities | 487 (66.7%) | 243 (33.3%) |
| Information | 894 (57.9%) | 651 (42.1%) |
| Finance & Insurance | 1,737 (45.5%) | 2,081 (54.5%) |
| Real Estate, Rental & Leasing | 969 (50.5%) | 948 (49.4%) |
| Professional & Scientific | 3,548 (54.4%) | 2,968 (45.6%) |
| Enterprise Management | 11 (13.3%) | 72 (86.8%) |
| Administrative & Support | 2,709 (60.4%) | 1,780 (39.7%) |
| Educational Services | 1,704 (29.3%) | 4,105 (70.7%) |
| Health Care & Social Assistance | 2,723 (20.4%) | 10,612 (79.6%) |
| Arts, Entertainment & Recreation | 766 (48.9%) | 801 (51.1%) |
| Accommodation & Food Services | 2,981 (40.3%) | 4,418 (59.7%) |
| Public Administration | 1,378 (42.6%) | 1,857 (57.4%) |
| Total | 49,910 (53.1%) | 44,085 (46.9%) |
Education in Vancouver
School Enrollment in Vancouver
The most common levels of schooling among the 41,383 students in Vancouver are elementary school (9,113 | 22.0%), middle school (9,090 | 22.0%), and high school (8,923 | 21.6%).
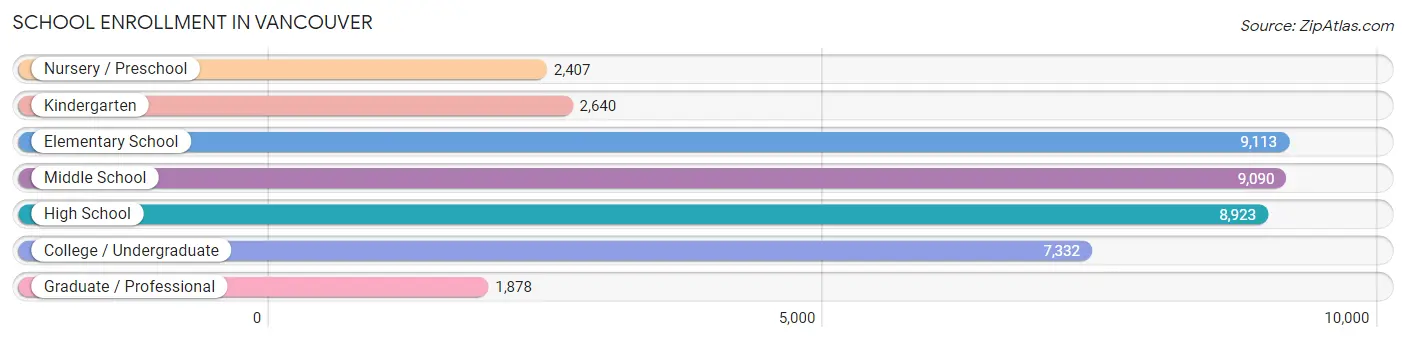
| School Level | # Students | % Students |
| Nursery / Preschool | 2,407 | 5.8% |
| Kindergarten | 2,640 | 6.4% |
| Elementary School | 9,113 | 22.0% |
| Middle School | 9,090 | 22.0% |
| High School | 8,923 | 21.6% |
| College / Undergraduate | 7,332 | 17.7% |
| Graduate / Professional | 1,878 | 4.5% |
| Total | 41,383 | 100.0% |
School Enrollment by Age by Funding Source in Vancouver
Out of a total of 41,383 students who are enrolled in schools in Vancouver, 5,173 (12.5%) attend a private institution, while the remaining 36,210 (87.5%) are enrolled in public schools. The age group of 3 to 4 year olds has the highest likelihood of being enrolled in private schools, with 647 (34.0% in the age bracket) enrolled. Conversely, the age group of 15 to 17 year olds has the lowest likelihood of being enrolled in a private school, with 6,092 (94.9% in the age bracket) attending a public institution.
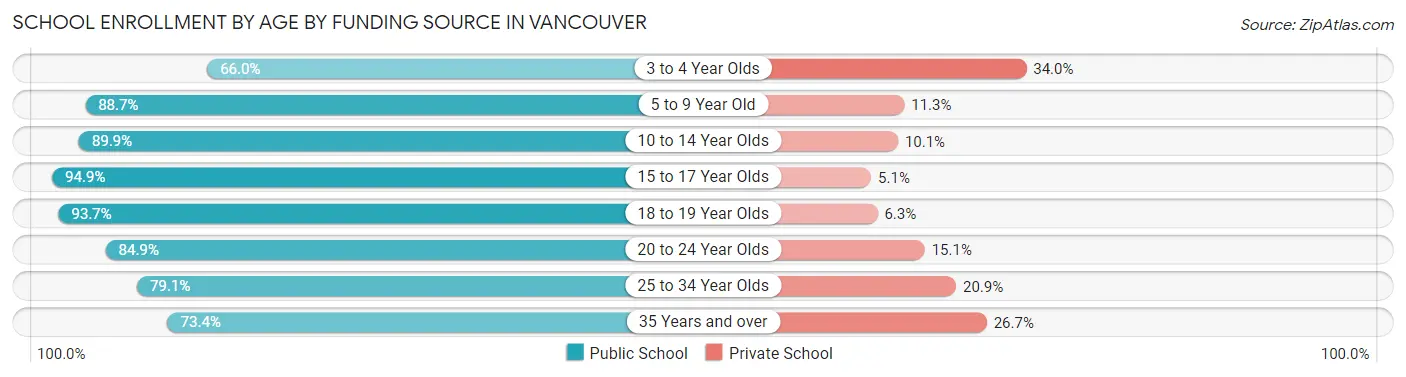
| Age Bracket | Public School | Private School |
| 3 to 4 Year Olds | 1,255 (66.0%) | 647 (34.0%) |
| 5 to 9 Year Old | 9,730 (88.7%) | 1,238 (11.3%) |
| 10 to 14 Year Olds | 10,351 (89.9%) | 1,164 (10.1%) |
| 15 to 17 Year Olds | 6,092 (94.9%) | 329 (5.1%) |
| 18 to 19 Year Olds | 2,335 (93.7%) | 157 (6.3%) |
| 20 to 24 Year Olds | 2,709 (84.9%) | 482 (15.1%) |
| 25 to 34 Year Olds | 2,009 (79.1%) | 532 (20.9%) |
| 35 Years and over | 1,726 (73.4%) | 627 (26.7%) |
| Total | 36,210 (87.5%) | 5,173 (12.5%) |
Educational Attainment by Field of Study in Vancouver
Business (7,703 | 16.7%), social sciences (4,764 | 10.3%), science & technology (4,207 | 9.1%), education (4,120 | 8.9%), and bio, nature & agricultural (3,320 | 7.2%) are the most common fields of study among 46,152 individuals in Vancouver who have obtained a bachelor's degree or higher.
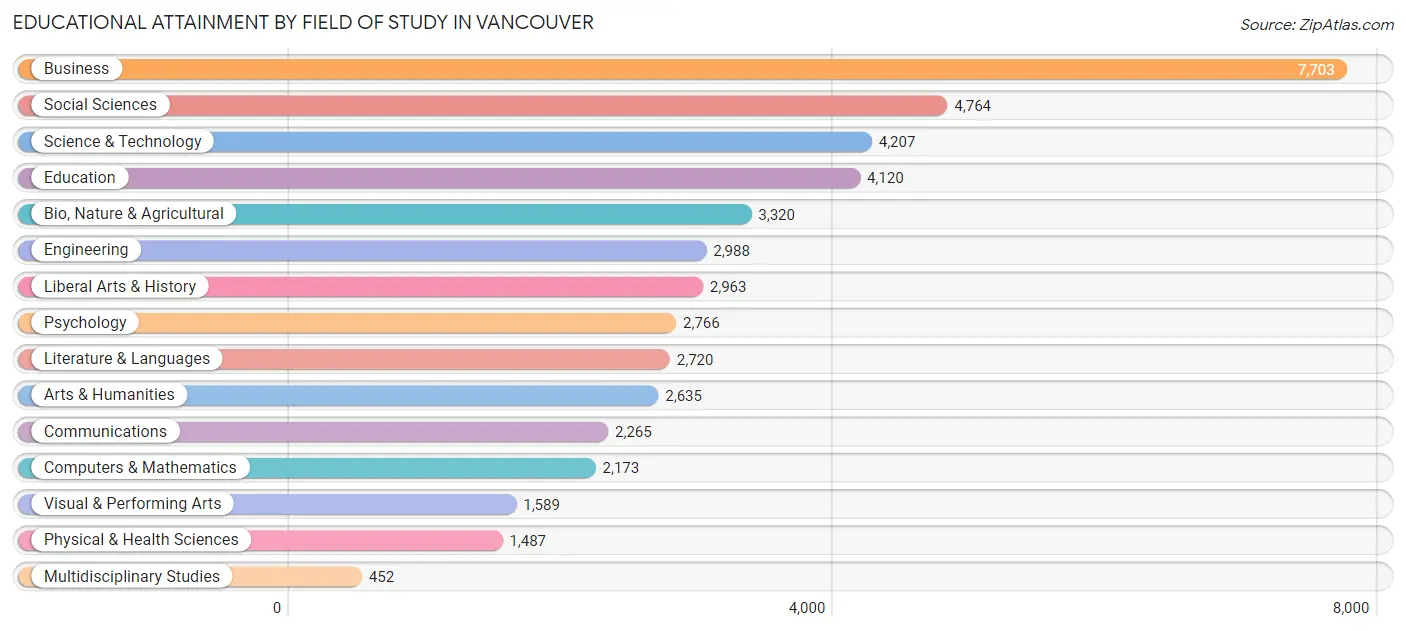
| Field of Study | # Graduates | % Graduates |
| Computers & Mathematics | 2,173 | 4.7% |
| Bio, Nature & Agricultural | 3,320 | 7.2% |
| Physical & Health Sciences | 1,487 | 3.2% |
| Psychology | 2,766 | 6.0% |
| Social Sciences | 4,764 | 10.3% |
| Engineering | 2,988 | 6.5% |
| Multidisciplinary Studies | 452 | 1.0% |
| Science & Technology | 4,207 | 9.1% |
| Business | 7,703 | 16.7% |
| Education | 4,120 | 8.9% |
| Literature & Languages | 2,720 | 5.9% |
| Liberal Arts & History | 2,963 | 6.4% |
| Visual & Performing Arts | 1,589 | 3.4% |
| Communications | 2,265 | 4.9% |
| Arts & Humanities | 2,635 | 5.7% |
| Total | 46,152 | 100.0% |
Transportation & Commute in Vancouver
Vehicle Availability by Sex in Vancouver
The most prevalent vehicle ownership categories in Vancouver are males with 2 vehicles (21,655, accounting for 44.0%) and females with 2 vehicles (17,572, making up 50.3%).
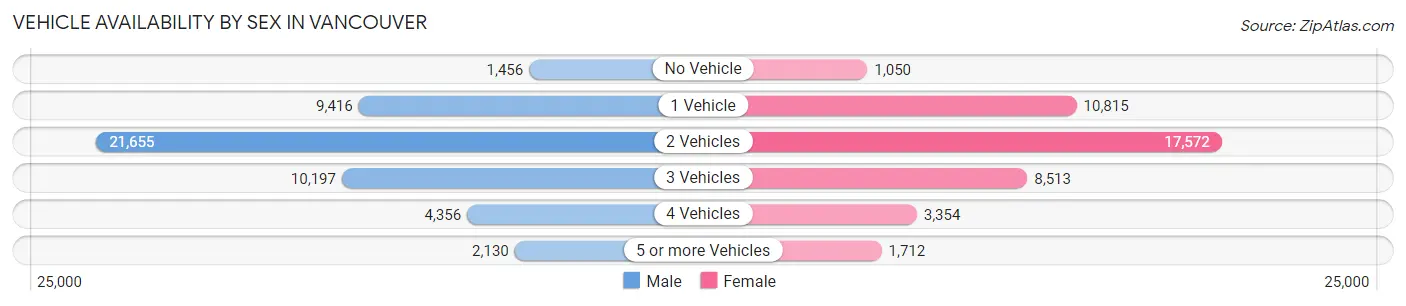
| Vehicles Available | Male | Female |
| No Vehicle | 1,456 (3.0%) | 1,050 (2.4%) |
| 1 Vehicle | 9,416 (19.1%) | 10,815 (25.1%) |
| 2 Vehicles | 21,655 (44.0%) | 17,572 (40.8%) |
| 3 Vehicles | 10,197 (20.7%) | 8,513 (19.8%) |
| 4 Vehicles | 4,356 (8.8%) | 3,354 (7.8%) |
| 5 or more Vehicles | 2,130 (4.3%) | 1,712 (4.0%) |
| Total | 49,210 (100.0%) | 43,016 (100.0%) |
Commute Time in Vancouver
The most frequently occuring commute durations in Vancouver are 15 to 19 minutes (16,043 commuters, 20.2%), 10 to 14 minutes (12,663 commuters, 15.9%), and 20 to 24 minutes (12,138 commuters, 15.2%).
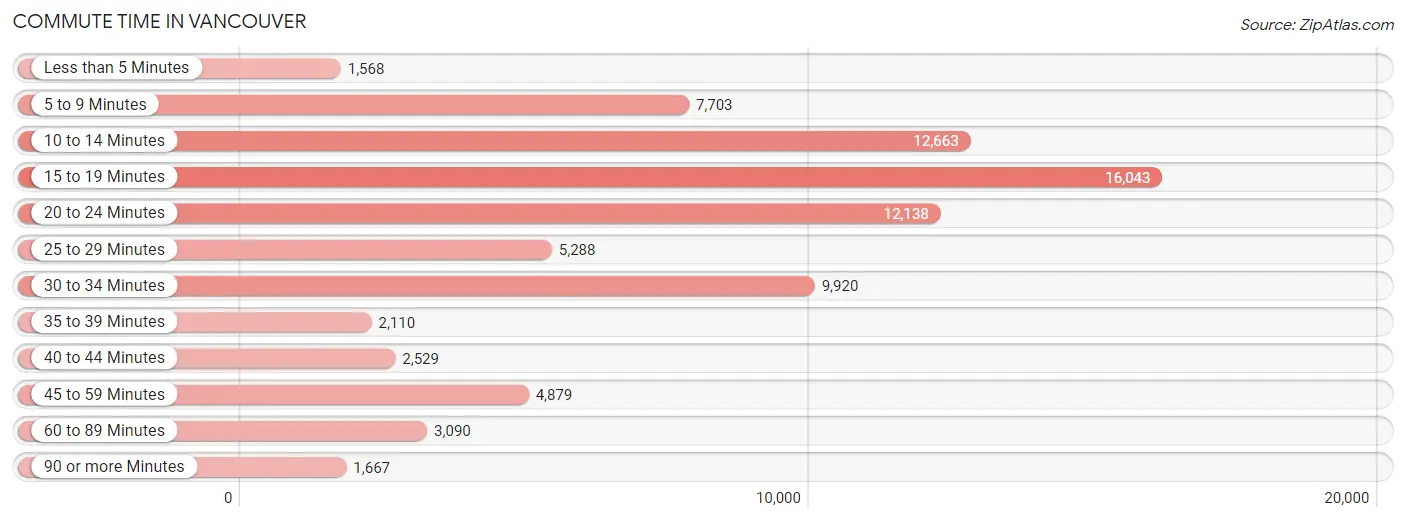
| Commute Time | # Commuters | % Commuters |
| Less than 5 Minutes | 1,568 | 2.0% |
| 5 to 9 Minutes | 7,703 | 9.7% |
| 10 to 14 Minutes | 12,663 | 15.9% |
| 15 to 19 Minutes | 16,043 | 20.2% |
| 20 to 24 Minutes | 12,138 | 15.2% |
| 25 to 29 Minutes | 5,288 | 6.6% |
| 30 to 34 Minutes | 9,920 | 12.5% |
| 35 to 39 Minutes | 2,110 | 2.6% |
| 40 to 44 Minutes | 2,529 | 3.2% |
| 45 to 59 Minutes | 4,879 | 6.1% |
| 60 to 89 Minutes | 3,090 | 3.9% |
| 90 or more Minutes | 1,667 | 2.1% |
Commute Time by Sex in Vancouver
The most common commute times in Vancouver are 15 to 19 minutes (8,639 commuters, 19.9%) for males and 15 to 19 minutes (7,404 commuters, 20.5%) for females.
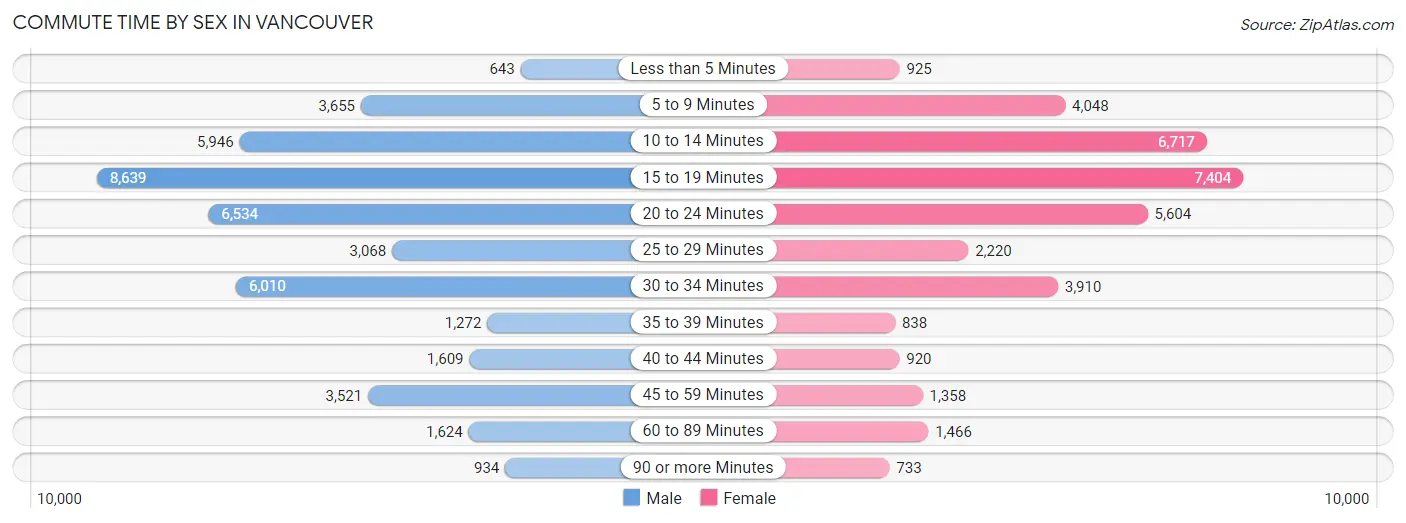
| Commute Time | Male | Female |
| Less than 5 Minutes | 643 (1.5%) | 925 (2.6%) |
| 5 to 9 Minutes | 3,655 (8.4%) | 4,048 (11.2%) |
| 10 to 14 Minutes | 5,946 (13.7%) | 6,717 (18.6%) |
| 15 to 19 Minutes | 8,639 (19.9%) | 7,404 (20.5%) |
| 20 to 24 Minutes | 6,534 (15.0%) | 5,604 (15.5%) |
| 25 to 29 Minutes | 3,068 (7.1%) | 2,220 (6.1%) |
| 30 to 34 Minutes | 6,010 (13.8%) | 3,910 (10.8%) |
| 35 to 39 Minutes | 1,272 (2.9%) | 838 (2.3%) |
| 40 to 44 Minutes | 1,609 (3.7%) | 920 (2.5%) |
| 45 to 59 Minutes | 3,521 (8.1%) | 1,358 (3.8%) |
| 60 to 89 Minutes | 1,624 (3.7%) | 1,466 (4.1%) |
| 90 or more Minutes | 934 (2.1%) | 733 (2.0%) |
Time of Departure to Work by Sex in Vancouver
The most frequent times of departure to work in Vancouver are 7:00 AM to 7:29 AM (5,338, 12.3%) for males and 7:30 AM to 7:59 AM (4,684, 13.0%) for females.
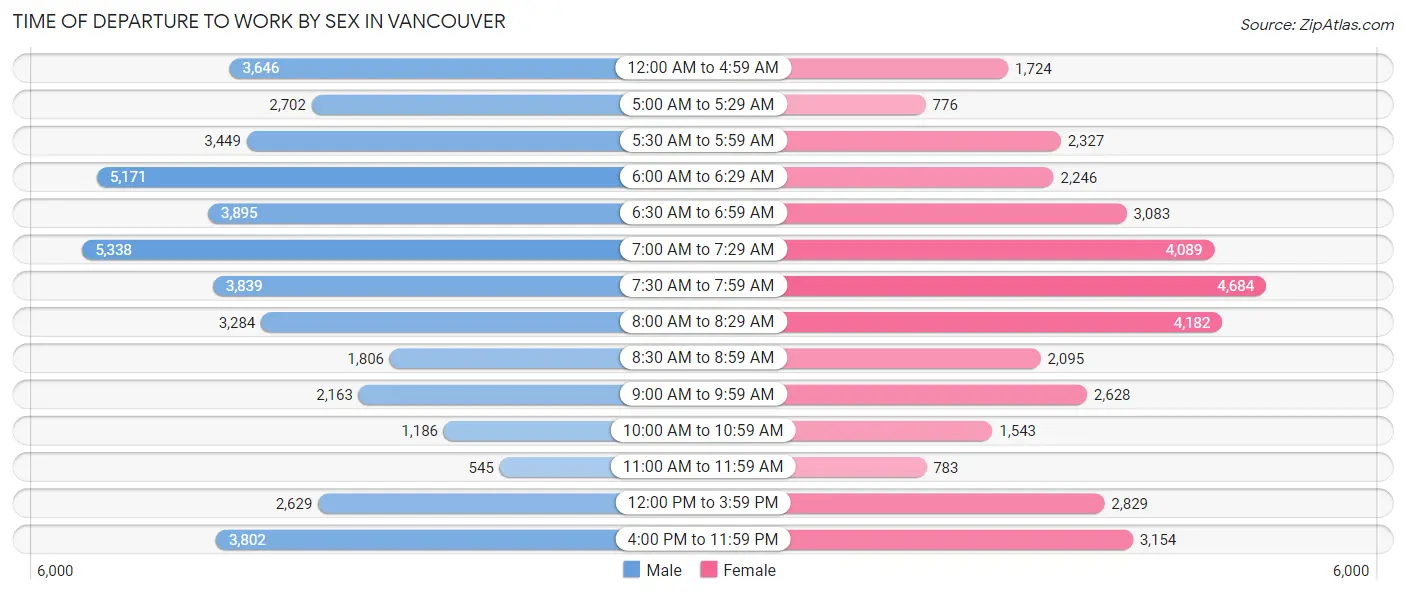
| Time of Departure | Male | Female |
| 12:00 AM to 4:59 AM | 3,646 (8.4%) | 1,724 (4.8%) |
| 5:00 AM to 5:29 AM | 2,702 (6.2%) | 776 (2.1%) |
| 5:30 AM to 5:59 AM | 3,449 (7.9%) | 2,327 (6.4%) |
| 6:00 AM to 6:29 AM | 5,171 (11.9%) | 2,246 (6.2%) |
| 6:30 AM to 6:59 AM | 3,895 (9.0%) | 3,083 (8.5%) |
| 7:00 AM to 7:29 AM | 5,338 (12.3%) | 4,089 (11.3%) |
| 7:30 AM to 7:59 AM | 3,839 (8.8%) | 4,684 (13.0%) |
| 8:00 AM to 8:29 AM | 3,284 (7.6%) | 4,182 (11.6%) |
| 8:30 AM to 8:59 AM | 1,806 (4.2%) | 2,095 (5.8%) |
| 9:00 AM to 9:59 AM | 2,163 (5.0%) | 2,628 (7.3%) |
| 10:00 AM to 10:59 AM | 1,186 (2.7%) | 1,543 (4.3%) |
| 11:00 AM to 11:59 AM | 545 (1.3%) | 783 (2.2%) |
| 12:00 PM to 3:59 PM | 2,629 (6.0%) | 2,829 (7.8%) |
| 4:00 PM to 11:59 PM | 3,802 (8.7%) | 3,154 (8.7%) |
| Total | 43,455 (100.0%) | 36,143 (100.0%) |
Housing Occupancy in Vancouver
Occupancy by Ownership in Vancouver
Of the total 77,418 dwellings in Vancouver, owner-occupied units account for 39,393 (50.9%), while renter-occupied units make up 38,025 (49.1%).
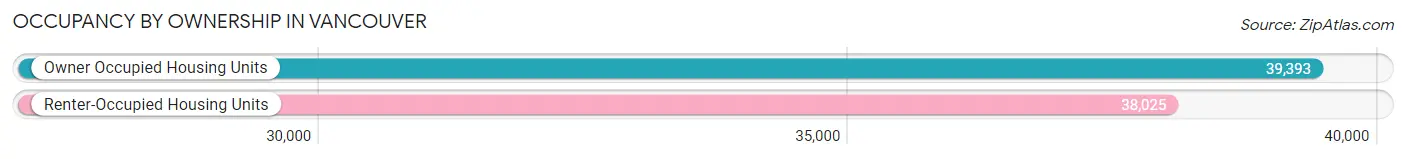
| Occupancy | # Housing Units | % Housing Units |
| Owner Occupied Housing Units | 39,393 | 50.9% |
| Renter-Occupied Housing Units | 38,025 | 49.1% |
| Total Occupied Housing Units | 77,418 | 100.0% |
Occupancy by Household Size in Vancouver
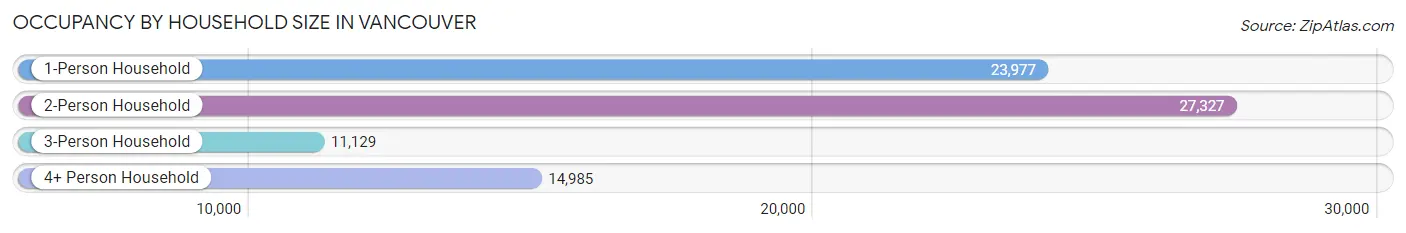
| Household Size | # Housing Units | % Housing Units |
| 1-Person Household | 23,977 | 31.0% |
| 2-Person Household | 27,327 | 35.3% |
| 3-Person Household | 11,129 | 14.4% |
| 4+ Person Household | 14,985 | 19.4% |
| Total Housing Units | 77,418 | 100.0% |
Occupancy by Ownership by Household Size in Vancouver
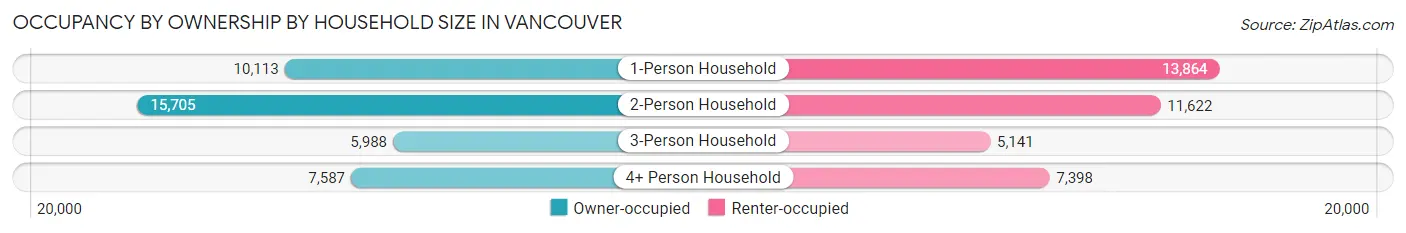
| Household Size | Owner-occupied | Renter-occupied |
| 1-Person Household | 10,113 (42.2%) | 13,864 (57.8%) |
| 2-Person Household | 15,705 (57.5%) | 11,622 (42.5%) |
| 3-Person Household | 5,988 (53.8%) | 5,141 (46.2%) |
| 4+ Person Household | 7,587 (50.6%) | 7,398 (49.4%) |
| Total Housing Units | 39,393 (50.9%) | 38,025 (49.1%) |
Occupancy by Educational Attainment in Vancouver
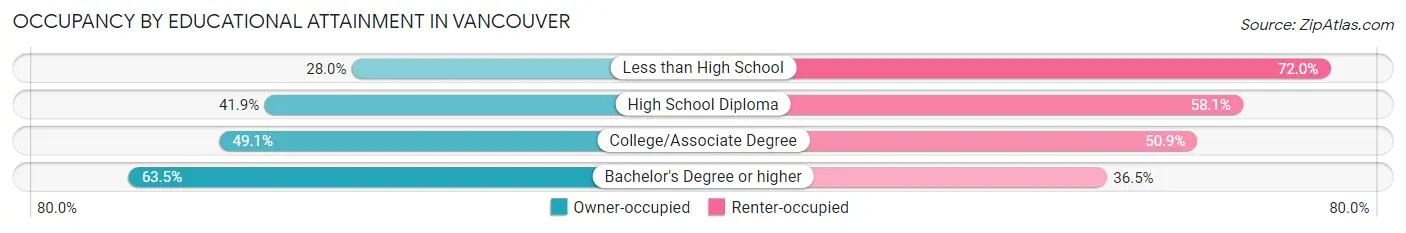
| Household Size | Owner-occupied | Renter-occupied |
| Less than High School | 1,494 (28.0%) | 3,838 (72.0%) |
| High School Diploma | 6,823 (41.9%) | 9,476 (58.1%) |
| College/Associate Degree | 14,754 (49.1%) | 15,322 (50.9%) |
| Bachelor's Degree or higher | 16,322 (63.5%) | 9,389 (36.5%) |
Occupancy by Age of Householder in Vancouver
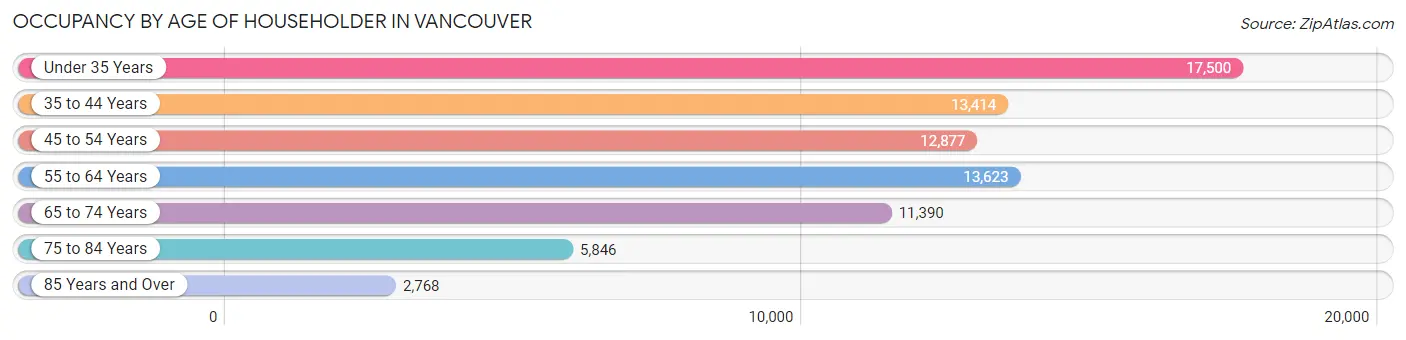
| Age Bracket | # Households | % Households |
| Under 35 Years | 17,500 | 22.6% |
| 35 to 44 Years | 13,414 | 17.3% |
| 45 to 54 Years | 12,877 | 16.6% |
| 55 to 64 Years | 13,623 | 17.6% |
| 65 to 74 Years | 11,390 | 14.7% |
| 75 to 84 Years | 5,846 | 7.5% |
| 85 Years and Over | 2,768 | 3.6% |
| Total | 77,418 | 100.0% |
Housing Finances in Vancouver
Median Income by Occupancy in Vancouver
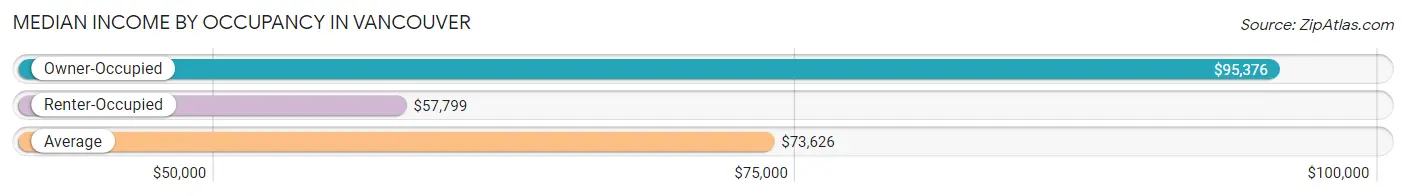
| Occupancy Type | # Households | Median Income |
| Owner-Occupied | 39,393 (50.9%) | $95,376 |
| Renter-Occupied | 38,025 (49.1%) | $57,799 |
| Average | 77,418 (100.0%) | $73,626 |
Occupancy by Householder Income Bracket in Vancouver
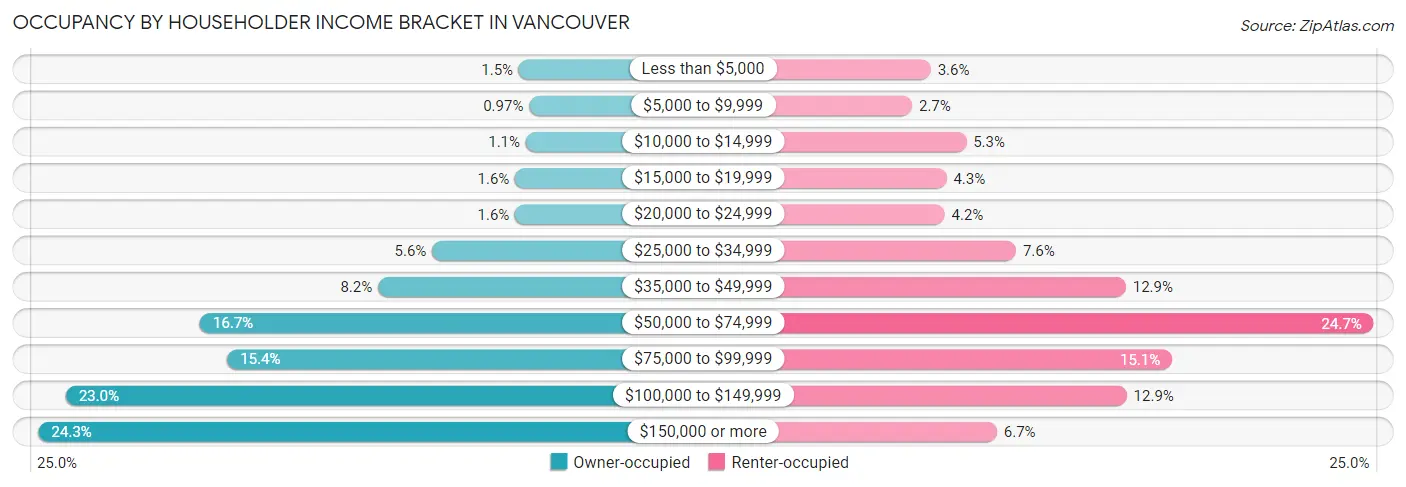
| Income Bracket | Owner-occupied | Renter-occupied |
| Less than $5,000 | 576 (1.5%) | 1,361 (3.6%) |
| $5,000 to $9,999 | 384 (1.0%) | 1,024 (2.7%) |
| $10,000 to $14,999 | 447 (1.1%) | 2,003 (5.3%) |
| $15,000 to $19,999 | 647 (1.6%) | 1,647 (4.3%) |
| $20,000 to $24,999 | 646 (1.6%) | 1,611 (4.2%) |
| $25,000 to $34,999 | 2,203 (5.6%) | 2,906 (7.6%) |
| $35,000 to $49,999 | 3,217 (8.2%) | 4,895 (12.9%) |
| $50,000 to $74,999 | 6,559 (16.7%) | 9,379 (24.7%) |
| $75,000 to $99,999 | 6,046 (15.3%) | 5,731 (15.1%) |
| $100,000 to $149,999 | 9,078 (23.0%) | 4,910 (12.9%) |
| $150,000 or more | 9,590 (24.3%) | 2,558 (6.7%) |
| Total | 39,393 (100.0%) | 38,025 (100.0%) |
Monthly Housing Cost Tiers in Vancouver
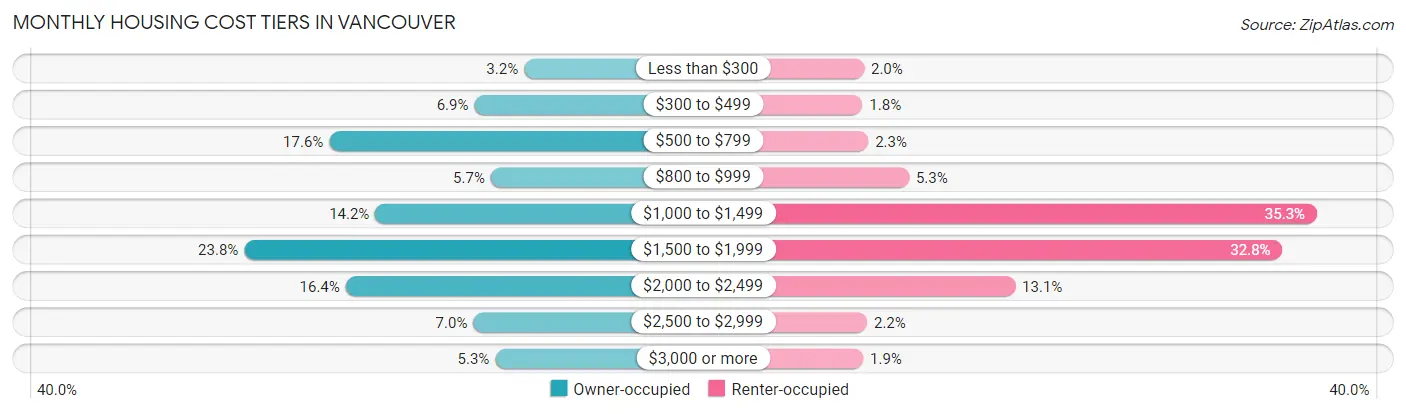
| Monthly Cost | Owner-occupied | Renter-occupied |
| Less than $300 | 1,270 (3.2%) | 747 (2.0%) |
| $300 to $499 | 2,709 (6.9%) | 698 (1.8%) |
| $500 to $799 | 6,921 (17.6%) | 863 (2.3%) |
| $800 to $999 | 2,235 (5.7%) | 2,003 (5.3%) |
| $1,000 to $1,499 | 5,584 (14.2%) | 13,425 (35.3%) |
| $1,500 to $1,999 | 9,387 (23.8%) | 12,460 (32.8%) |
| $2,000 to $2,499 | 6,443 (16.4%) | 4,977 (13.1%) |
| $2,500 to $2,999 | 2,742 (7.0%) | 828 (2.2%) |
| $3,000 or more | 2,102 (5.3%) | 717 (1.9%) |
| Total | 39,393 (100.0%) | 38,025 (100.0%) |
Physical Housing Characteristics in Vancouver
Housing Structures in Vancouver
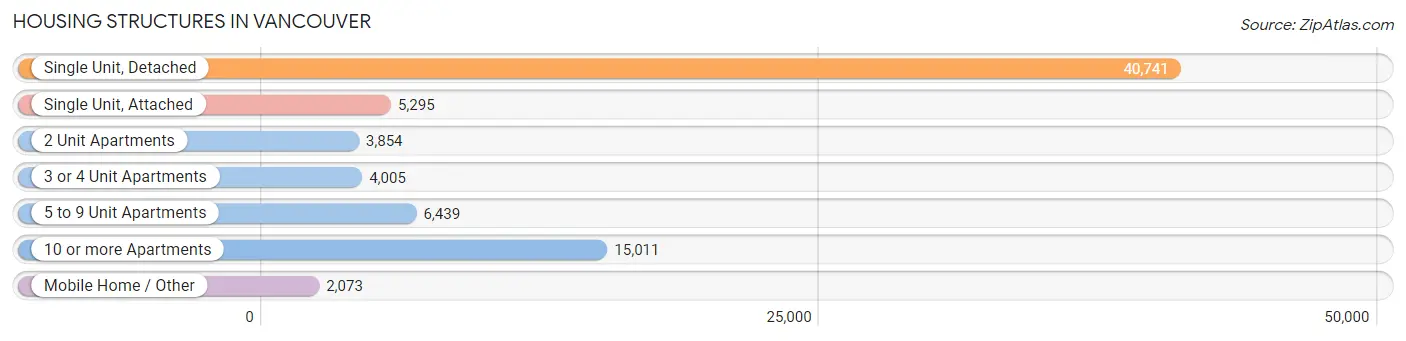
| Structure Type | # Housing Units | % Housing Units |
| Single Unit, Detached | 40,741 | 52.6% |
| Single Unit, Attached | 5,295 | 6.8% |
| 2 Unit Apartments | 3,854 | 5.0% |
| 3 or 4 Unit Apartments | 4,005 | 5.2% |
| 5 to 9 Unit Apartments | 6,439 | 8.3% |
| 10 or more Apartments | 15,011 | 19.4% |
| Mobile Home / Other | 2,073 | 2.7% |
| Total | 77,418 | 100.0% |
Housing Structures by Occupancy in Vancouver
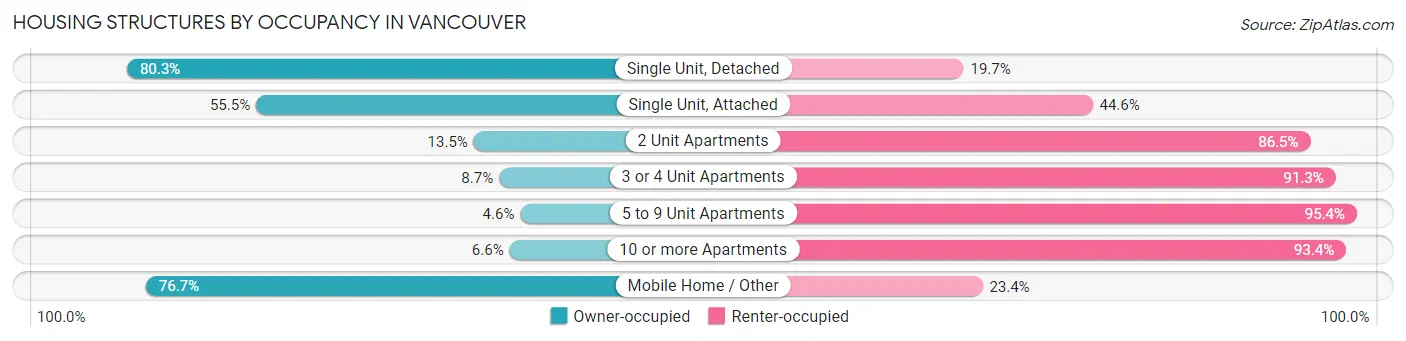
| Structure Type | Owner-occupied | Renter-occupied |
| Single Unit, Detached | 32,709 (80.3%) | 8,032 (19.7%) |
| Single Unit, Attached | 2,936 (55.4%) | 2,359 (44.6%) |
| 2 Unit Apartments | 522 (13.5%) | 3,332 (86.5%) |
| 3 or 4 Unit Apartments | 347 (8.7%) | 3,658 (91.3%) |
| 5 to 9 Unit Apartments | 294 (4.6%) | 6,145 (95.4%) |
| 10 or more Apartments | 996 (6.6%) | 14,015 (93.4%) |
| Mobile Home / Other | 1,589 (76.6%) | 484 (23.4%) |
| Total | 39,393 (50.9%) | 38,025 (49.1%) |
Housing Structures by Number of Rooms in Vancouver
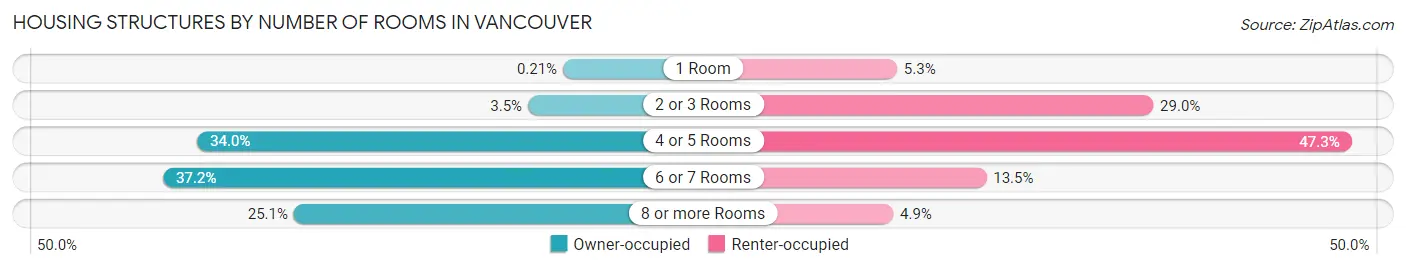
| Number of Rooms | Owner-occupied | Renter-occupied |
| 1 Room | 81 (0.2%) | 2,004 (5.3%) |
| 2 or 3 Rooms | 1,360 (3.5%) | 11,015 (29.0%) |
| 4 or 5 Rooms | 13,408 (34.0%) | 17,990 (47.3%) |
| 6 or 7 Rooms | 14,655 (37.2%) | 5,147 (13.5%) |
| 8 or more Rooms | 9,889 (25.1%) | 1,869 (4.9%) |
| Total | 39,393 (100.0%) | 38,025 (100.0%) |
Housing Structure by Heating Type in Vancouver
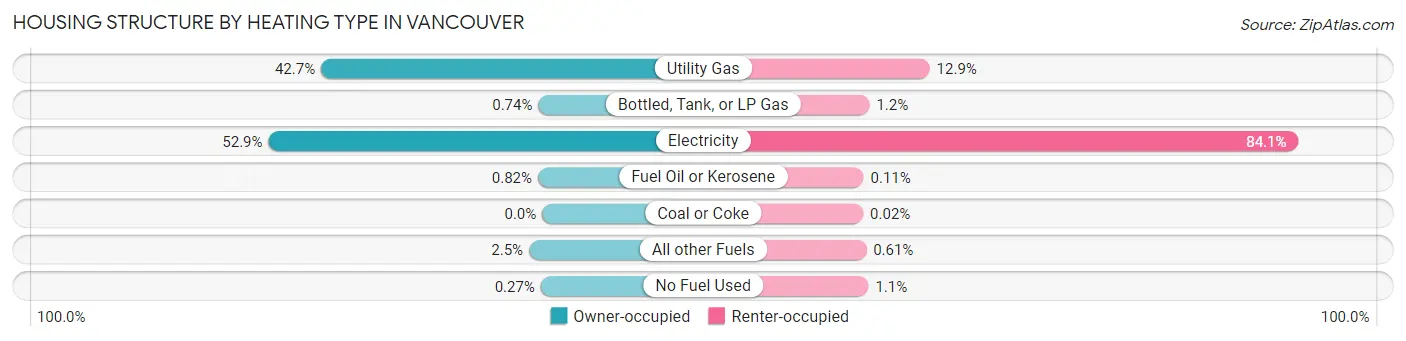
| Heating Type | Owner-occupied | Renter-occupied |
| Utility Gas | 16,833 (42.7%) | 4,893 (12.9%) |
| Bottled, Tank, or LP Gas | 290 (0.7%) | 470 (1.2%) |
| Electricity | 20,839 (52.9%) | 31,980 (84.1%) |
| Fuel Oil or Kerosene | 322 (0.8%) | 40 (0.1%) |
| Coal or Coke | 0 (0.0%) | 8 (0.0%) |
| All other Fuels | 1,001 (2.5%) | 233 (0.6%) |
| No Fuel Used | 108 (0.3%) | 401 (1.1%) |
| Total | 39,393 (100.0%) | 38,025 (100.0%) |
Household Vehicle Usage in Vancouver
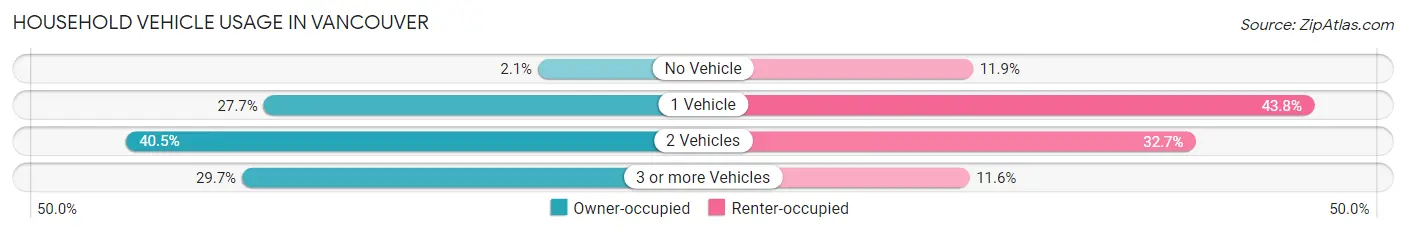
| Vehicles per Household | Owner-occupied | Renter-occupied |
| No Vehicle | 821 (2.1%) | 4,538 (11.9%) |
| 1 Vehicle | 10,910 (27.7%) | 16,638 (43.8%) |
| 2 Vehicles | 15,960 (40.5%) | 12,437 (32.7%) |
| 3 or more Vehicles | 11,702 (29.7%) | 4,412 (11.6%) |
| Total | 39,393 (100.0%) | 38,025 (100.0%) |
Real Estate & Mortgages in Vancouver
Real Estate and Mortgage Overview in Vancouver
| Characteristic | Without Mortgage | With Mortgage |
| Housing Units | 12,926 | 26,467 |
| Median Property Value | $399,100 | $405,300 |
| Median Household Income | $69,090 | $7,411 |
| Monthly Housing Costs | $607 | $2,017 |
| Real Estate Taxes | $3,553 | $579 |
Property Value by Mortgage Status in Vancouver
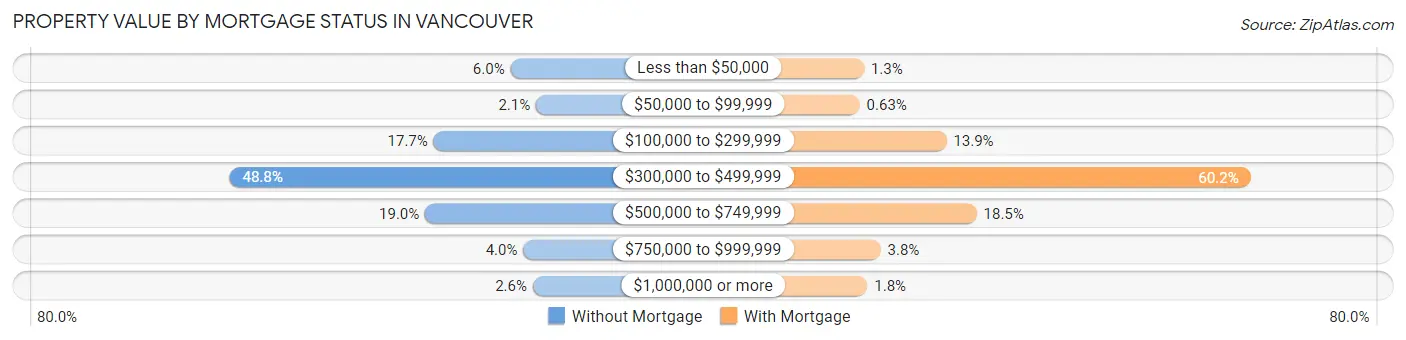
| Property Value | Without Mortgage | With Mortgage |
| Less than $50,000 | 770 (6.0%) | 338 (1.3%) |
| $50,000 to $99,999 | 267 (2.1%) | 168 (0.6%) |
| $100,000 to $299,999 | 2,284 (17.7%) | 3,665 (13.9%) |
| $300,000 to $499,999 | 6,304 (48.8%) | 15,927 (60.2%) |
| $500,000 to $749,999 | 2,452 (19.0%) | 4,883 (18.4%) |
| $750,000 to $999,999 | 518 (4.0%) | 1,010 (3.8%) |
| $1,000,000 or more | 331 (2.6%) | 476 (1.8%) |
| Total | 12,926 (100.0%) | 26,467 (100.0%) |
Household Income by Mortgage Status in Vancouver
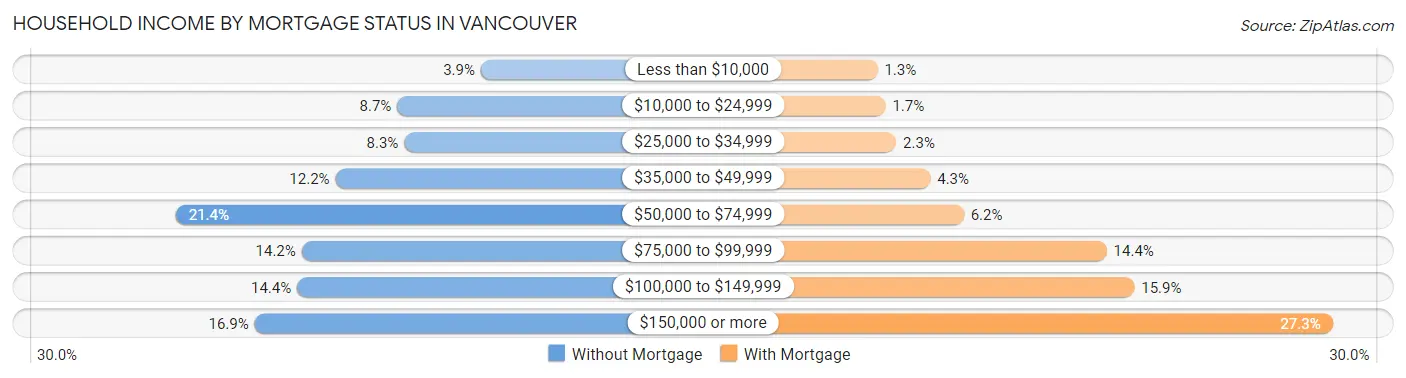
| Household Income | Without Mortgage | With Mortgage |
| Less than $10,000 | 508 (3.9%) | 332 (1.3%) |
| $10,000 to $24,999 | 1,126 (8.7%) | 452 (1.7%) |
| $25,000 to $34,999 | 1,074 (8.3%) | 614 (2.3%) |
| $35,000 to $49,999 | 1,582 (12.2%) | 1,129 (4.3%) |
| $50,000 to $74,999 | 2,761 (21.4%) | 1,635 (6.2%) |
| $75,000 to $99,999 | 1,831 (14.2%) | 3,798 (14.3%) |
| $100,000 to $149,999 | 1,865 (14.4%) | 4,215 (15.9%) |
| $150,000 or more | 2,179 (16.9%) | 7,213 (27.3%) |
| Total | 12,926 (100.0%) | 26,467 (100.0%) |
Property Value to Household Income Ratio in Vancouver
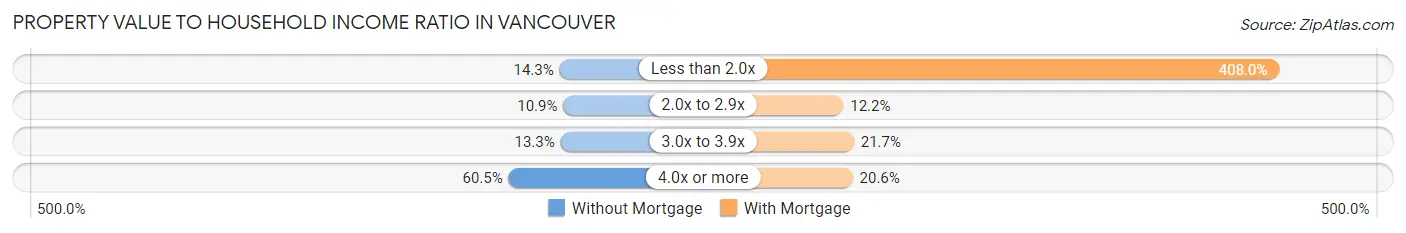
| Value-to-Income Ratio | Without Mortgage | With Mortgage |
| Less than 2.0x | 1,845 (14.3%) | 107,987 (408.0%) |
| 2.0x to 2.9x | 1,402 (10.8%) | 3,219 (12.2%) |
| 3.0x to 3.9x | 1,720 (13.3%) | 5,741 (21.7%) |
| 4.0x or more | 7,825 (60.5%) | 5,457 (20.6%) |
| Total | 12,926 (100.0%) | 26,467 (100.0%) |
Real Estate Taxes by Mortgage Status in Vancouver
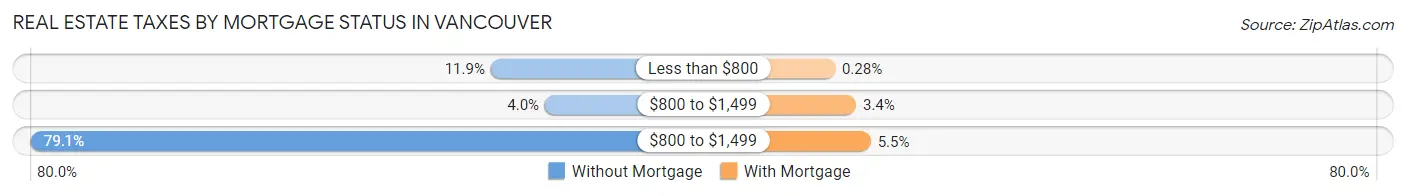
| Property Taxes | Without Mortgage | With Mortgage |
| Less than $800 | 1,537 (11.9%) | 74 (0.3%) |
| $800 to $1,499 | 513 (4.0%) | 888 (3.4%) |
| $800 to $1,499 | 10,222 (79.1%) | 1,457 (5.5%) |
| Total | 12,926 (100.0%) | 26,467 (100.0%) |
Health & Disability in Vancouver
Health Insurance Coverage by Age in Vancouver
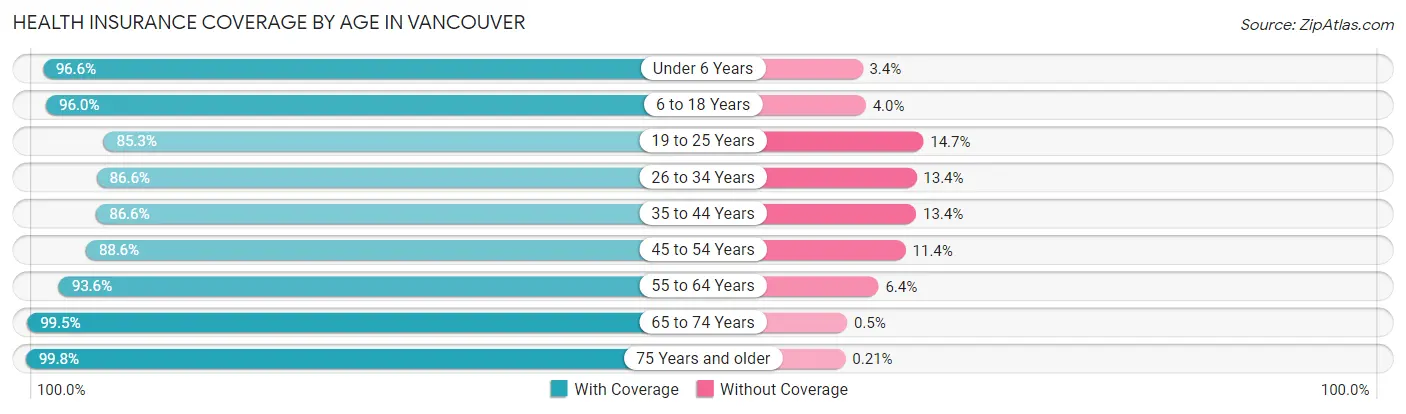
| Age Bracket | With Coverage | Without Coverage |
| Under 6 Years | 12,785 (96.6%) | 448 (3.4%) |
| 6 to 18 Years | 28,877 (96.0%) | 1,202 (4.0%) |
| 19 to 25 Years | 15,329 (85.3%) | 2,649 (14.7%) |
| 26 to 34 Years | 23,170 (86.6%) | 3,599 (13.4%) |
| 35 to 44 Years | 22,374 (86.6%) | 3,456 (13.4%) |
| 45 to 54 Years | 19,894 (88.6%) | 2,567 (11.4%) |
| 55 to 64 Years | 21,239 (93.6%) | 1,448 (6.4%) |
| 65 to 74 Years | 17,999 (99.5%) | 91 (0.5%) |
| 75 Years and older | 12,148 (99.8%) | 25 (0.2%) |
| Total | 173,815 (91.8%) | 15,485 (8.2%) |
Health Insurance Coverage by Citizenship Status in Vancouver
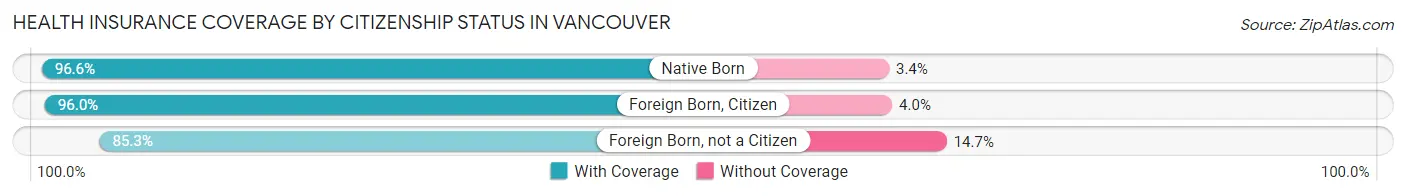
| Citizenship Status | With Coverage | Without Coverage |
| Native Born | 12,785 (96.6%) | 448 (3.4%) |
| Foreign Born, Citizen | 28,877 (96.0%) | 1,202 (4.0%) |
| Foreign Born, not a Citizen | 15,329 (85.3%) | 2,649 (14.7%) |
Health Insurance Coverage by Household Income in Vancouver
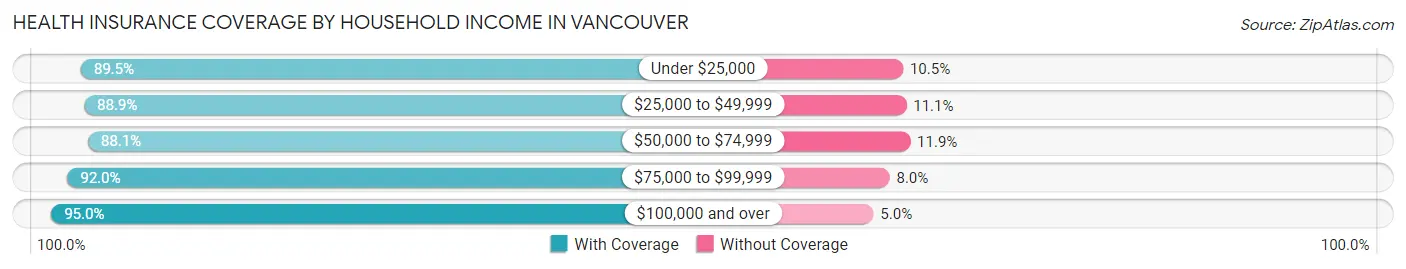
| Household Income | With Coverage | Without Coverage |
| Under $25,000 | 14,687 (89.5%) | 1,729 (10.5%) |
| $25,000 to $49,999 | 23,590 (88.9%) | 2,956 (11.1%) |
| $50,000 to $74,999 | 33,364 (88.1%) | 4,495 (11.9%) |
| $75,000 to $99,999 | 27,752 (92.0%) | 2,416 (8.0%) |
| $100,000 and over | 73,059 (95.0%) | 3,839 (5.0%) |
Public vs Private Health Insurance Coverage by Age in Vancouver
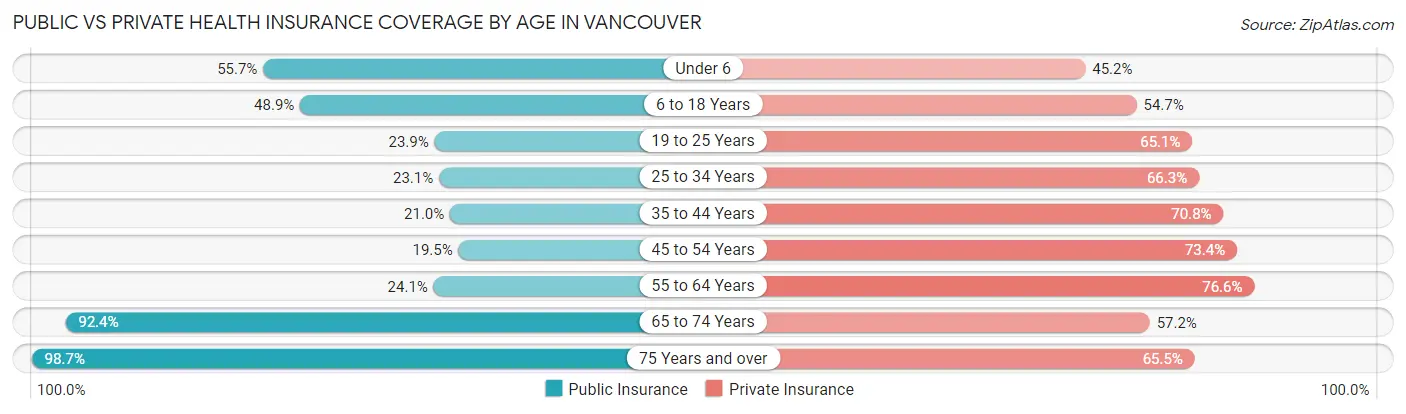
| Age Bracket | Public Insurance | Private Insurance |
| Under 6 | 7,372 (55.7%) | 5,981 (45.2%) |
| 6 to 18 Years | 14,693 (48.8%) | 16,455 (54.7%) |
| 19 to 25 Years | 4,299 (23.9%) | 11,695 (65.0%) |
| 25 to 34 Years | 6,175 (23.1%) | 17,746 (66.3%) |
| 35 to 44 Years | 5,429 (21.0%) | 18,295 (70.8%) |
| 45 to 54 Years | 4,372 (19.5%) | 16,476 (73.4%) |
| 55 to 64 Years | 5,461 (24.1%) | 17,370 (76.6%) |
| 65 to 74 Years | 16,723 (92.4%) | 10,338 (57.2%) |
| 75 Years and over | 12,015 (98.7%) | 7,973 (65.5%) |
| Total | 76,539 (40.4%) | 122,329 (64.6%) |
Disability Status by Sex by Age in Vancouver
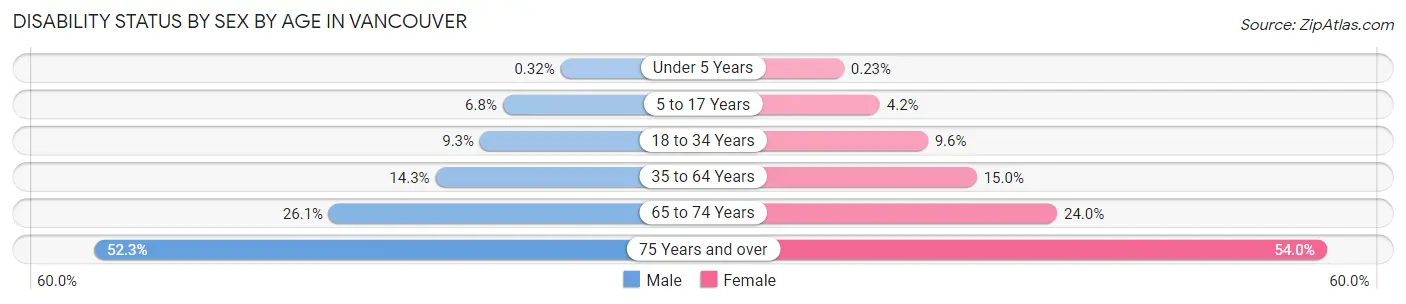
| Age Bracket | Male | Female |
| Under 5 Years | 20 (0.3%) | 11 (0.2%) |
| 5 to 17 Years | 1,015 (6.8%) | 640 (4.2%) |
| 18 to 34 Years | 2,201 (9.3%) | 2,232 (9.6%) |
| 35 to 64 Years | 5,030 (14.2%) | 5,361 (15.0%) |
| 65 to 74 Years | 2,164 (26.1%) | 2,350 (24.0%) |
| 75 Years and over | 2,497 (52.3%) | 3,992 (54.0%) |
Disability Class by Sex by Age in Vancouver
Disability Class: Hearing Difficulty
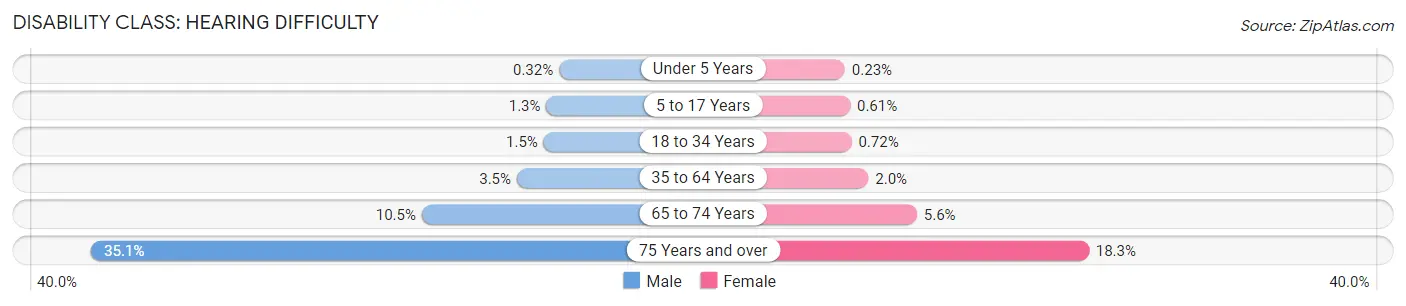
| Age Bracket | Male | Female |
| Under 5 Years | 20 (0.3%) | 11 (0.2%) |
| 5 to 17 Years | 189 (1.3%) | 92 (0.6%) |
| 18 to 34 Years | 346 (1.5%) | 167 (0.7%) |
| 35 to 64 Years | 1,217 (3.5%) | 702 (2.0%) |
| 65 to 74 Years | 871 (10.5%) | 546 (5.6%) |
| 75 Years and over | 1,675 (35.1%) | 1,356 (18.3%) |
Disability Class: Vision Difficulty
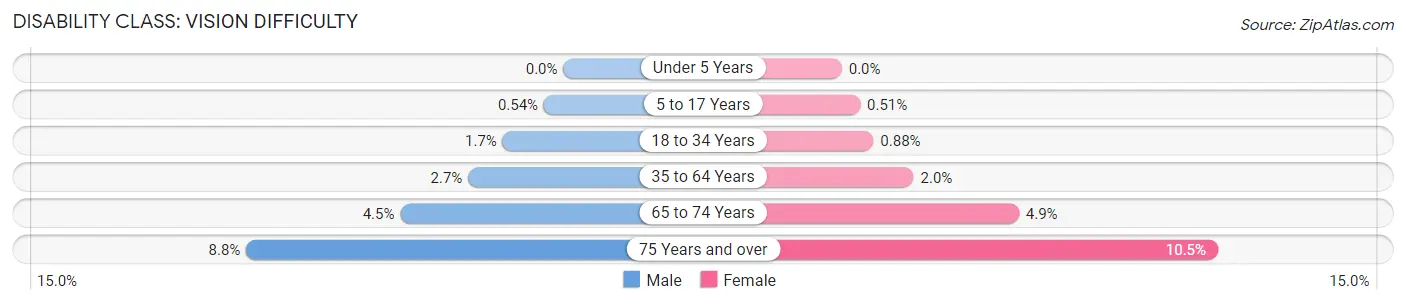
| Age Bracket | Male | Female |
| Under 5 Years | 0 (0.0%) | 0 (0.0%) |
| 5 to 17 Years | 81 (0.5%) | 77 (0.5%) |
| 18 to 34 Years | 401 (1.7%) | 205 (0.9%) |
| 35 to 64 Years | 937 (2.6%) | 715 (2.0%) |
| 65 to 74 Years | 376 (4.5%) | 483 (4.9%) |
| 75 Years and over | 422 (8.8%) | 774 (10.5%) |
Disability Class: Cognitive Difficulty
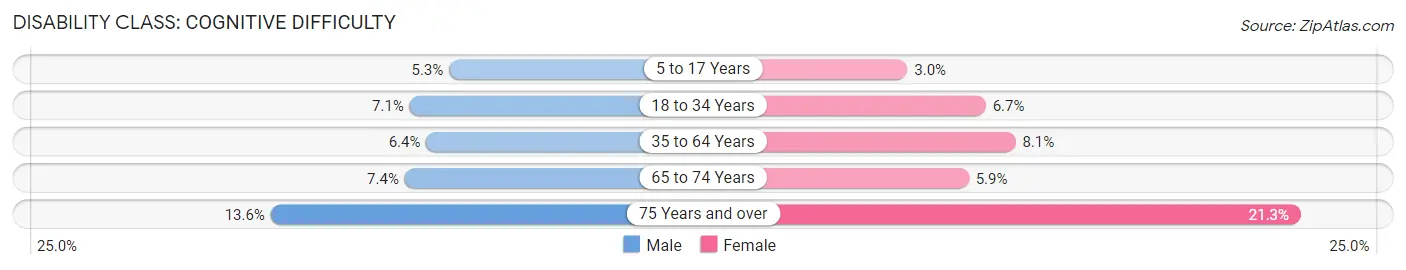
| Age Bracket | Male | Female |
| 5 to 17 Years | 796 (5.3%) | 459 (3.0%) |
| 18 to 34 Years | 1,688 (7.1%) | 1,559 (6.7%) |
| 35 to 64 Years | 2,245 (6.4%) | 2,875 (8.1%) |
| 65 to 74 Years | 610 (7.4%) | 577 (5.9%) |
| 75 Years and over | 649 (13.6%) | 1,575 (21.3%) |
Disability Class: Ambulatory Difficulty
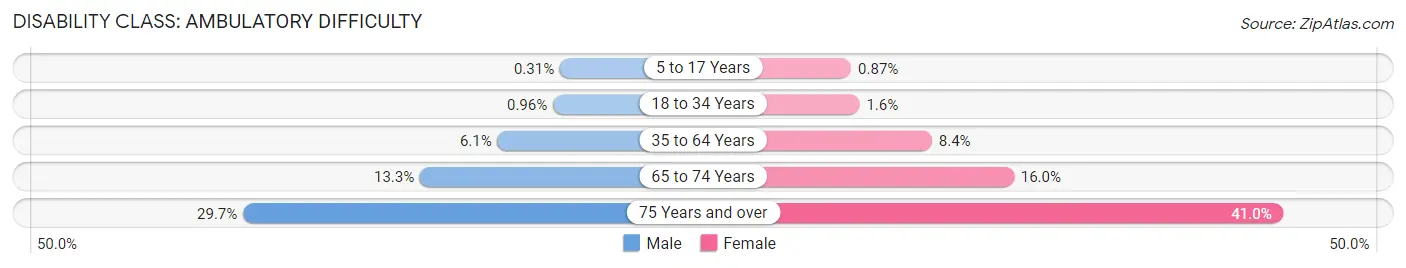
| Age Bracket | Male | Female |
| 5 to 17 Years | 46 (0.3%) | 131 (0.9%) |
| 18 to 34 Years | 228 (1.0%) | 383 (1.6%) |
| 35 to 64 Years | 2,158 (6.1%) | 2,984 (8.4%) |
| 65 to 74 Years | 1,102 (13.3%) | 1,565 (16.0%) |
| 75 Years and over | 1,420 (29.7%) | 3,031 (41.0%) |
Disability Class: Self-Care Difficulty
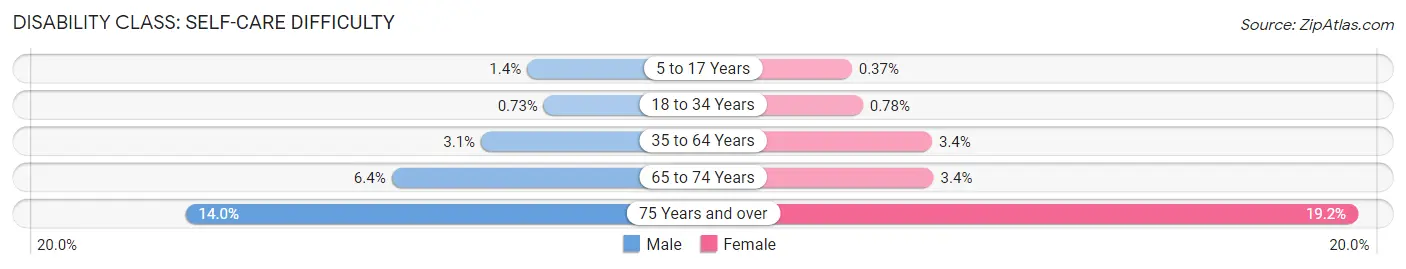
| Age Bracket | Male | Female |
| 5 to 17 Years | 203 (1.3%) | 56 (0.4%) |
| 18 to 34 Years | 173 (0.7%) | 181 (0.8%) |
| 35 to 64 Years | 1,079 (3.1%) | 1,196 (3.4%) |
| 65 to 74 Years | 529 (6.4%) | 334 (3.4%) |
| 75 Years and over | 670 (14.0%) | 1,417 (19.2%) |
Technology Access in Vancouver
Computing Device Access in Vancouver
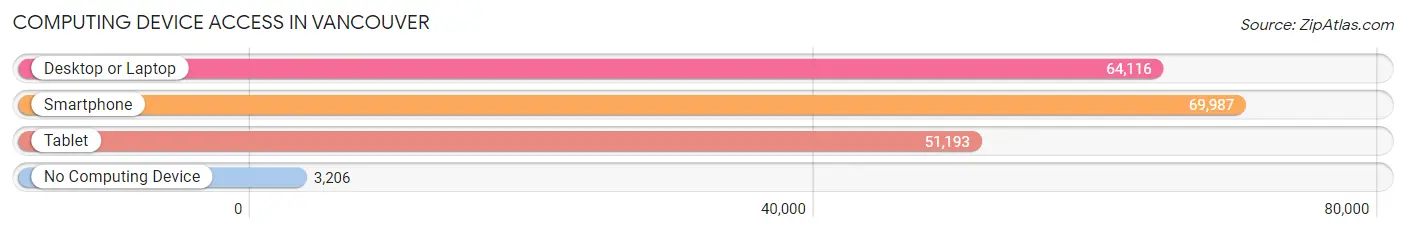
| Device Type | # Households | % Households |
| Desktop or Laptop | 64,116 | 82.8% |
| Smartphone | 69,987 | 90.4% |
| Tablet | 51,193 | 66.1% |
| No Computing Device | 3,206 | 4.1% |
| Total | 77,418 | 100.0% |
Internet Access in Vancouver
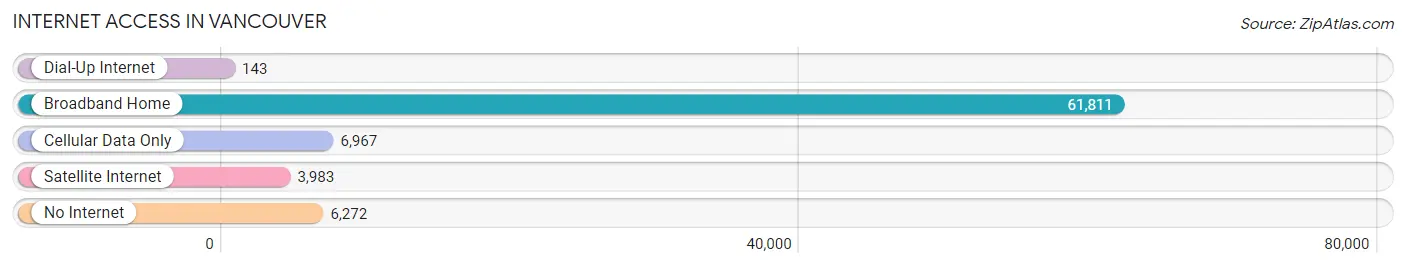
| Internet Type | # Households | % Households |
| Dial-Up Internet | 143 | 0.2% |
| Broadband Home | 61,811 | 79.8% |
| Cellular Data Only | 6,967 | 9.0% |
| Satellite Internet | 3,983 | 5.1% |
| No Internet | 6,272 | 8.1% |
| Total | 77,418 | 100.0% |
Vancouver Summary
Vancouver, Washington is a city located in the southwestern part of the state, just north of the Columbia River and across from Portland, Oregon. It is the fourth-largest city in the state, with a population of over 170,000 people. Vancouver is a vibrant and diverse city, with a rich history, diverse geography, and a strong economy.
History
Vancouver was first settled in 1825 by the Hudson’s Bay Company, who established Fort Vancouver as a fur trading post. The fort was the first permanent European settlement in the Pacific Northwest. The city was officially incorporated in 1857, and was named after Captain George Vancouver, a British explorer who explored the area in the late 1700s.
In the late 1800s, Vancouver became a major port city, with the arrival of the Northern Pacific Railway. The city was also a major center for the timber industry, and was home to several large sawmills.
In the early 1900s, Vancouver experienced a period of rapid growth, as the city became a major center for the shipbuilding industry. During World War II, the city was home to several large shipyards, which produced hundreds of ships for the war effort.
Geography
Vancouver is located in the southwestern part of the state, just north of the Columbia River and across from Portland, Oregon. The city is situated in a valley, surrounded by hills and mountains. The Cascade Mountains are located to the east, and the Coast Range is located to the west.
The city is divided into several distinct neighborhoods, including Downtown, Uptown, and East Vancouver. Downtown is the city’s commercial and cultural center, and is home to many of the city’s major attractions, including the Vancouver Art Gallery and the Vancouver Aquarium. Uptown is the city’s residential area, and is home to many of the city’s historic neighborhoods. East Vancouver is the city’s industrial area, and is home to many of the city’s major employers.
Economy
Vancouver’s economy is largely based on the service sector, with the largest employers being healthcare, retail, and education. The city is also home to several major corporations, including Intel, Hewlett-Packard, and Kaiser Permanente.
The city is also home to several major industries, including shipbuilding, timber, and technology. The city is home to several major shipyards, including the Vancouver Shipyards, which produces ships for the Canadian Navy. The city is also home to several major timber companies, including Weyerhaeuser and Georgia-Pacific.
Demographics
As of the 2010 census, Vancouver had a population of 161,791 people. The city is racially and ethnically diverse, with the largest racial groups being White (77.2%), Hispanic or Latino (7.7%), Asian (6.2%), and African American (3.3%).
The city is also home to a large number of immigrants, with the largest immigrant groups being from Mexico (14.2%), China (7.2%), and India (3.2%). The city is also home to a large number of refugees, with the largest refugee groups being from Iraq (2.2%), Somalia (1.2%), and Afghanistan (1.1%).
Conclusion
Vancouver, Washington is a vibrant and diverse city, with a rich history, diverse geography, and a strong economy. The city is home to a large and diverse population, and is a major center for the service sector, shipbuilding, timber, and technology industries. Vancouver is a great place to live, work, and visit, and is sure to continue to grow and thrive in the years to come.
Common Questions
What is Per Capita Income in Vancouver?
Per Capita income in Vancouver is $40,219.
What is the Median Family Income in Vancouver?
Median Family Income in Vancouver is $86,704.
What is the Median Household income in Vancouver?
Median Household Income in Vancouver is $73,626.
What is Income or Wage Gap in Vancouver?
Income or Wage Gap in Vancouver is 27.4%.
Women in Vancouver earn 72.6 cents for every dollar earned by a man.
What is Family Income Deficit in Vancouver?
Family Income Deficit in Vancouver is $10,575.
Families that are below poverty line in Vancouver earn $10,575 less on average than the poverty threshold level.
What is Inequality or Gini Index in Vancouver?
Inequality or Gini Index in Vancouver is 0.44.
What is the Total Population of Vancouver?
Total Population of Vancouver is 190,700.
What is the Total Male Population of Vancouver?
Total Male Population of Vancouver is 94,176.
What is the Total Female Population of Vancouver?
Total Female Population of Vancouver is 96,524.
What is the Ratio of Males per 100 Females in Vancouver?
There are 97.57 Males per 100 Females in Vancouver.
What is the Ratio of Females per 100 Males in Vancouver?
There are 102.49 Females per 100 Males in Vancouver.
What is the Median Population Age in Vancouver?
Median Population Age in Vancouver is 37.4 Years.
What is the Average Family Size in Vancouver
Average Family Size in Vancouver is 3.1 People.
What is the Average Household Size in Vancouver
Average Household Size in Vancouver is 2.4 People.
How Large is the Labor Force in Vancouver?
There are 99,811 People in the Labor Forcein in Vancouver.
What is the Percentage of People in the Labor Force in Vancouver?
64.9% of People are in the Labor Force in Vancouver.
What is the Unemployment Rate in Vancouver?
Unemployment Rate in Vancouver is 5.6%.