Cities with the Lowest Unemployment Rate Amomg Seniors Over the Age of 65 in the United States
RELATED REPORTS & OPTIONS
Lowest Unemployment | Senior > 65
United States
Compare Cities
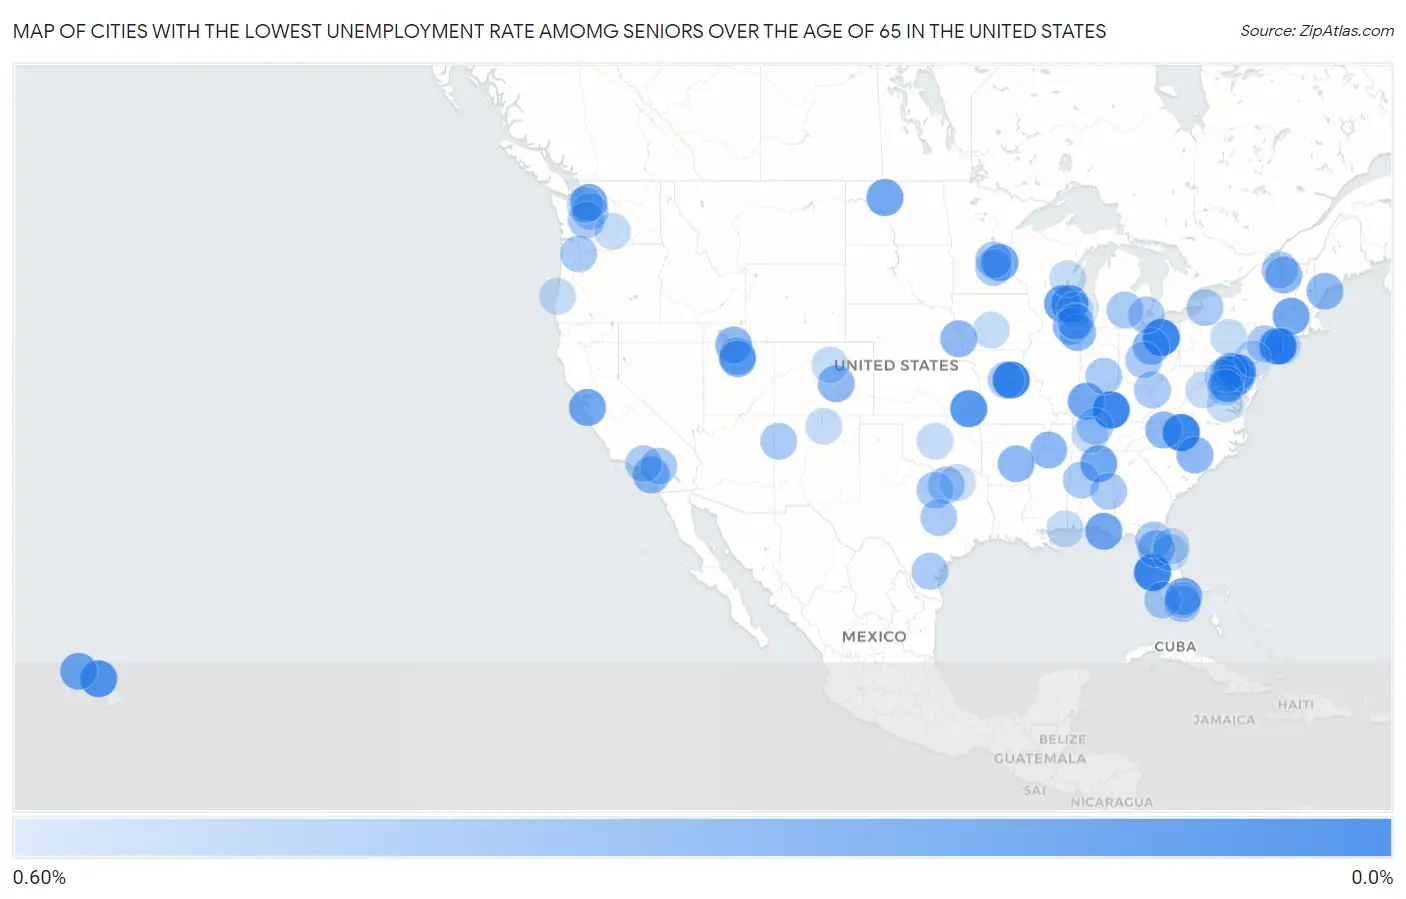
Map of Cities with the Lowest Unemployment Rate Amomg Seniors Over the Age of 65 in the United States
0.60%
0.0%
Cities with the Lowest Unemployment Rate Amomg Seniors Over the Age of 65 in the United States
| City | Senior Unemployment | vs State | vs National | |
| 1. | Columbia | 0.10% | 3.0%(-2.90)#1 | 3.9%(-3.80)#1 |
| 2. | Brunswick | 0.10% | 3.3%(-3.20)#1 | 3.9%(-3.80)#2 |
| 3. | Middle River | 0.10% | 3.6%(-3.50)#1 | 3.9%(-3.80)#3 |
| 4. | Ruskin | 0.10% | 4.1%(-4.00)#1 | 3.9%(-3.80)#4 |
| 5. | Clemmons | 0.10% | 3.1%(-3.00)#1 | 3.9%(-3.80)#5 |
| 6. | Campbellsville | 0.10% | 3.2%(-3.10)#1 | 3.9%(-3.80)#6 |
| 7. | North Hills | 0.10% | 4.6%(-4.50)#1 | 3.9%(-3.80)#7 |
| 8. | Pikesville | 0.20% | 3.6%(-3.40)#2 | 3.9%(-3.70)#8 |
| 9. | Four Square Mile | 0.20% | 3.4%(-3.20)#1 | 3.9%(-3.70)#9 |
| 10. | Waihee Waiehu | 0.20% | 3.7%(-3.50)#1 | 3.9%(-3.70)#10 |
| 11. | Parsons | 0.20% | 1.9%(-1.70)#1 | 3.9%(-3.70)#11 |
| 12. | Waukesha | 0.20% | 2.1%(-1.90)#1 | 3.9%(-3.70)#12 |
| 13. | Owensboro | 0.30% | 3.2%(-2.90)#2 | 3.9%(-3.60)#13 |
| 14. | Minot | 0.30% | 1.9%(-1.60)#1 | 3.9%(-3.60)#14 |
| 15. | North Lauderdale | 0.30% | 4.1%(-3.80)#2 | 3.9%(-3.60)#15 |
| 16. | Lake Stevens | 0.30% | 3.4%(-3.10)#1 | 3.9%(-3.60)#16 |
| 17. | East Palo Alto | 0.30% | 5.3%(-5.00)#1 | 3.9%(-3.60)#17 |
| 18. | Northampton | 0.30% | 4.6%(-4.30)#1 | 3.9%(-3.60)#18 |
| 19. | Albertville | 0.30% | 2.5%(-2.20)#1 | 3.9%(-3.60)#19 |
| 20. | Panama City Beach | 0.30% | 4.1%(-3.80)#3 | 3.9%(-3.60)#20 |
| 21. | Fort Hunt | 0.30% | 3.1%(-2.80)#1 | 3.9%(-3.60)#21 |
| 22. | Halawa | 0.30% | 3.7%(-3.40)#2 | 3.9%(-3.60)#22 |
| 23. | Mounds View | 0.30% | 3.2%(-2.90)#1 | 3.9%(-3.60)#23 |
| 24. | Jefferson | 0.30% | 2.1%(-1.80)#2 | 3.9%(-3.60)#24 |
| 25. | Provo | 0.40% | 2.4%(-2.00)#1 | 3.9%(-3.50)#25 |
| 26. | Ocala | 0.40% | 4.1%(-3.70)#4 | 3.9%(-3.50)#26 |
| 27. | Wheaton | 0.40% | 4.1%(-3.70)#1 | 3.9%(-3.50)#27 |
| 28. | Collierville | 0.40% | 3.1%(-2.70)#1 | 3.9%(-3.50)#28 |
| 29. | Mansfield | 0.40% | 3.3%(-2.90)#2 | 3.9%(-3.50)#29 |
| 30. | Bountiful | 0.40% | 2.4%(-2.00)#2 | 3.9%(-3.50)#30 |
| 31. | Spanish Fork | 0.40% | 2.4%(-2.00)#3 | 3.9%(-3.50)#31 |
| 32. | Pine Bluff | 0.40% | 2.7%(-2.30)#1 | 3.9%(-3.50)#32 |
| 33. | Severna Park | 0.40% | 3.6%(-3.20)#3 | 3.9%(-3.50)#33 |
| 34. | Security Widefield | 0.40% | 3.4%(-3.00)#2 | 3.9%(-3.50)#34 |
| 35. | Randallstown | 0.40% | 3.6%(-3.20)#4 | 3.9%(-3.50)#35 |
| 36. | Laguna Hills | 0.40% | 5.3%(-4.90)#2 | 3.9%(-3.50)#36 |
| 37. | Eldersburg | 0.40% | 3.6%(-3.20)#5 | 3.9%(-3.50)#37 |
| 38. | South Portland | 0.40% | 4.2%(-3.80)#1 | 3.9%(-3.50)#38 |
| 39. | Boone | 0.40% | 3.1%(-2.70)#2 | 3.9%(-3.50)#39 |
| 40. | Laurinburg | 0.40% | 3.1%(-2.70)#3 | 3.9%(-3.50)#40 |
| 41. | Flossmoor | 0.40% | 4.1%(-3.70)#2 | 3.9%(-3.50)#41 |
| 42. | Winooski | 0.40% | 3.1%(-2.70)#1 | 3.9%(-3.50)#42 |
| 43. | Ralston | 0.40% | 1.7%(-1.30)#1 | 3.9%(-3.50)#43 |
| 44. | Media Borough | 0.40% | 4.2%(-3.80)#1 | 3.9%(-3.50)#44 |
| 45. | Gainesville | 0.50% | 4.1%(-3.60)#5 | 3.9%(-3.40)#45 |
| 46. | Tuscaloosa | 0.50% | 2.5%(-2.00)#2 | 3.9%(-3.40)#46 |
| 47. | Auburn | 0.50% | 2.5%(-2.00)#3 | 3.9%(-3.40)#47 |
| 48. | Sammamish | 0.50% | 3.4%(-2.90)#2 | 3.9%(-3.40)#48 |
| 49. | Highland | 0.50% | 5.3%(-4.80)#3 | 3.9%(-3.40)#49 |
| 50. | Westchester | 0.50% | 4.1%(-3.60)#6 | 3.9%(-3.40)#50 |
| 51. | Columbus | 0.50% | 2.9%(-2.40)#1 | 3.9%(-3.40)#51 |
| 52. | Huntington | 0.50% | 2.6%(-2.10)#1 | 3.9%(-3.40)#52 |
| 53. | West Seneca | 0.50% | 4.6%(-4.10)#2 | 3.9%(-3.40)#53 |
| 54. | Gallatin | 0.50% | 3.1%(-2.60)#2 | 3.9%(-3.40)#54 |
| 55. | Puyallup | 0.50% | 3.4%(-2.90)#3 | 3.9%(-3.40)#55 |
| 56. | Coppell | 0.50% | 3.9%(-3.40)#1 | 3.9%(-3.40)#56 |
| 57. | Upper Arlington | 0.50% | 3.3%(-2.80)#3 | 3.9%(-3.40)#57 |
| 58. | Weatherford | 0.50% | 3.9%(-3.40)#2 | 3.9%(-3.40)#58 |
| 59. | Parkville | 0.50% | 3.6%(-3.10)#6 | 3.9%(-3.40)#59 |
| 60. | Chanhassen | 0.50% | 3.2%(-2.70)#2 | 3.9%(-3.40)#60 |
| 61. | Okemos | 0.50% | 4.3%(-3.80)#1 | 3.9%(-3.40)#61 |
| 62. | Belton | 0.50% | 3.9%(-3.40)#3 | 3.9%(-3.40)#62 |
| 63. | Gallup | 0.50% | 4.2%(-3.70)#1 | 3.9%(-3.40)#63 |
| 64. | La Crescenta Montrose | 0.50% | 5.3%(-4.80)#4 | 3.9%(-3.40)#64 |
| 65. | Plattsburgh | 0.50% | 4.6%(-4.10)#3 | 3.9%(-3.40)#65 |
| 66. | Dover | 0.50% | 6.0%(-5.50)#1 | 3.9%(-3.40)#66 |
| 67. | Alice | 0.50% | 3.9%(-3.40)#4 | 3.9%(-3.40)#67 |
| 68. | Marco Island | 0.50% | 4.1%(-3.60)#7 | 3.9%(-3.40)#68 |
| 69. | Westbury | 0.50% | 4.6%(-4.10)#4 | 3.9%(-3.40)#69 |
| 70. | Rogers | 0.50% | 3.2%(-2.70)#3 | 3.9%(-3.40)#70 |
| 71. | Grosse Pointe Farms | 0.50% | 4.3%(-3.80)#2 | 3.9%(-3.40)#71 |
| 72. | Boonville | 0.50% | 3.0%(-2.50)#2 | 3.9%(-3.40)#72 |
| 73. | West Slope | 0.50% | 4.7%(-4.20)#1 | 3.9%(-3.40)#73 |
| 74. | Deltona | 0.60% | 4.1%(-3.50)#8 | 3.9%(-3.30)#74 |
| 75. | Franklin | 0.60% | 3.1%(-2.50)#3 | 3.9%(-3.30)#75 |
| 76. | Appleton | 0.60% | 2.1%(-1.50)#3 | 3.9%(-3.30)#76 |
| 77. | Harrisonburg | 0.60% | 3.1%(-2.50)#2 | 3.9%(-3.30)#77 |
| 78. | Country Club | 0.60% | 4.1%(-3.50)#9 | 3.9%(-3.30)#78 |
| 79. | Leesburg | 0.60% | 3.1%(-2.50)#3 | 3.9%(-3.30)#79 |
| 80. | Urbandale | 0.60% | 2.6%(-2.00)#1 | 3.9%(-3.30)#80 |
| 81. | Ormond Beach | 0.60% | 4.1%(-3.50)#10 | 3.9%(-3.30)#81 |
| 82. | Mechanicsville | 0.60% | 3.1%(-2.50)#4 | 3.9%(-3.30)#82 |
| 83. | Wheat Ridge | 0.60% | 3.4%(-2.80)#3 | 3.9%(-3.30)#83 |
| 84. | Greenville | 0.60% | 3.9%(-3.30)#5 | 3.9%(-3.30)#84 |
| 85. | Williamsport | 0.60% | 4.2%(-3.60)#2 | 3.9%(-3.30)#85 |
| 86. | Mount Pleasant | 0.60% | 2.1%(-1.50)#4 | 3.9%(-3.30)#86 |
| 87. | Morton Grove | 0.60% | 4.1%(-3.50)#3 | 3.9%(-3.30)#87 |
| 88. | Dix Hills | 0.60% | 4.6%(-4.00)#5 | 3.9%(-3.30)#88 |
| 89. | King Of Prussia | 0.60% | 4.2%(-3.60)#3 | 3.9%(-3.30)#89 |
| 90. | Yukon | 0.60% | 2.1%(-1.50)#1 | 3.9%(-3.30)#90 |
| 91. | West Springfield | 0.60% | 3.1%(-2.50)#5 | 3.9%(-3.30)#91 |
| 92. | Pascagoula | 0.60% | 3.8%(-3.20)#1 | 3.9%(-3.30)#92 |
| 93. | Damascus | 0.60% | 3.6%(-3.00)#7 | 3.9%(-3.30)#93 |
| 94. | Prospect Heights | 0.60% | 4.1%(-3.50)#4 | 3.9%(-3.30)#94 |
| 95. | North Bend | 0.60% | 4.7%(-4.10)#2 | 3.9%(-3.30)#95 |
| 96. | Picnic Point | 0.60% | 3.4%(-2.80)#4 | 3.9%(-3.30)#96 |
| 97. | Terrace Heights | 0.60% | 3.4%(-2.80)#5 | 3.9%(-3.30)#97 |
| 98. | Haddon Heights Borough | 0.60% | 6.0%(-5.40)#2 | 3.9%(-3.30)#98 |
| 99. | Taos | 0.60% | 4.2%(-3.60)#2 | 3.9%(-3.30)#99 |
| 100. | Dumfries | 0.60% | 3.1%(-2.50)#6 | 3.9%(-3.30)#100 |
Common Questions
What are the Top 10 Cities with the Lowest Unemployment Rate Amomg Seniors Over the Age of 65 in the United States?
Top 10 Cities with the Lowest Unemployment Rate Amomg Seniors Over the Age of 65 in the United States are:
#1
0.10%
#2
0.10%
#3
0.10%
#4
0.10%
#5
0.10%
#6
0.10%
#7
0.10%
#8
0.20%
#9
0.20%
#10
0.20%
What city has the Lowest Unemployment Rate Amomg Seniors Over the Age of 65 in the United States?
Columbia has the Lowest Unemployment Rate Amomg Seniors Over the Age of 65 in the United States with 0.10%.
What is the Unemployment Rate Amomg Seniors Over the Age of 65 in the United States?
Unemployment Rate Amomg Seniors Over the Age of 65 in the United States is 3.9%.