Mount Vernon, WA Map & Demographics
Mount Vernon Map
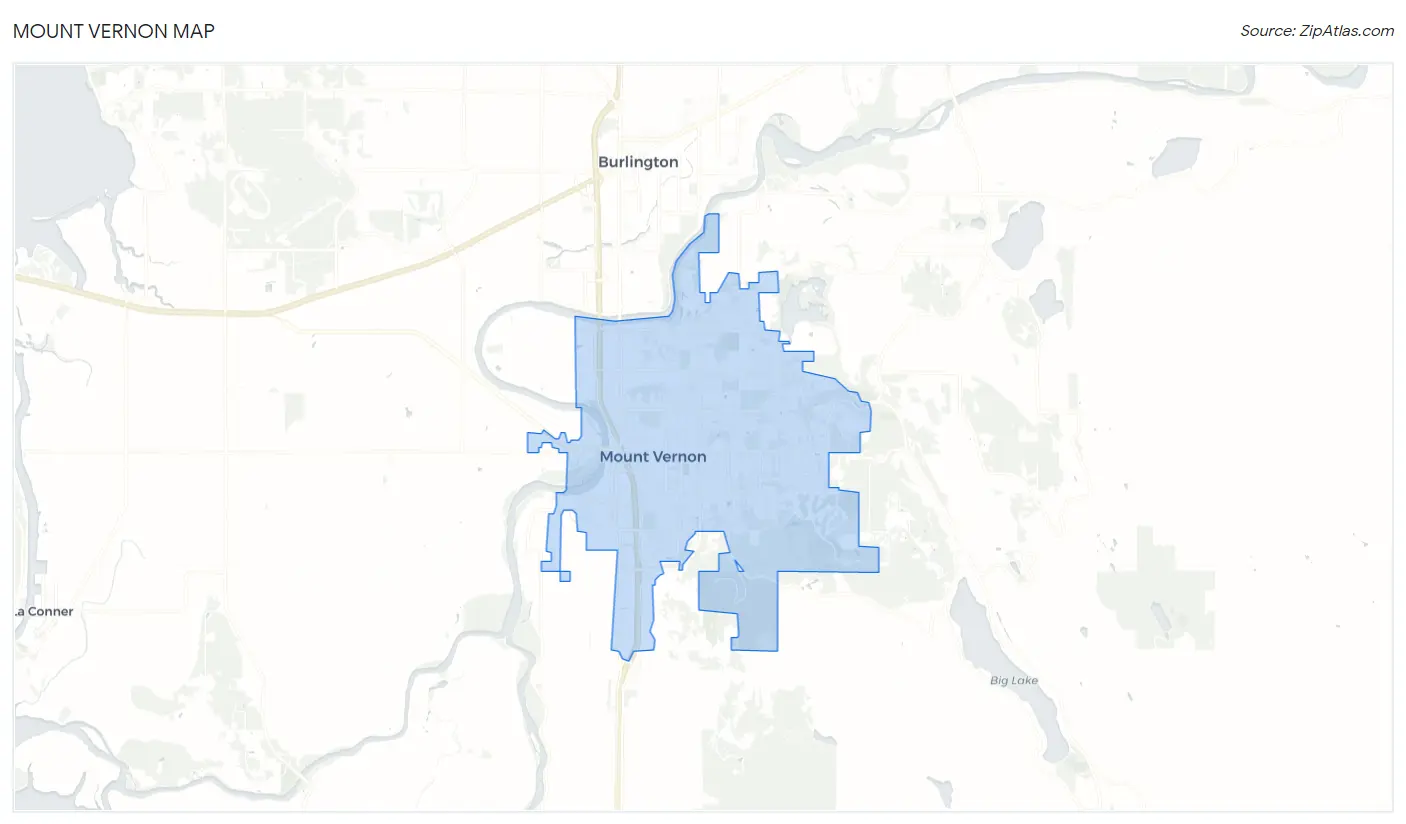
Mount Vernon Overview
$33,522
PER CAPITA INCOME
$87,076
AVG FAMILY INCOME
$69,227
AVG HOUSEHOLD INCOME
20.4%
WAGE / INCOME GAP [ % ]
79.6¢/ $1
WAGE / INCOME GAP [ $ ]
$12,379
FAMILY INCOME DEFICIT
0.44
INEQUALITY / GINI INDEX
35,120
TOTAL POPULATION
17,266
MALE POPULATION
17,854
FEMALE POPULATION
96.71
MALES / 100 FEMALES
103.41
FEMALES / 100 MALES
35.0
MEDIAN AGE
3.2
AVG FAMILY SIZE
2.6
AVG HOUSEHOLD SIZE
16,782
LABOR FORCE [ PEOPLE ]
61.6%
PERCENT IN LABOR FORCE
6.3%
UNEMPLOYMENT RATE
Mount Vernon Area Codes
Income in Mount Vernon
Income Overview in Mount Vernon
Per Capita Income in Mount Vernon is $33,522, while median incomes of families and households are $87,076 and $69,227 respectively.
| Characteristic | Number | Measure |
| Per Capita Income | 35,120 | $33,522 |
| Median Family Income | 8,573 | $87,076 |
| Mean Family Income | 8,573 | $102,301 |
| Median Household Income | 12,942 | $69,227 |
| Mean Household Income | 12,942 | $89,229 |
| Income Deficit | 8,573 | $12,379 |
| Wage / Income Gap (%) | 35,120 | 20.35% |
| Wage / Income Gap ($) | 35,120 | 79.65¢ per $1 |
| Gini / Inequality Index | 35,120 | 0.44 |
Earnings by Sex in Mount Vernon
Average Earnings in Mount Vernon are $38,652, $42,000 for men and $33,452 for women, a difference of 20.3%.
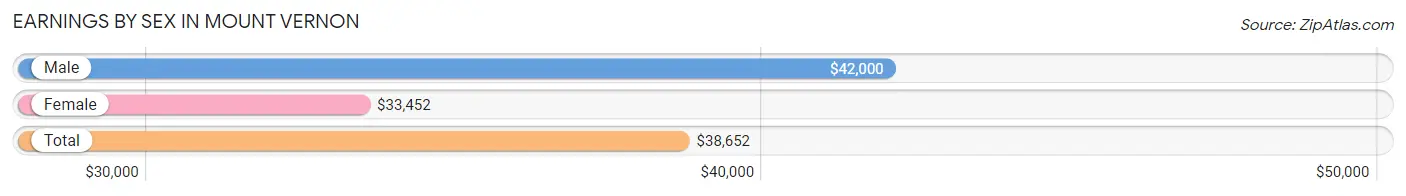
| Sex | Number | Average Earnings |
| Male | 9,536 (54.7%) | $42,000 |
| Female | 7,897 (45.3%) | $33,452 |
| Total | 17,433 (100.0%) | $38,652 |
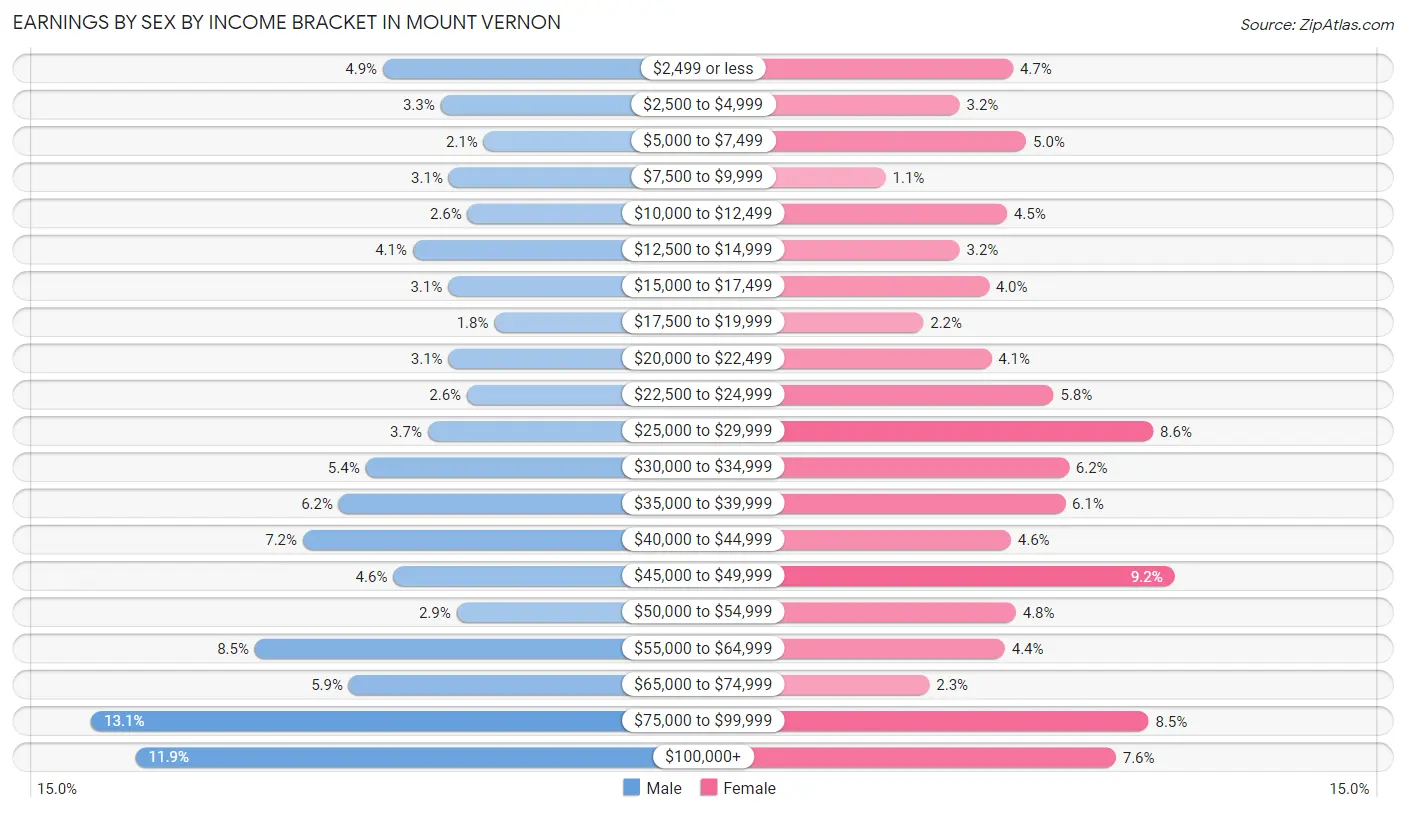
Earnings by Sex by Income Bracket in Mount Vernon
The most common earnings brackets in Mount Vernon are $75,000 to $99,999 for men (1,252 | 13.1%) and $45,000 to $49,999 for women (727 | 9.2%).
| Income | Male | Female |
| $2,499 or less | 470 (4.9%) | 369 (4.7%) |
| $2,500 to $4,999 | 316 (3.3%) | 250 (3.2%) |
| $5,000 to $7,499 | 200 (2.1%) | 398 (5.0%) |
| $7,500 to $9,999 | 294 (3.1%) | 86 (1.1%) |
| $10,000 to $12,499 | 243 (2.5%) | 355 (4.5%) |
| $12,500 to $14,999 | 390 (4.1%) | 250 (3.2%) |
| $15,000 to $17,499 | 296 (3.1%) | 315 (4.0%) |
| $17,500 to $19,999 | 172 (1.8%) | 170 (2.1%) |
| $20,000 to $22,499 | 295 (3.1%) | 321 (4.1%) |
| $22,500 to $24,999 | 245 (2.6%) | 459 (5.8%) |
| $25,000 to $29,999 | 350 (3.7%) | 680 (8.6%) |
| $30,000 to $34,999 | 517 (5.4%) | 493 (6.2%) |
| $35,000 to $39,999 | 588 (6.2%) | 484 (6.1%) |
| $40,000 to $44,999 | 685 (7.2%) | 364 (4.6%) |
| $45,000 to $49,999 | 442 (4.6%) | 727 (9.2%) |
| $50,000 to $54,999 | 273 (2.9%) | 375 (4.8%) |
| $55,000 to $64,999 | 813 (8.5%) | 351 (4.4%) |
| $65,000 to $74,999 | 562 (5.9%) | 183 (2.3%) |
| $75,000 to $99,999 | 1,252 (13.1%) | 670 (8.5%) |
| $100,000+ | 1,133 (11.9%) | 597 (7.6%) |
| Total | 9,536 (100.0%) | 7,897 (100.0%) |
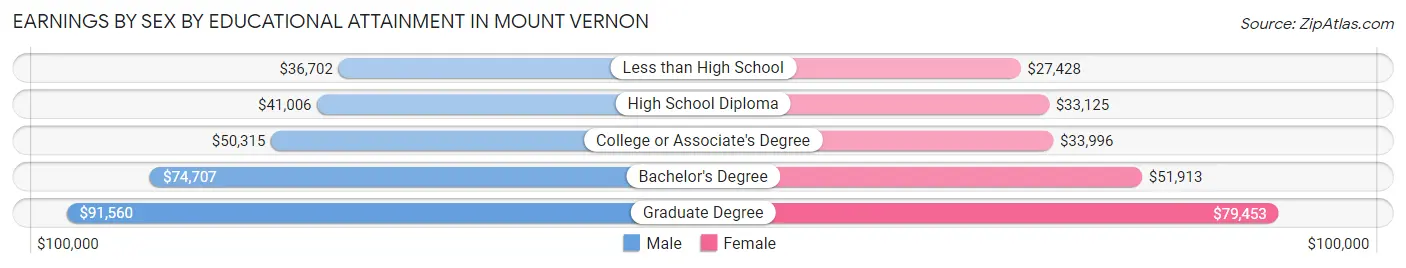
Earnings by Sex by Educational Attainment in Mount Vernon
Average earnings in Mount Vernon are $50,846 for men and $38,710 for women, a difference of 23.9%. Men with an educational attainment of graduate degree enjoy the highest average annual earnings of $91,560, while those with less than high school education earn the least with $36,702. Women with an educational attainment of graduate degree earn the most with the average annual earnings of $79,453, while those with less than high school education have the smallest earnings of $27,428.
| Educational Attainment | Male Income | Female Income |
| Less than High School | $36,702 | $27,428 |
| High School Diploma | $41,006 | $33,125 |
| College or Associate's Degree | $50,315 | $33,996 |
| Bachelor's Degree | $74,707 | $51,913 |
| Graduate Degree | $91,560 | $79,453 |
| Total | $50,846 | $38,710 |
Family Income in Mount Vernon
Family Income Brackets in Mount Vernon
According to the Mount Vernon family income data, there are 2,006 families falling into the $100,000 to $149,999 income range, which is the most common income bracket and makes up 23.4% of all families. Conversely, the $10,000 to $14,999 income bracket is the least frequent group with only 146 families (1.7%) belonging to this category.
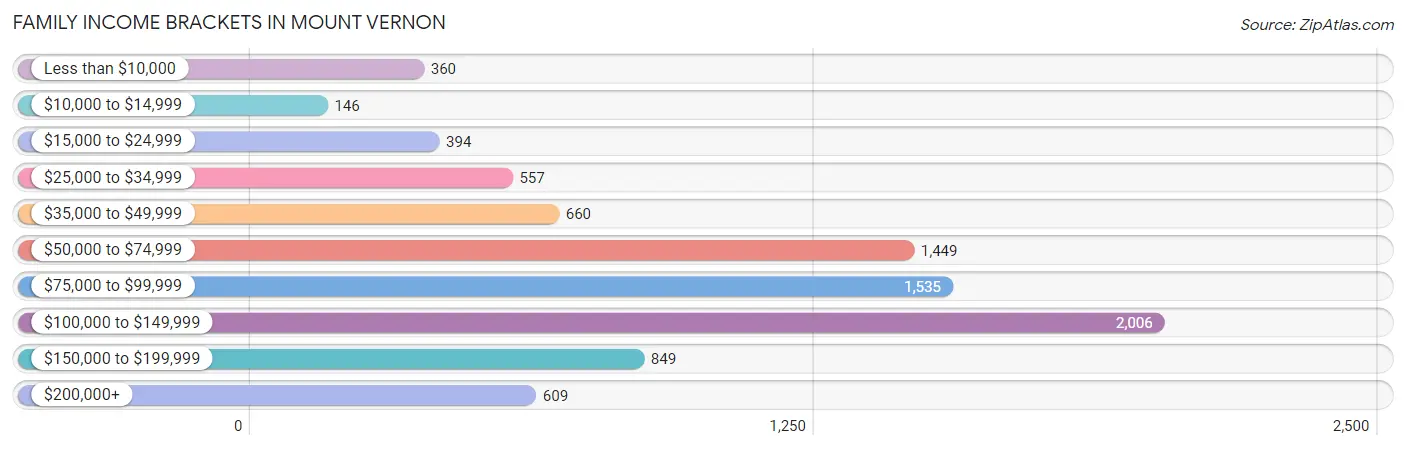
| Income Bracket | # Families | % Families |
| Less than $10,000 | 360 | 4.2% |
| $10,000 to $14,999 | 146 | 1.7% |
| $15,000 to $24,999 | 394 | 4.6% |
| $25,000 to $34,999 | 557 | 6.5% |
| $35,000 to $49,999 | 660 | 7.7% |
| $50,000 to $74,999 | 1,449 | 16.9% |
| $75,000 to $99,999 | 1,535 | 17.9% |
| $100,000 to $149,999 | 2,006 | 23.4% |
| $150,000 to $199,999 | 849 | 9.9% |
| $200,000+ | 609 | 7.1% |
Family Income by Famaliy Size in Mount Vernon
3-person families (2,280 | 26.6%) account for the highest median family income in Mount Vernon with $95,649 per family, while 2-person families (3,424 | 39.9%) have the highest median income of $43,007 per family member.
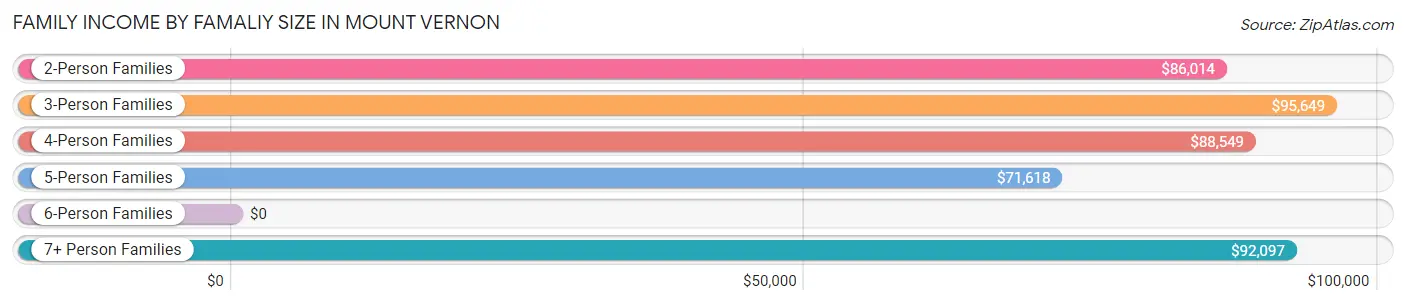
| Income Bracket | # Families | Median Income |
| 2-Person Families | 3,424 (39.9%) | $86,014 |
| 3-Person Families | 2,280 (26.6%) | $95,649 |
| 4-Person Families | 1,505 (17.6%) | $88,549 |
| 5-Person Families | 732 (8.5%) | $71,618 |
| 6-Person Families | 432 (5.0%) | $0 |
| 7+ Person Families | 200 (2.3%) | $92,097 |
| Total | 8,573 (100.0%) | $87,076 |
Family Income by Number of Earners in Mount Vernon
The median family income in Mount Vernon is $87,076, with families comprising 3+ earners (1,127) having the highest median family income of $115,114, while families with no earners (1,523) have the lowest median family income of $54,026, accounting for 13.2% and 17.8% of families, respectively.
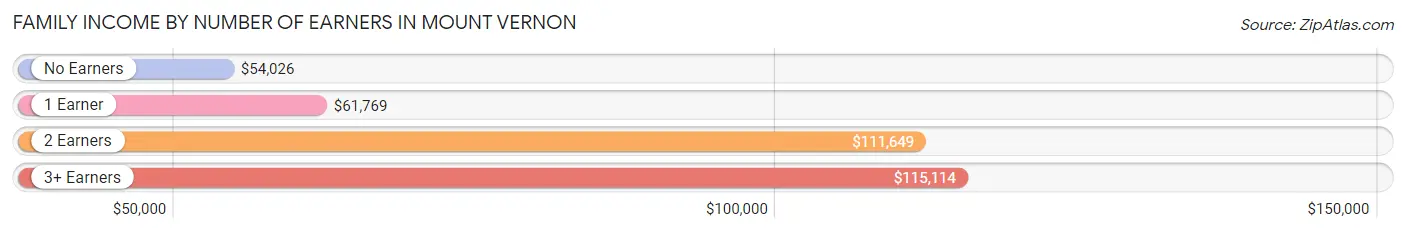
| Number of Earners | # Families | Median Income |
| No Earners | 1,523 (17.8%) | $54,026 |
| 1 Earner | 2,714 (31.7%) | $61,769 |
| 2 Earners | 3,209 (37.4%) | $111,649 |
| 3+ Earners | 1,127 (13.2%) | $115,114 |
| Total | 8,573 (100.0%) | $87,076 |
Household Income in Mount Vernon
Household Income Brackets in Mount Vernon
With 2,537 households falling in the category, the $100,000 to $149,999 income range is the most frequent in Mount Vernon, accounting for 19.6% of all households. In contrast, only 505 households (3.9%) fall into the $10,000 to $14,999 income bracket, making it the least populous group.
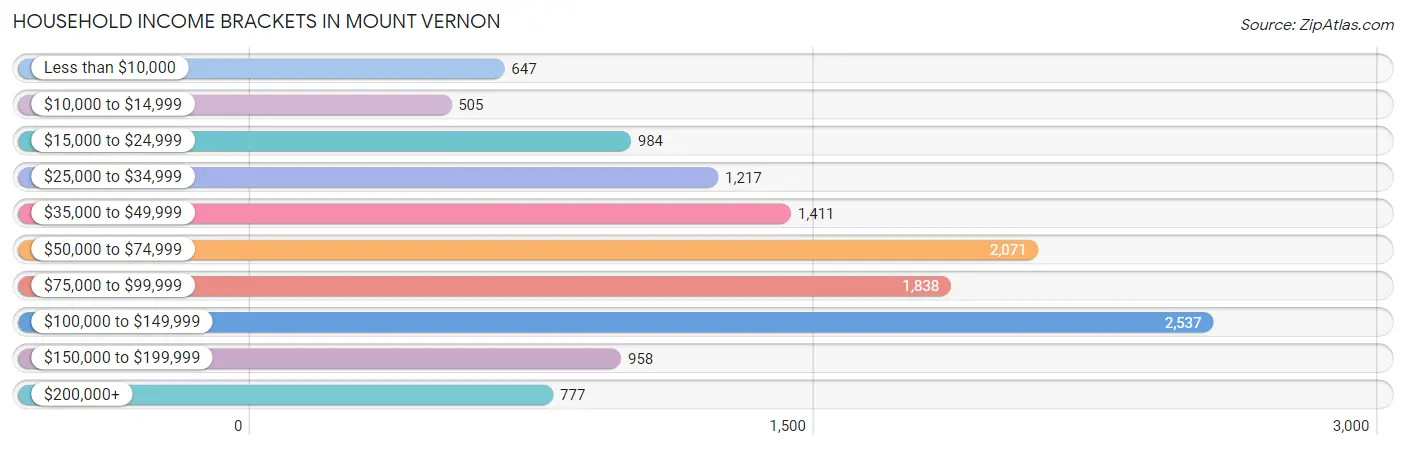
| Income Bracket | # Households | % Households |
| Less than $10,000 | 647 | 5.0% |
| $10,000 to $14,999 | 505 | 3.9% |
| $15,000 to $24,999 | 984 | 7.6% |
| $25,000 to $34,999 | 1,217 | 9.4% |
| $35,000 to $49,999 | 1,411 | 10.9% |
| $50,000 to $74,999 | 2,071 | 16.0% |
| $75,000 to $99,999 | 1,838 | 14.2% |
| $100,000 to $149,999 | 2,537 | 19.6% |
| $150,000 to $199,999 | 958 | 7.4% |
| $200,000+ | 777 | 6.0% |
Household Income by Householder Age in Mount Vernon
The median household income in Mount Vernon is $69,227, with the highest median household income of $84,505 found in the 45 to 64 years age bracket for the primary householder. A total of 4,072 households (31.5%) fall into this category. Meanwhile, the 15 to 24 years age bracket for the primary householder has the lowest median household income of $43,018, with 557 households (4.3%) in this group.
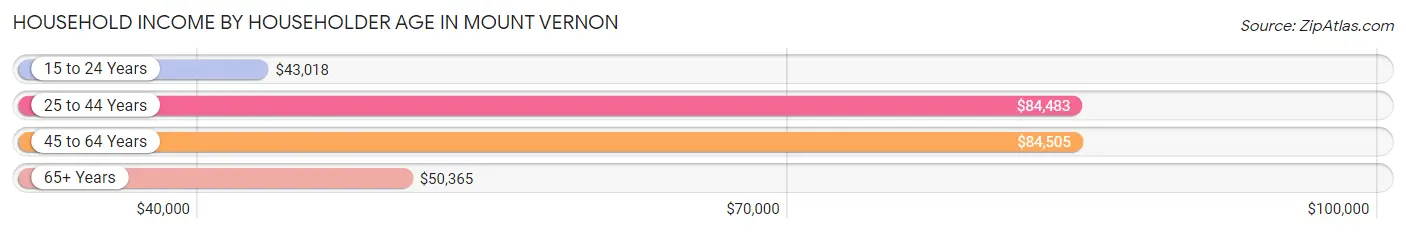
| Income Bracket | # Households | Median Income |
| 15 to 24 Years | 557 (4.3%) | $43,018 |
| 25 to 44 Years | 4,314 (33.3%) | $84,483 |
| 45 to 64 Years | 4,072 (31.5%) | $84,505 |
| 65+ Years | 3,999 (30.9%) | $50,365 |
| Total | 12,942 (100.0%) | $69,227 |
Poverty in Mount Vernon
Income Below Poverty by Sex and Age in Mount Vernon
With 16.9% poverty level for males and 18.6% for females among the residents of Mount Vernon, 15 year old males and 18 to 24 year old females are the most vulnerable to poverty, with 45 males (46.4%) and 571 females (42.4%) in their respective age groups living below the poverty level.
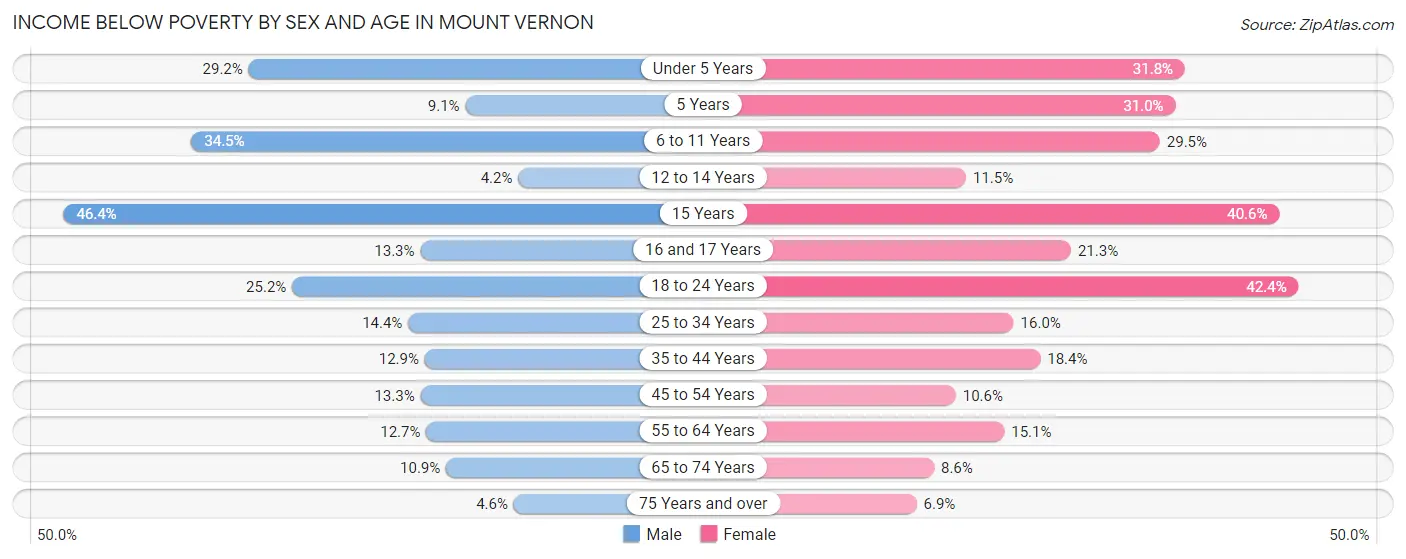
| Age Bracket | Male | Female |
| Under 5 Years | 371 (29.2%) | 334 (31.8%) |
| 5 Years | 27 (9.1%) | 113 (31.0%) |
| 6 to 11 Years | 545 (34.5%) | 392 (29.5%) |
| 12 to 14 Years | 20 (4.2%) | 94 (11.5%) |
| 15 Years | 45 (46.4%) | 95 (40.6%) |
| 16 and 17 Years | 78 (13.3%) | 97 (21.3%) |
| 18 to 24 Years | 403 (25.2%) | 571 (42.4%) |
| 25 to 34 Years | 414 (14.4%) | 399 (16.0%) |
| 35 to 44 Years | 226 (12.9%) | 369 (18.4%) |
| 45 to 54 Years | 244 (13.3%) | 175 (10.6%) |
| 55 to 64 Years | 219 (12.7%) | 328 (15.1%) |
| 65 to 74 Years | 185 (10.9%) | 177 (8.6%) |
| 75 Years and over | 43 (4.6%) | 101 (6.9%) |
| Total | 2,820 (16.9%) | 3,245 (18.6%) |
Income Above Poverty by Sex and Age in Mount Vernon
According to the poverty statistics in Mount Vernon, males aged 12 to 14 years and females aged 75 years and over are the age groups that are most secure financially, with 95.8% of males and 93.1% of females in these age groups living above the poverty line.
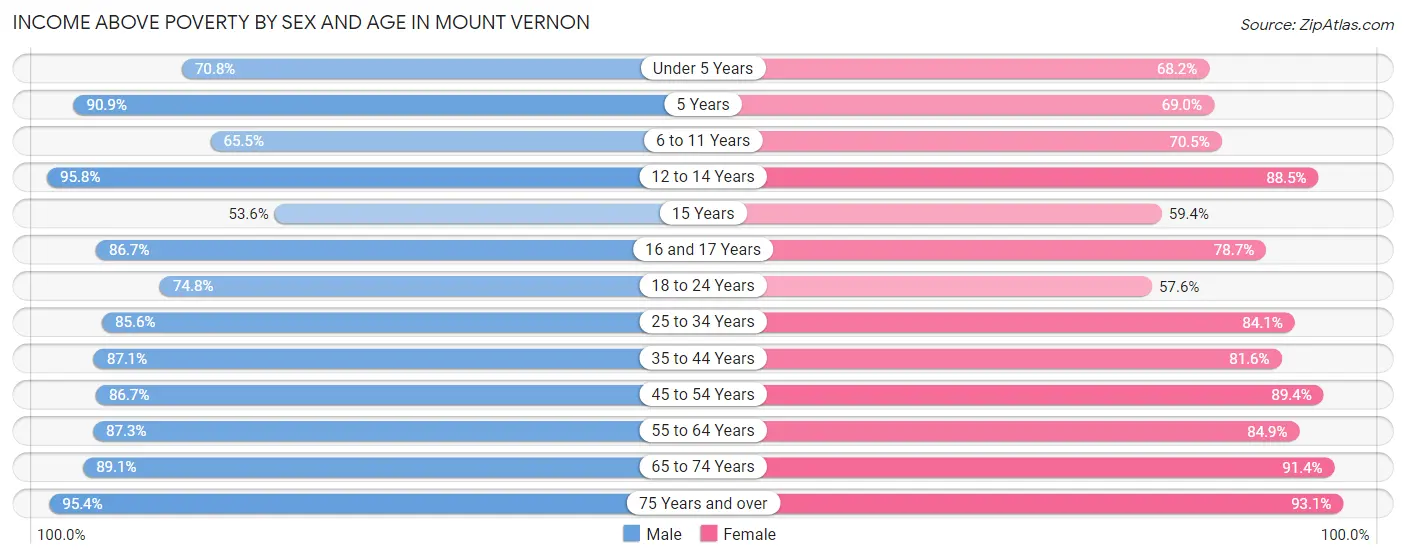
| Age Bracket | Male | Female |
| Under 5 Years | 899 (70.8%) | 715 (68.2%) |
| 5 Years | 270 (90.9%) | 252 (69.0%) |
| 6 to 11 Years | 1,034 (65.5%) | 936 (70.5%) |
| 12 to 14 Years | 458 (95.8%) | 721 (88.5%) |
| 15 Years | 52 (53.6%) | 139 (59.4%) |
| 16 and 17 Years | 510 (86.7%) | 359 (78.7%) |
| 18 to 24 Years | 1,198 (74.8%) | 776 (57.6%) |
| 25 to 34 Years | 2,461 (85.6%) | 2,103 (84.1%) |
| 35 to 44 Years | 1,531 (87.1%) | 1,634 (81.6%) |
| 45 to 54 Years | 1,596 (86.7%) | 1,479 (89.4%) |
| 55 to 64 Years | 1,503 (87.3%) | 1,847 (84.9%) |
| 65 to 74 Years | 1,516 (89.1%) | 1,891 (91.4%) |
| 75 Years and over | 891 (95.4%) | 1,355 (93.1%) |
| Total | 13,919 (83.2%) | 14,207 (81.4%) |
Income Below Poverty Among Married-Couple Families in Mount Vernon
The poverty statistics for married-couple families in Mount Vernon show that 7.4% or 462 of the total 6,261 families live below the poverty line. Families with 3 or 4 children have the highest poverty rate of 35.1%, comprising of 190 families. On the other hand, families with 5 or more children have the lowest poverty rate of 0.0%, which includes 0 families.
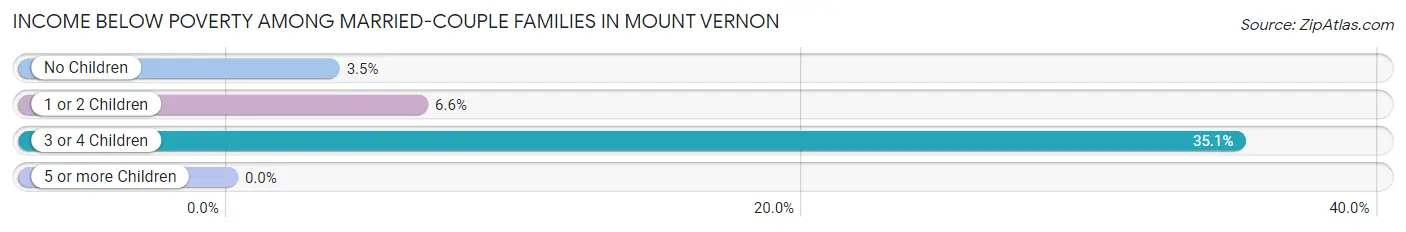
| Children | Above Poverty | Below Poverty |
| No Children | 3,266 (96.5%) | 120 (3.5%) |
| 1 or 2 Children | 2,145 (93.4%) | 152 (6.6%) |
| 3 or 4 Children | 352 (64.9%) | 190 (35.1%) |
| 5 or more Children | 36 (100.0%) | 0 (0.0%) |
| Total | 5,799 (92.6%) | 462 (7.4%) |
Income Below Poverty Among Single-Parent Households in Mount Vernon
According to the poverty data in Mount Vernon, 12.1% or 83 single-father households and 30.6% or 497 single-mother households are living below the poverty line. Among single-father households, those with no children have the highest poverty rate, with 65 households (22.6%) experiencing poverty. Likewise, among single-mother households, those with 3 or 4 children have the highest poverty rate, with 213 households (55.6%) falling below the poverty line.
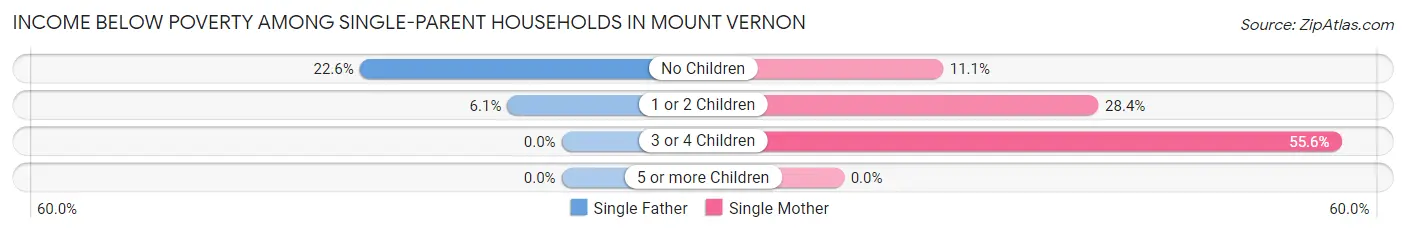
| Children | Single Father | Single Mother |
| No Children | 65 (22.6%) | 44 (11.1%) |
| 1 or 2 Children | 18 (6.1%) | 240 (28.4%) |
| 3 or 4 Children | 0 (0.0%) | 213 (55.6%) |
| 5 or more Children | 0 (0.0%) | 0 (0.0%) |
| Total | 83 (12.1%) | 497 (30.6%) |
Income Below Poverty Among Married-Couple vs Single-Parent Households in Mount Vernon
The poverty data for Mount Vernon shows that 462 of the married-couple family households (7.4%) and 580 of the single-parent households (25.1%) are living below the poverty level. Within the married-couple family households, those with 3 or 4 children have the highest poverty rate, with 190 households (35.1%) falling below the poverty line. Among the single-parent households, those with 3 or 4 children have the highest poverty rate, with 213 household (43.8%) living below poverty.
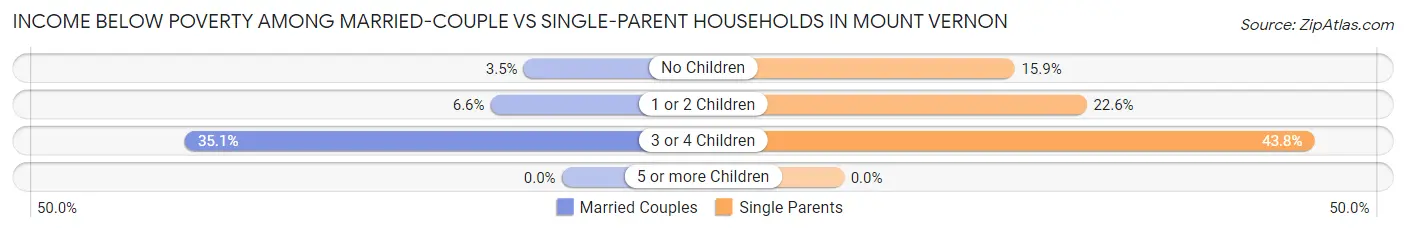
| Children | Married-Couple Families | Single-Parent Households |
| No Children | 120 (3.5%) | 109 (15.9%) |
| 1 or 2 Children | 152 (6.6%) | 258 (22.6%) |
| 3 or 4 Children | 190 (35.1%) | 213 (43.8%) |
| 5 or more Children | 0 (0.0%) | 0 (0.0%) |
| Total | 462 (7.4%) | 580 (25.1%) |
Race in Mount Vernon
The most populous races in Mount Vernon are White / Caucasian (23,402 | 66.6%), Hispanic or Latino (12,337 | 35.1%), and Some other Race (6,460 | 18.4%).
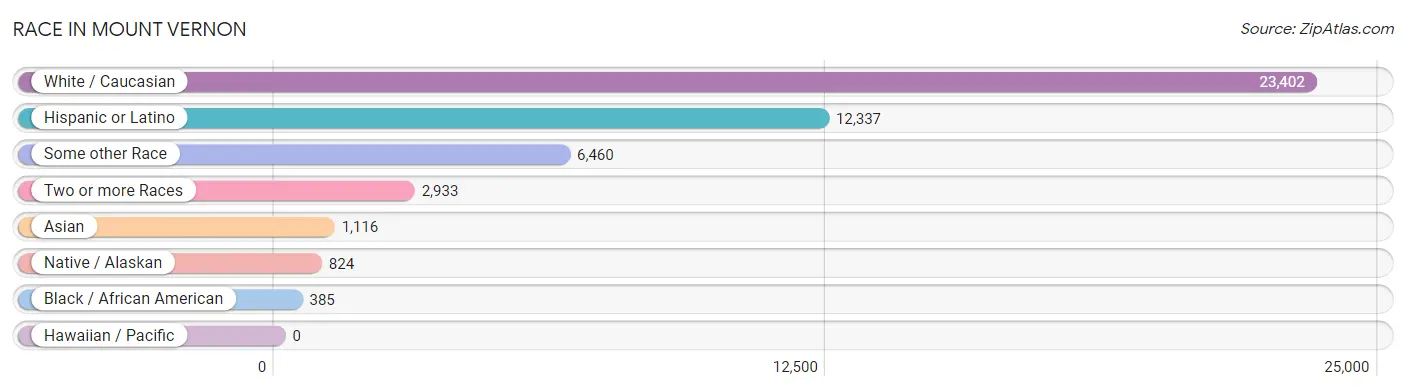
| Race | # Population | % Population |
| Asian | 1,116 | 3.2% |
| Black / African American | 385 | 1.1% |
| Hawaiian / Pacific | 0 | 0.0% |
| Hispanic or Latino | 12,337 | 35.1% |
| Native / Alaskan | 824 | 2.4% |
| White / Caucasian | 23,402 | 66.6% |
| Two or more Races | 2,933 | 8.4% |
| Some other Race | 6,460 | 18.4% |
| Total | 35,120 | 100.0% |
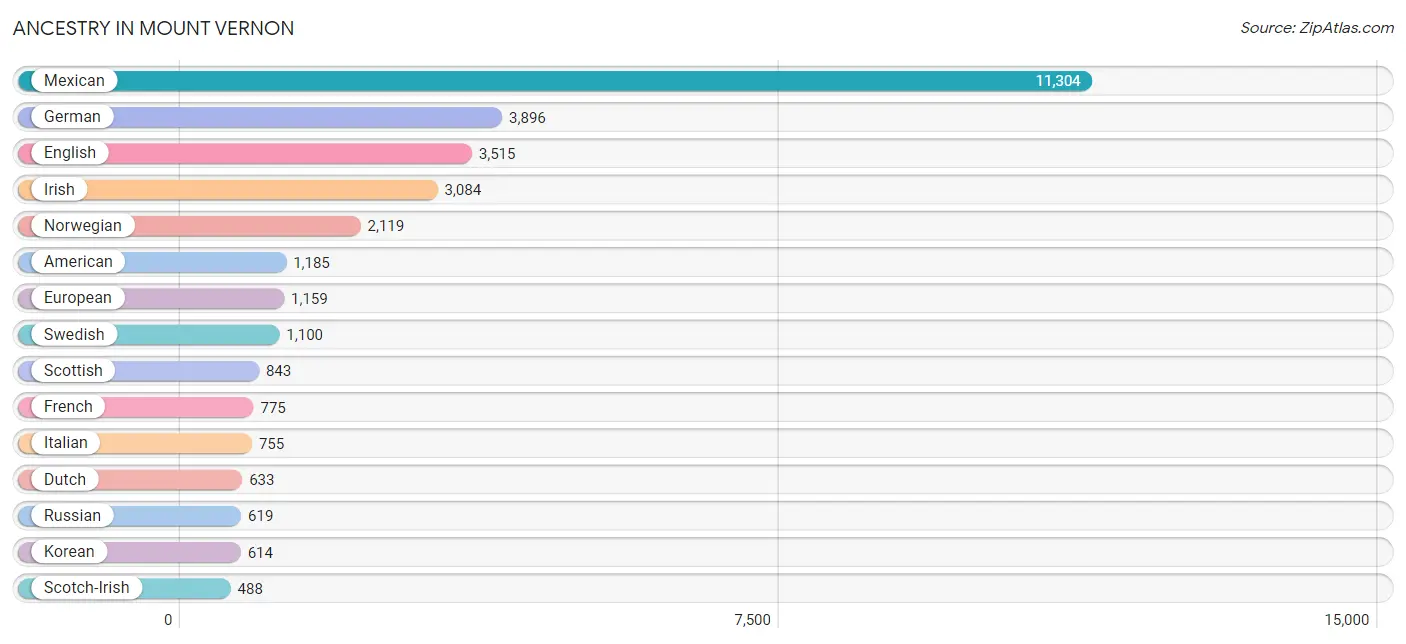
Ancestry in Mount Vernon
The most populous ancestries reported in Mount Vernon are Mexican (11,304 | 32.2%), German (3,896 | 11.1%), English (3,515 | 10.0%), Irish (3,084 | 8.8%), and Norwegian (2,119 | 6.0%), together accounting for 68.1% of all Mount Vernon residents.
| Ancestry | # Population | % Population |
| African | 96 | 0.3% |
| Alaska Native | 12 | 0.0% |
| Alaskan Athabascan | 54 | 0.2% |
| American | 1,185 | 3.4% |
| Apache | 202 | 0.6% |
| Arab | 35 | 0.1% |
| Australian | 107 | 0.3% |
| Austrian | 10 | 0.0% |
| Belgian | 9 | 0.0% |
| Bhutanese | 222 | 0.6% |
| Blackfeet | 93 | 0.3% |
| British | 334 | 0.9% |
| Bulgarian | 30 | 0.1% |
| Burmese | 71 | 0.2% |
| Canadian | 104 | 0.3% |
| Celtic | 25 | 0.1% |
| Central American | 425 | 1.2% |
| Central American Indian | 59 | 0.2% |
| Cherokee | 75 | 0.2% |
| Chilean | 64 | 0.2% |
| Chippewa | 11 | 0.0% |
| Choctaw | 15 | 0.0% |
| Colombian | 136 | 0.4% |
| Colville | 7 | 0.0% |
| Creek | 29 | 0.1% |
| Croatian | 41 | 0.1% |
| Cuban | 104 | 0.3% |
| Czech | 126 | 0.4% |
| Danish | 221 | 0.6% |
| Dutch | 633 | 1.8% |
| Eastern European | 50 | 0.1% |
| Egyptian | 12 | 0.0% |
| English | 3,515 | 10.0% |
| European | 1,159 | 3.3% |
| Filipino | 19 | 0.1% |
| Finnish | 100 | 0.3% |
| French | 775 | 2.2% |
| French Canadian | 147 | 0.4% |
| German | 3,896 | 11.1% |
| Greek | 154 | 0.4% |
| Guamanian / Chamorro | 18 | 0.1% |
| Guatemalan | 165 | 0.5% |
| Haitian | 26 | 0.1% |
| Honduran | 27 | 0.1% |
| Hungarian | 168 | 0.5% |
| Icelander | 61 | 0.2% |
| Indian (Asian) | 435 | 1.2% |
| Inupiat | 33 | 0.1% |
| Iranian | 17 | 0.1% |
| Irish | 3,084 | 8.8% |
| Italian | 755 | 2.1% |
| Japanese | 37 | 0.1% |
| Korean | 614 | 1.8% |
| Laotian | 10 | 0.0% |
| Lebanese | 6 | 0.0% |
| Malaysian | 23 | 0.1% |
| Maltese | 21 | 0.1% |
| Mexican | 11,304 | 32.2% |
| Mexican American Indian | 332 | 0.9% |
| Native Hawaiian | 8 | 0.0% |
| Nicaraguan | 11 | 0.0% |
| Nigerian | 62 | 0.2% |
| Northern European | 111 | 0.3% |
| Norwegian | 2,119 | 6.0% |
| Pakistani | 40 | 0.1% |
| Palestinian | 17 | 0.1% |
| Panamanian | 18 | 0.1% |
| Polish | 388 | 1.1% |
| Portuguese | 63 | 0.2% |
| Potawatomi | 35 | 0.1% |
| Puerto Rican | 84 | 0.2% |
| Romanian | 1 | 0.0% |
| Russian | 619 | 1.8% |
| Salvadoran | 204 | 0.6% |
| Scandinavian | 316 | 0.9% |
| Scotch-Irish | 488 | 1.4% |
| Scottish | 843 | 2.4% |
| Shoshone | 46 | 0.1% |
| Sioux | 58 | 0.2% |
| Slavic | 18 | 0.1% |
| Slovak | 24 | 0.1% |
| Slovene | 13 | 0.0% |
| South American | 200 | 0.6% |
| South American Indian | 5 | 0.0% |
| Spaniard | 99 | 0.3% |
| Sri Lankan | 136 | 0.4% |
| Subsaharan African | 158 | 0.4% |
| Swedish | 1,100 | 3.1% |
| Swiss | 66 | 0.2% |
| Thai | 74 | 0.2% |
| Tlingit-Haida | 3 | 0.0% |
| Ukrainian | 194 | 0.5% |
| Welsh | 315 | 0.9% |
| Yakama | 96 | 0.3% |
| Yugoslavian | 16 | 0.1% |
| Yup'ik | 1 | 0.0% | View All 96 Rows |
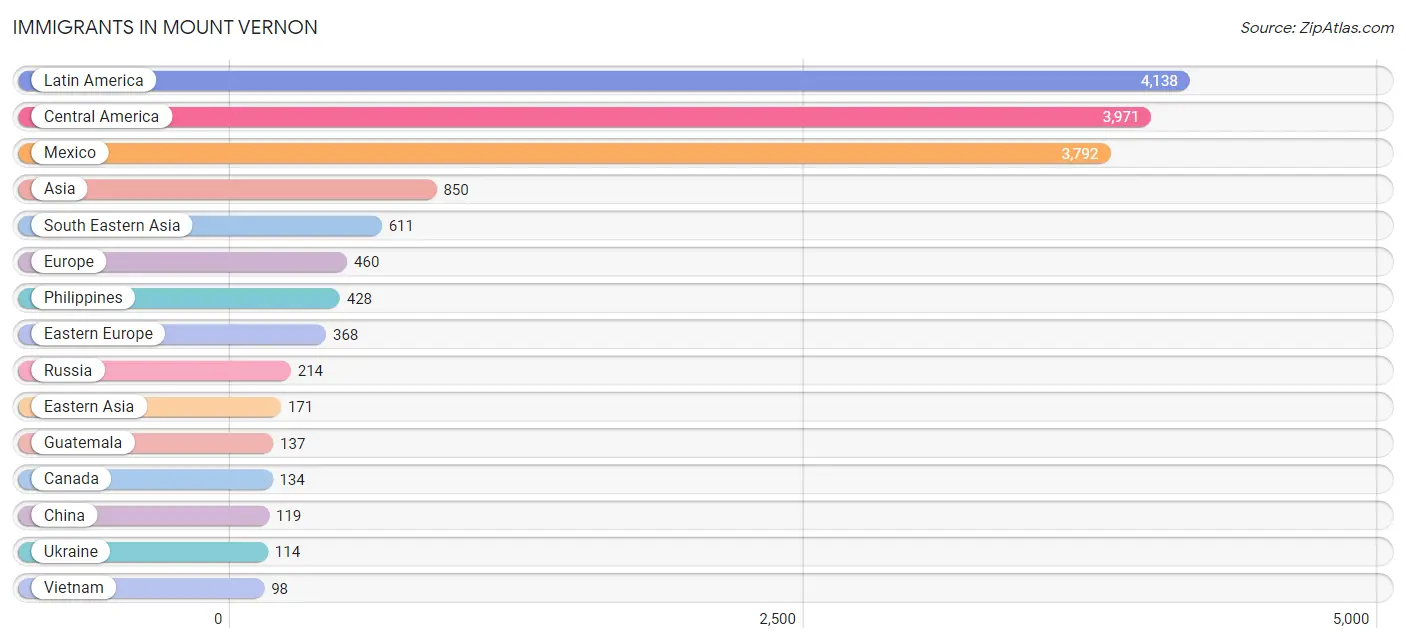
Immigrants in Mount Vernon
The most numerous immigrant groups reported in Mount Vernon came from Latin America (4,138 | 11.8%), Central America (3,971 | 11.3%), Mexico (3,792 | 10.8%), Asia (850 | 2.4%), and South Eastern Asia (611 | 1.7%), together accounting for 38.0% of all Mount Vernon residents.
| Immigration Origin | # Population | % Population |
| Africa | 65 | 0.2% |
| Asia | 850 | 2.4% |
| Australia | 11 | 0.0% |
| Bulgaria | 30 | 0.1% |
| Cambodia | 22 | 0.1% |
| Canada | 134 | 0.4% |
| Caribbean | 71 | 0.2% |
| Central America | 3,971 | 11.3% |
| Chile | 15 | 0.0% |
| China | 119 | 0.3% |
| Colombia | 81 | 0.2% |
| Croatia | 9 | 0.0% |
| Cuba | 71 | 0.2% |
| Eastern Africa | 24 | 0.1% |
| Eastern Asia | 171 | 0.5% |
| Eastern Europe | 368 | 1.1% |
| El Salvador | 15 | 0.0% |
| Europe | 460 | 1.3% |
| Germany | 30 | 0.1% |
| Guatemala | 137 | 0.4% |
| Honduras | 27 | 0.1% |
| Hong Kong | 14 | 0.0% |
| India | 9 | 0.0% |
| Japan | 4 | 0.0% |
| Kenya | 24 | 0.1% |
| Korea | 48 | 0.1% |
| Laos | 23 | 0.1% |
| Latin America | 4,138 | 11.8% |
| Lebanon | 17 | 0.1% |
| Mexico | 3,792 | 10.8% |
| Netherlands | 20 | 0.1% |
| Nigeria | 41 | 0.1% |
| Northern Europe | 28 | 0.1% |
| Norway | 28 | 0.1% |
| Oceania | 11 | 0.0% |
| Pakistan | 32 | 0.1% |
| Philippines | 428 | 1.2% |
| Romania | 1 | 0.0% |
| Russia | 214 | 0.6% |
| South America | 96 | 0.3% |
| South Central Asia | 41 | 0.1% |
| South Eastern Asia | 611 | 1.7% |
| Switzerland | 14 | 0.0% |
| Taiwan | 19 | 0.1% |
| Thailand | 40 | 0.1% |
| Ukraine | 114 | 0.3% |
| Vietnam | 98 | 0.3% |
| Western Africa | 41 | 0.1% |
| Western Asia | 17 | 0.1% |
| Western Europe | 64 | 0.2% | View All 50 Rows |
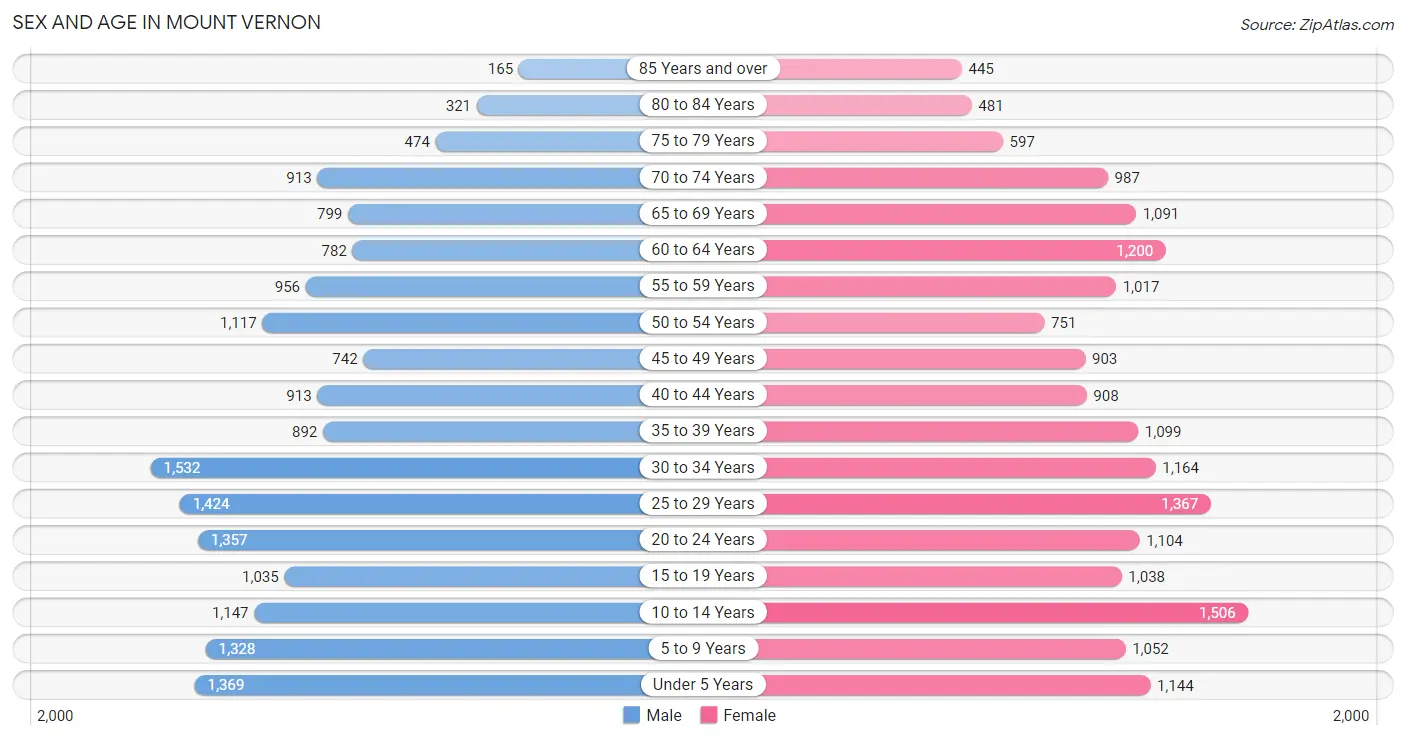
Sex and Age in Mount Vernon
Sex and Age in Mount Vernon
The most populous age groups in Mount Vernon are 30 to 34 Years (1,532 | 8.9%) for men and 10 to 14 Years (1,506 | 8.4%) for women.
| Age Bracket | Male | Female |
| Under 5 Years | 1,369 (7.9%) | 1,144 (6.4%) |
| 5 to 9 Years | 1,328 (7.7%) | 1,052 (5.9%) |
| 10 to 14 Years | 1,147 (6.6%) | 1,506 (8.4%) |
| 15 to 19 Years | 1,035 (6.0%) | 1,038 (5.8%) |
| 20 to 24 Years | 1,357 (7.9%) | 1,104 (6.2%) |
| 25 to 29 Years | 1,424 (8.3%) | 1,367 (7.7%) |
| 30 to 34 Years | 1,532 (8.9%) | 1,164 (6.5%) |
| 35 to 39 Years | 892 (5.2%) | 1,099 (6.2%) |
| 40 to 44 Years | 913 (5.3%) | 908 (5.1%) |
| 45 to 49 Years | 742 (4.3%) | 903 (5.1%) |
| 50 to 54 Years | 1,117 (6.5%) | 751 (4.2%) |
| 55 to 59 Years | 956 (5.5%) | 1,017 (5.7%) |
| 60 to 64 Years | 782 (4.5%) | 1,200 (6.7%) |
| 65 to 69 Years | 799 (4.6%) | 1,091 (6.1%) |
| 70 to 74 Years | 913 (5.3%) | 987 (5.5%) |
| 75 to 79 Years | 474 (2.8%) | 597 (3.3%) |
| 80 to 84 Years | 321 (1.9%) | 481 (2.7%) |
| 85 Years and over | 165 (1.0%) | 445 (2.5%) |
| Total | 17,266 (100.0%) | 17,854 (100.0%) |
Families and Households in Mount Vernon
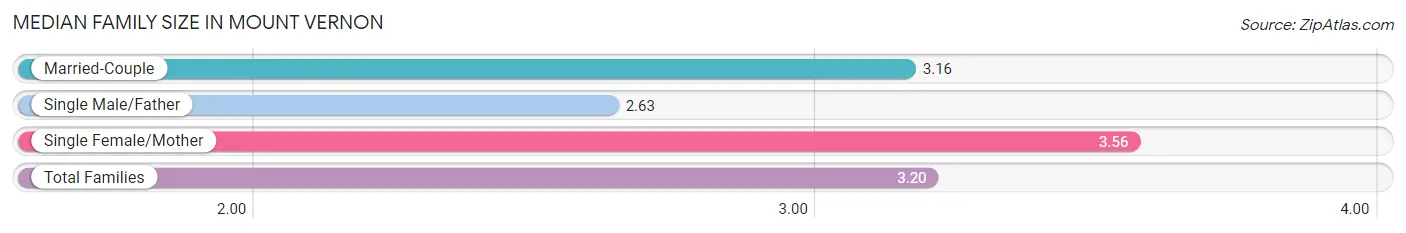
Median Family Size in Mount Vernon
The median family size in Mount Vernon is 3.20 persons per family, with single female/mother families (1,624 | 18.9%) accounting for the largest median family size of 3.56 persons per family. On the other hand, single male/father families (688 | 8.0%) represent the smallest median family size with 2.63 persons per family.
| Family Type | # Families | Family Size |
| Married-Couple | 6,261 (73.0%) | 3.16 |
| Single Male/Father | 688 (8.0%) | 2.63 |
| Single Female/Mother | 1,624 (18.9%) | 3.56 |
| Total Families | 8,573 (100.0%) | 3.20 |
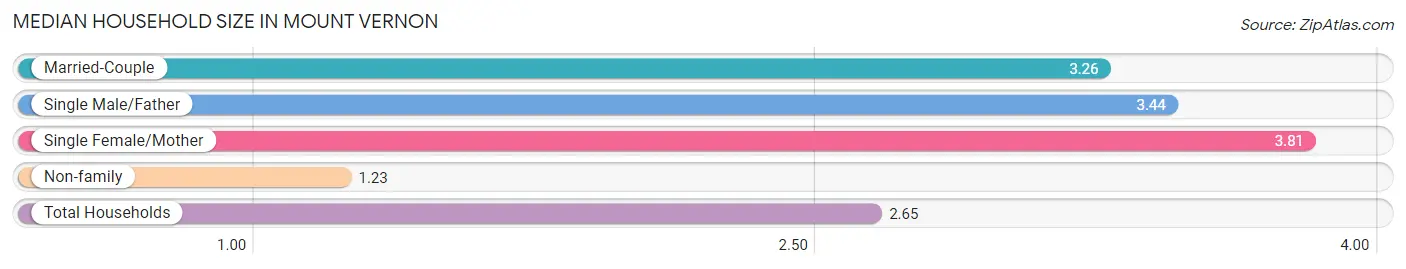
Median Household Size in Mount Vernon
The median household size in Mount Vernon is 2.65 persons per household, with single female/mother households (1,624 | 12.6%) accounting for the largest median household size of 3.81 persons per household. non-family households (4,369 | 33.8%) represent the smallest median household size with 1.23 persons per household.
| Household Type | # Households | Household Size |
| Married-Couple | 6,261 (48.4%) | 3.26 |
| Single Male/Father | 688 (5.3%) | 3.44 |
| Single Female/Mother | 1,624 (12.6%) | 3.81 |
| Non-family | 4,369 (33.8%) | 1.23 |
| Total Households | 12,942 (100.0%) | 2.65 |
Household Size by Marriage Status in Mount Vernon
Out of a total of 12,942 households in Mount Vernon, 8,573 (66.2%) are family households, while 4,369 (33.8%) are nonfamily households. The most numerous type of family households are 2-person households, comprising 3,083, and the most common type of nonfamily households are 1-person households, comprising 3,532.
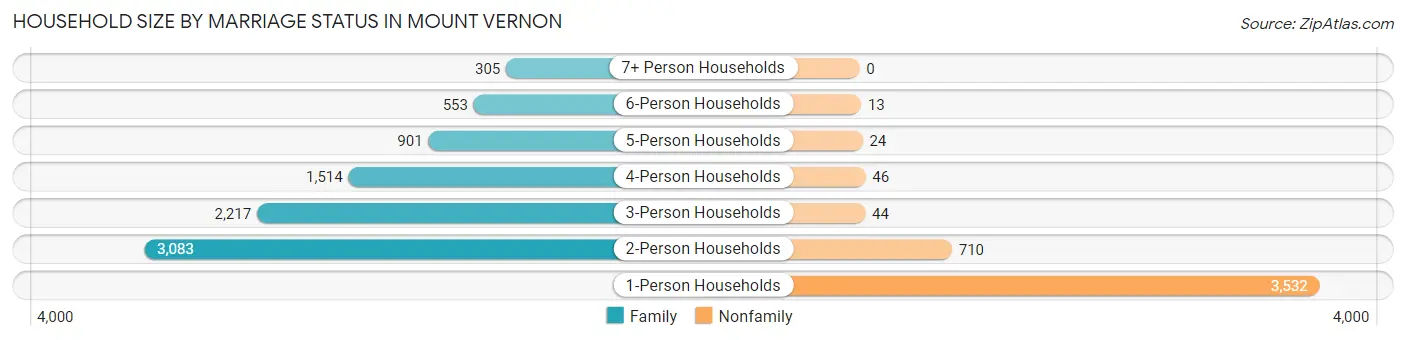
| Household Size | Family Households | Nonfamily Households |
| 1-Person Households | - | 3,532 (27.3%) |
| 2-Person Households | 3,083 (23.8%) | 710 (5.5%) |
| 3-Person Households | 2,217 (17.1%) | 44 (0.3%) |
| 4-Person Households | 1,514 (11.7%) | 46 (0.4%) |
| 5-Person Households | 901 (7.0%) | 24 (0.2%) |
| 6-Person Households | 553 (4.3%) | 13 (0.1%) |
| 7+ Person Households | 305 (2.4%) | 0 (0.0%) |
| Total | 8,573 (66.2%) | 4,369 (33.8%) |
Female Fertility in Mount Vernon
Fertility by Age in Mount Vernon
Average fertility rate in Mount Vernon is 57.0 births per 1,000 women. Women in the age bracket of 20 to 34 years have the highest fertility rate with 115.0 births per 1,000 women. Women in the age bracket of 20 to 34 years acount for 95.2% of all women with births.
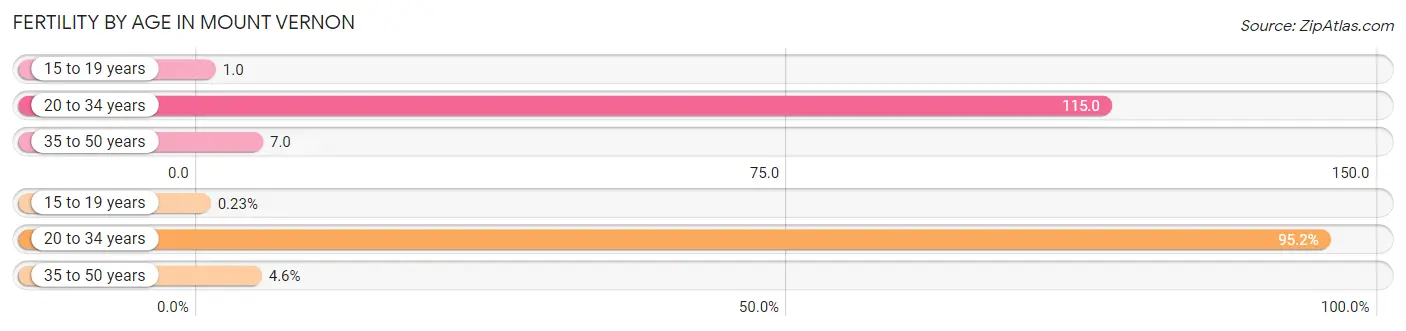
| Age Bracket | Women with Births | Births / 1,000 Women |
| 15 to 19 years | 1 (0.2%) | 1.0 |
| 20 to 34 years | 418 (95.2%) | 115.0 |
| 35 to 50 years | 20 (4.6%) | 7.0 |
| Total | 439 (100.0%) | 57.0 |
Fertility by Age by Marriage Status in Mount Vernon
58.8% of women with births (439) in Mount Vernon are married. The highest percentage of unmarried women with births falls into 15 to 19 years age bracket with 100.0% of them unmarried at the time of birth, while the lowest percentage of unmarried women with births belong to 35 to 50 years age bracket with 0.0% of them unmarried.
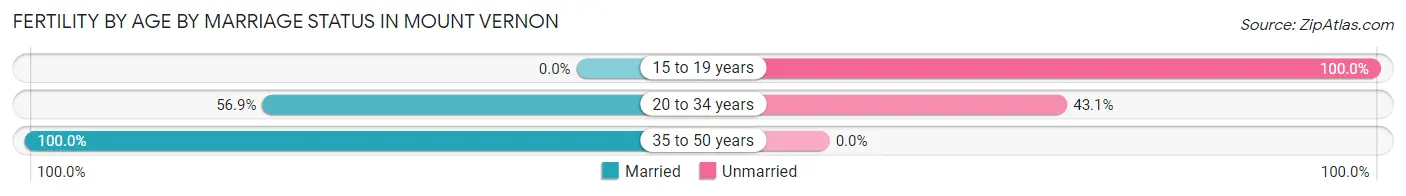
| Age Bracket | Married | Unmarried |
| 15 to 19 years | 0 (0.0%) | 1 (100.0%) |
| 20 to 34 years | 238 (56.9%) | 180 (43.1%) |
| 35 to 50 years | 20 (100.0%) | 0 (0.0%) |
| Total | 258 (58.8%) | 181 (41.2%) |
Fertility by Education in Mount Vernon
Average fertility rate in Mount Vernon is 57.0 births per 1,000 women. Women with the education attainment of graduate degree have the highest fertility rate of 171.0 births per 1,000 women, while women with the education attainment of bachelor's degree have the lowest fertility at 19.0 births per 1,000 women. Women with the education attainment of high school diploma represent 29.2% of all women with births.
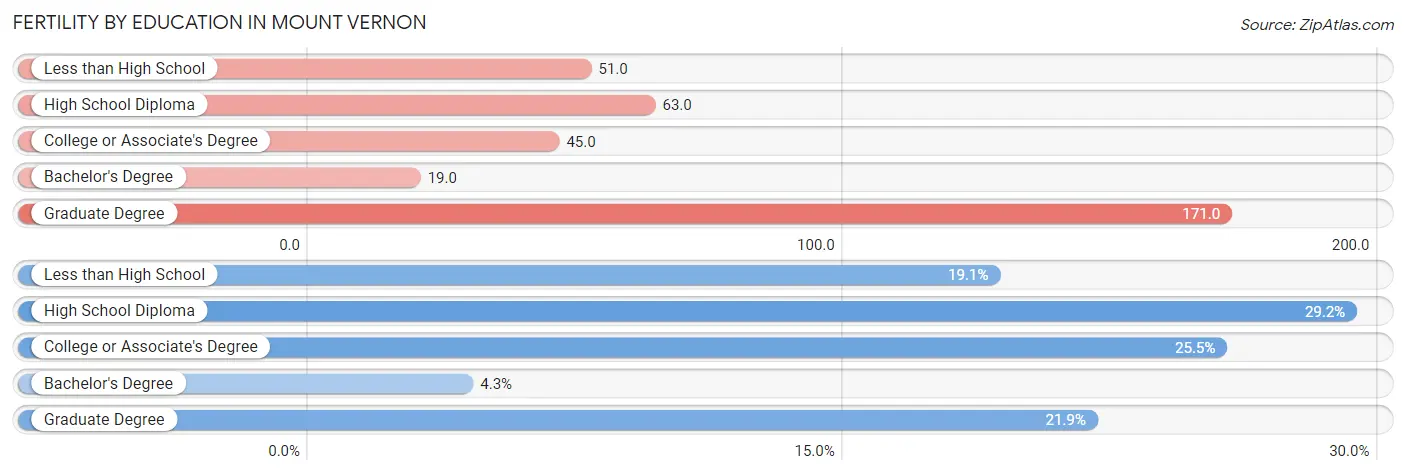
| Educational Attainment | Women with Births | Births / 1,000 Women |
| Less than High School | 84 (19.1%) | 51.0 |
| High School Diploma | 128 (29.2%) | 63.0 |
| College or Associate's Degree | 112 (25.5%) | 45.0 |
| Bachelor's Degree | 19 (4.3%) | 19.0 |
| Graduate Degree | 96 (21.9%) | 171.0 |
| Total | 439 (100.0%) | 57.0 |
Fertility by Education by Marriage Status in Mount Vernon
41.2% of women with births in Mount Vernon are unmarried. Women with the educational attainment of graduate degree are most likely to be married with 100.0% of them married at childbirth, while women with the educational attainment of high school diploma are least likely to be married with 82.8% of them unmarried at childbirth.
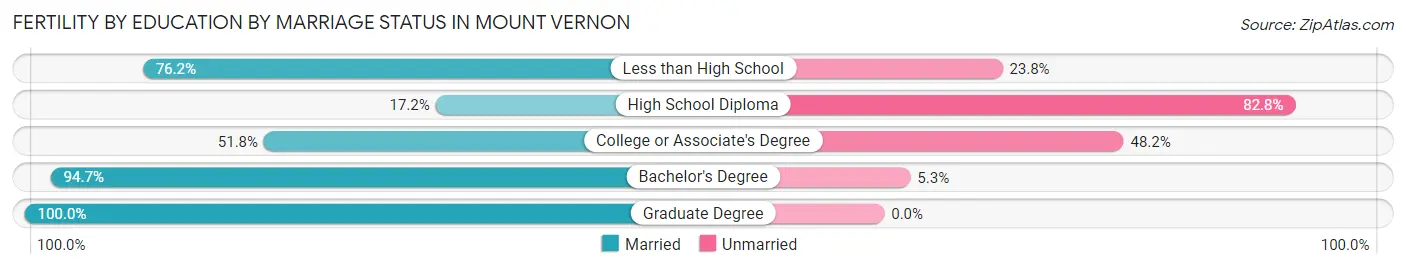
| Educational Attainment | Married | Unmarried |
| Less than High School | 64 (76.2%) | 20 (23.8%) |
| High School Diploma | 22 (17.2%) | 106 (82.8%) |
| College or Associate's Degree | 58 (51.8%) | 54 (48.2%) |
| Bachelor's Degree | 18 (94.7%) | 1 (5.3%) |
| Graduate Degree | 96 (100.0%) | 0 (0.0%) |
| Total | 258 (58.8%) | 181 (41.2%) |
Employment Characteristics in Mount Vernon
Employment by Class of Employer in Mount Vernon
Among the 15,280 employed individuals in Mount Vernon, private company employees (10,017 | 65.6%), local government employees (1,564 | 10.2%), and not-for-profit organizations (1,078 | 7.0%) make up the most common classes of employment.
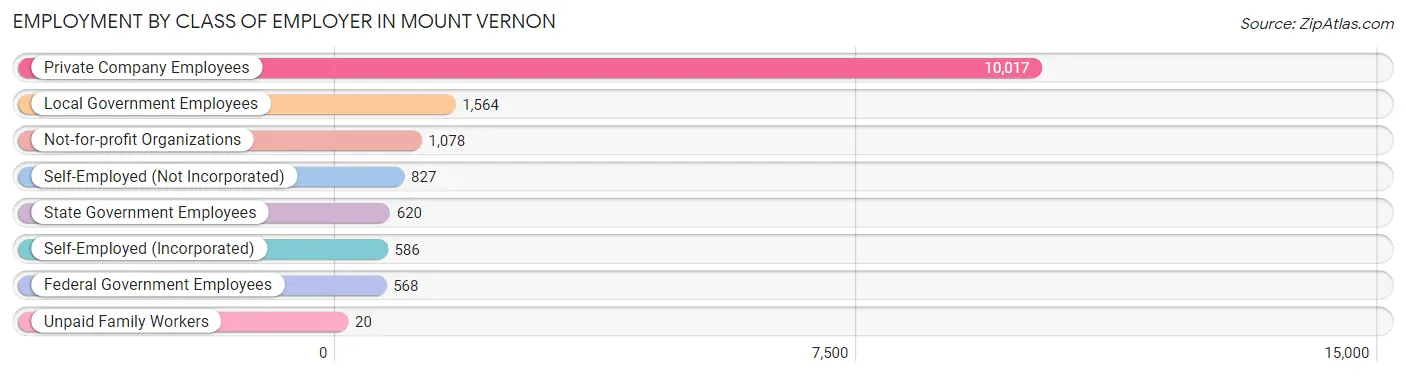
| Employer Class | # Employees | % Employees |
| Private Company Employees | 10,017 | 65.6% |
| Self-Employed (Incorporated) | 586 | 3.8% |
| Self-Employed (Not Incorporated) | 827 | 5.4% |
| Not-for-profit Organizations | 1,078 | 7.0% |
| Local Government Employees | 1,564 | 10.2% |
| State Government Employees | 620 | 4.1% |
| Federal Government Employees | 568 | 3.7% |
| Unpaid Family Workers | 20 | 0.1% |
| Total | 15,280 | 100.0% |
Employment Status by Age in Mount Vernon
According to the labor force statistics for Mount Vernon, out of the total population over 16 years of age (27,243), 61.6% or 16,782 individuals are in the labor force, with 6.3% or 1,057 of them unemployed. The age group with the highest labor force participation rate is 25 to 29 years, with 84.4% or 2,356 individuals in the labor force. Within the labor force, the 16 to 19 years age range has the highest percentage of unemployed individuals, with 26.9% or 202 of them being unemployed.
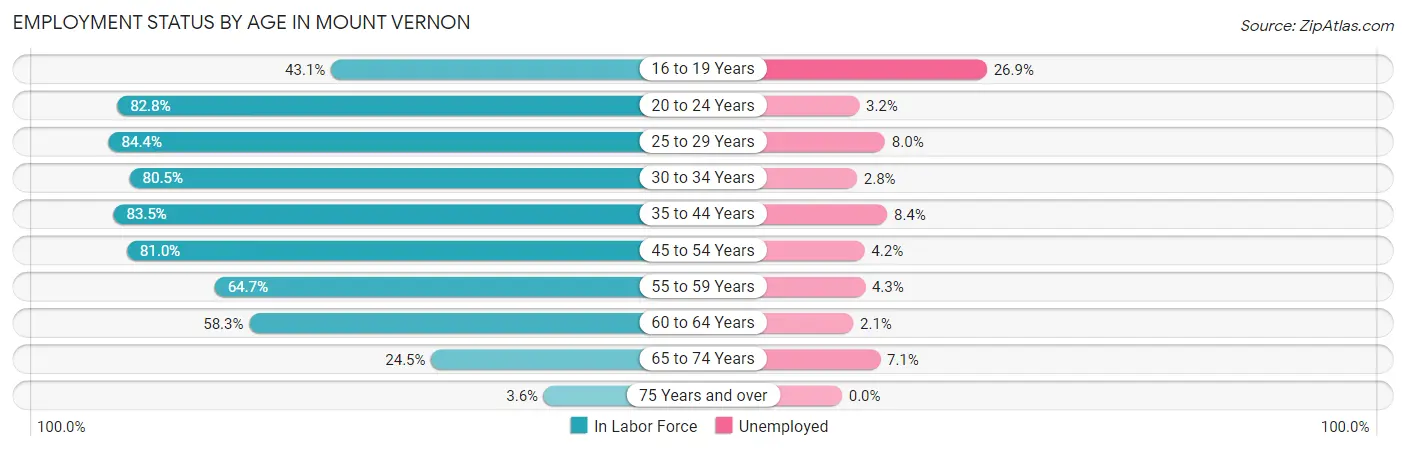
| Age Bracket | In Labor Force | Unemployed |
| 16 to 19 Years | 751 (43.1%) | 202 (26.9%) |
| 20 to 24 Years | 2,038 (82.8%) | 65 (3.2%) |
| 25 to 29 Years | 2,356 (84.4%) | 188 (8.0%) |
| 30 to 34 Years | 2,170 (80.5%) | 61 (2.8%) |
| 35 to 44 Years | 3,183 (83.5%) | 267 (8.4%) |
| 45 to 54 Years | 2,846 (81.0%) | 120 (4.2%) |
| 55 to 59 Years | 1,277 (64.7%) | 55 (4.3%) |
| 60 to 64 Years | 1,156 (58.3%) | 24 (2.1%) |
| 65 to 74 Years | 929 (24.5%) | 66 (7.1%) |
| 75 Years and over | 89 (3.6%) | 0 (0.0%) |
| Total | 16,782 (61.6%) | 1,057 (6.3%) |
Employment Status by Educational Attainment in Mount Vernon
According to labor force statistics for Mount Vernon, 77.5% of individuals (12,994) out of the total population between 25 and 64 years of age (16,767) are in the labor force, with 5.5% or 715 of them being unemployed. The group with the highest labor force participation rate are those with the educational attainment of bachelor's degree or higher, with 89.1% or 3,411 individuals in the labor force. Within the labor force, individuals with less than high school education have the highest percentage of unemployment, with 14.8% or 275 of them being unemployed.
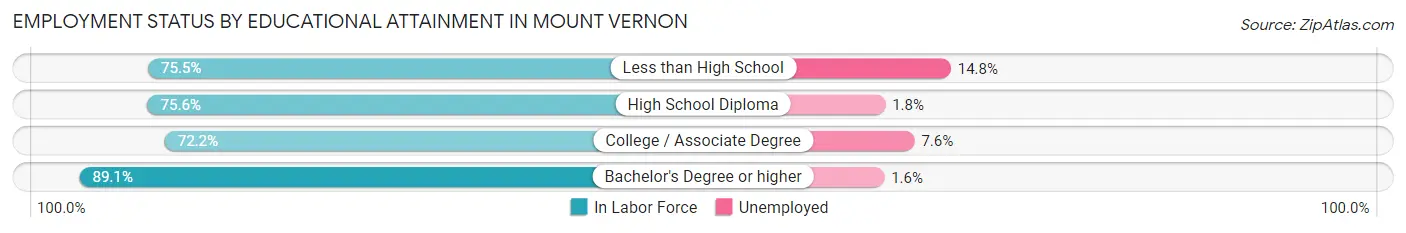
| Educational Attainment | In Labor Force | Unemployed |
| Less than High School | 1,861 (75.5%) | 365 (14.8%) |
| High School Diploma | 3,497 (75.6%) | 83 (1.8%) |
| College / Associate Degree | 4,222 (72.2%) | 444 (7.6%) |
| Bachelor's Degree or higher | 3,411 (89.1%) | 61 (1.6%) |
| Total | 12,994 (77.5%) | 922 (5.5%) |
Employment Occupations by Sex in Mount Vernon
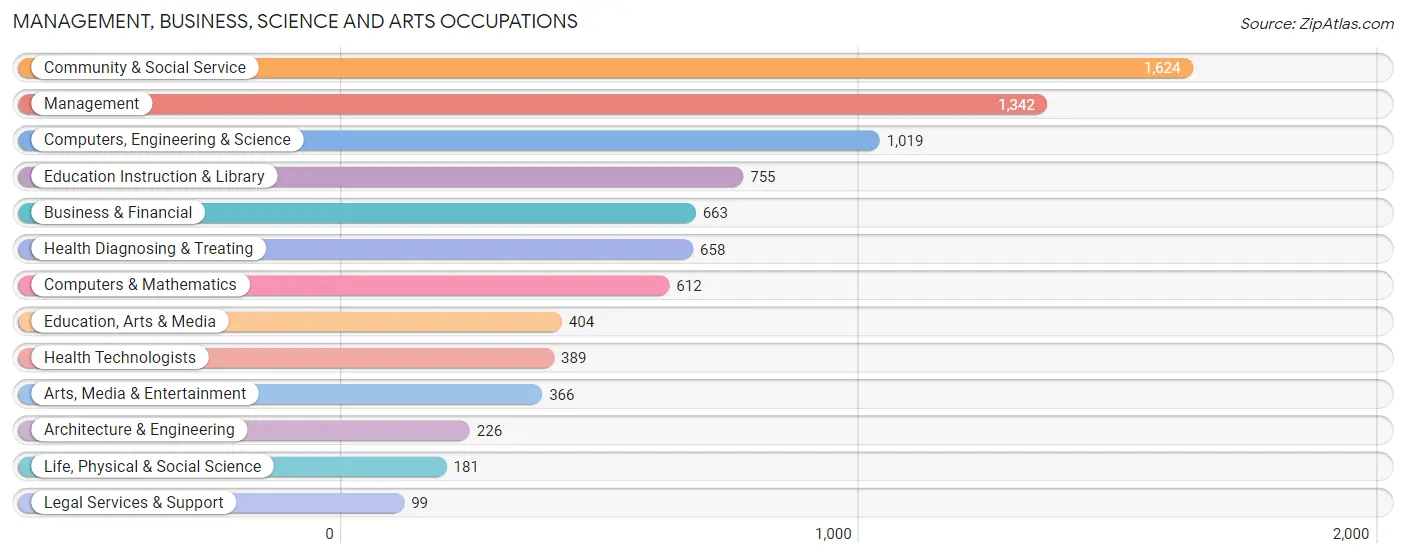
Management, Business, Science and Arts Occupations
The most common Management, Business, Science and Arts occupations in Mount Vernon are Community & Social Service (1,624 | 10.5%), Management (1,342 | 8.6%), Computers, Engineering & Science (1,019 | 6.6%), Education Instruction & Library (755 | 4.9%), and Business & Financial (663 | 4.3%).
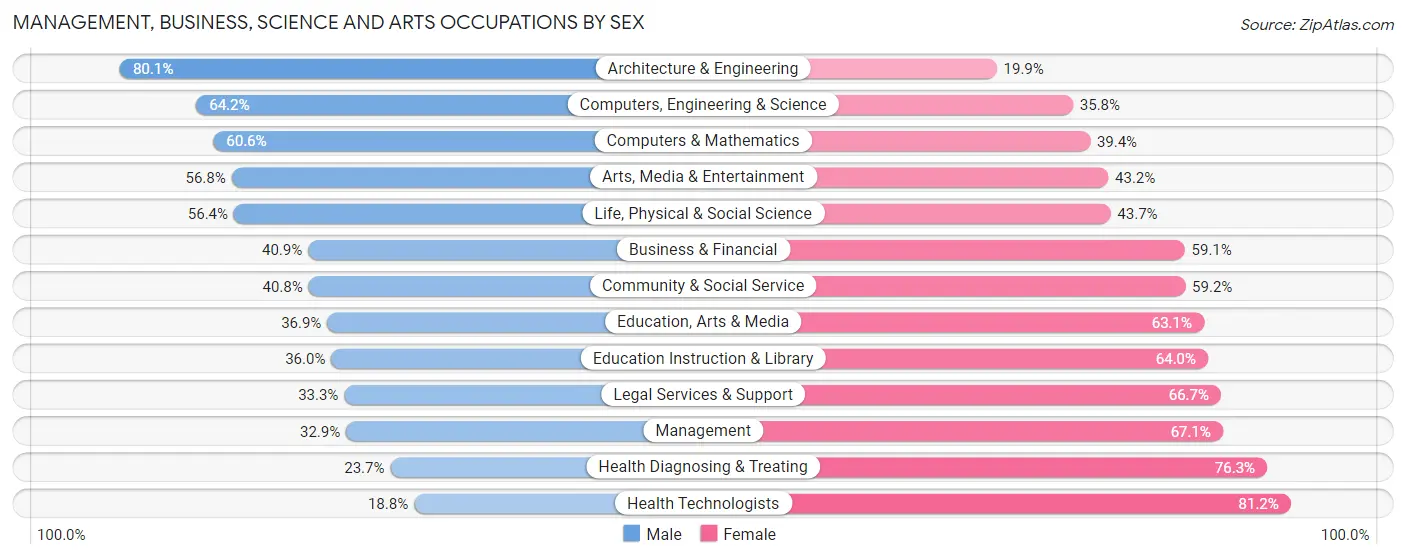
Management, Business, Science and Arts Occupations by Sex
Within the Management, Business, Science and Arts occupations in Mount Vernon, the most male-oriented occupations are Architecture & Engineering (80.1%), Computers, Engineering & Science (64.2%), and Computers & Mathematics (60.6%), while the most female-oriented occupations are Health Technologists (81.2%), Health Diagnosing & Treating (76.3%), and Management (67.1%).
| Occupation | Male | Female |
| Management | 442 (32.9%) | 900 (67.1%) |
| Business & Financial | 271 (40.9%) | 392 (59.1%) |
| Computers, Engineering & Science | 654 (64.2%) | 365 (35.8%) |
| Computers & Mathematics | 371 (60.6%) | 241 (39.4%) |
| Architecture & Engineering | 181 (80.1%) | 45 (19.9%) |
| Life, Physical & Social Science | 102 (56.4%) | 79 (43.6%) |
| Community & Social Service | 662 (40.8%) | 962 (59.2%) |
| Education, Arts & Media | 149 (36.9%) | 255 (63.1%) |
| Legal Services & Support | 33 (33.3%) | 66 (66.7%) |
| Education Instruction & Library | 272 (36.0%) | 483 (64.0%) |
| Arts, Media & Entertainment | 208 (56.8%) | 158 (43.2%) |
| Health Diagnosing & Treating | 156 (23.7%) | 502 (76.3%) |
| Health Technologists | 73 (18.8%) | 316 (81.2%) |
| Total (Category) | 2,185 (41.2%) | 3,121 (58.8%) |
| Total (Overall) | 8,309 (53.5%) | 7,211 (46.5%) |
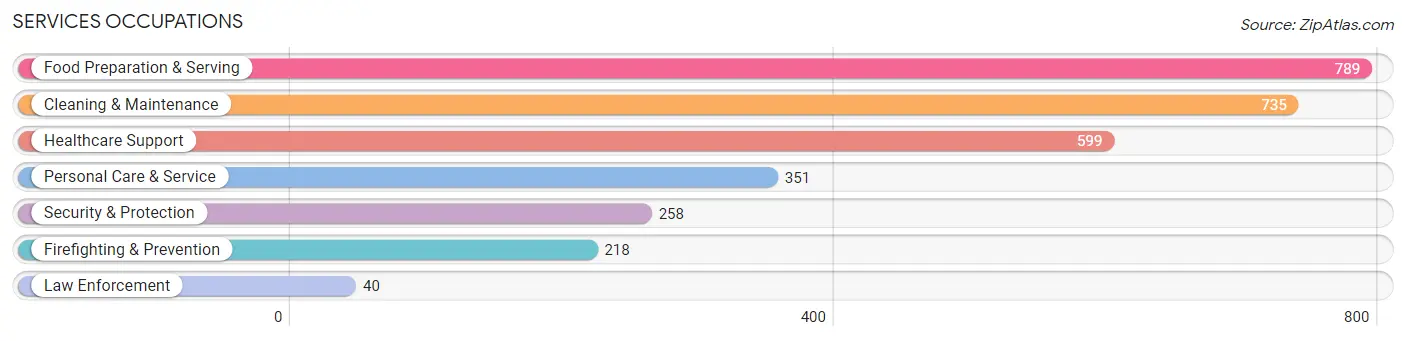
Services Occupations
The most common Services occupations in Mount Vernon are Food Preparation & Serving (789 | 5.1%), Cleaning & Maintenance (735 | 4.7%), Healthcare Support (599 | 3.9%), Personal Care & Service (351 | 2.3%), and Security & Protection (258 | 1.7%).
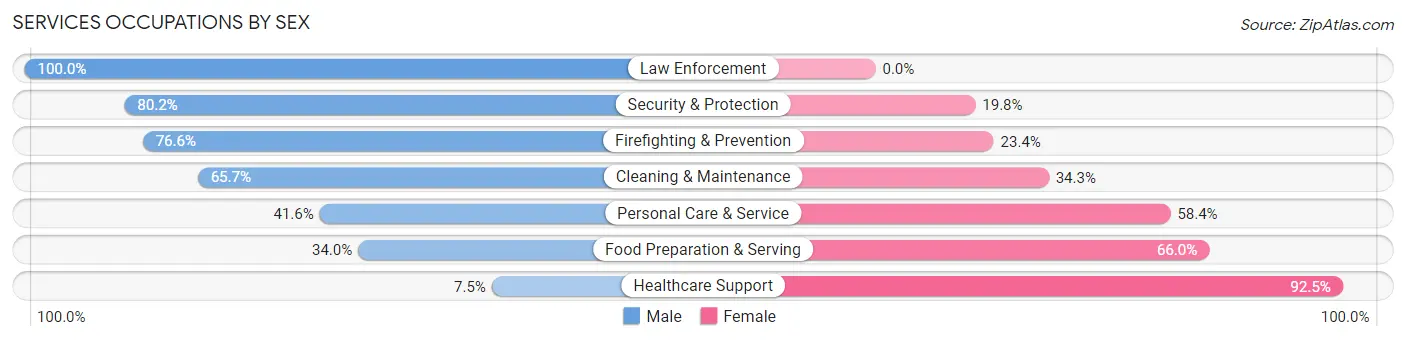
Services Occupations by Sex
Within the Services occupations in Mount Vernon, the most male-oriented occupations are Law Enforcement (100.0%), Security & Protection (80.2%), and Firefighting & Prevention (76.6%), while the most female-oriented occupations are Healthcare Support (92.5%), Food Preparation & Serving (66.0%), and Personal Care & Service (58.4%).
| Occupation | Male | Female |
| Healthcare Support | 45 (7.5%) | 554 (92.5%) |
| Security & Protection | 207 (80.2%) | 51 (19.8%) |
| Firefighting & Prevention | 167 (76.6%) | 51 (23.4%) |
| Law Enforcement | 40 (100.0%) | 0 (0.0%) |
| Food Preparation & Serving | 268 (34.0%) | 521 (66.0%) |
| Cleaning & Maintenance | 483 (65.7%) | 252 (34.3%) |
| Personal Care & Service | 146 (41.6%) | 205 (58.4%) |
| Total (Category) | 1,149 (42.1%) | 1,583 (57.9%) |
| Total (Overall) | 8,309 (53.5%) | 7,211 (46.5%) |
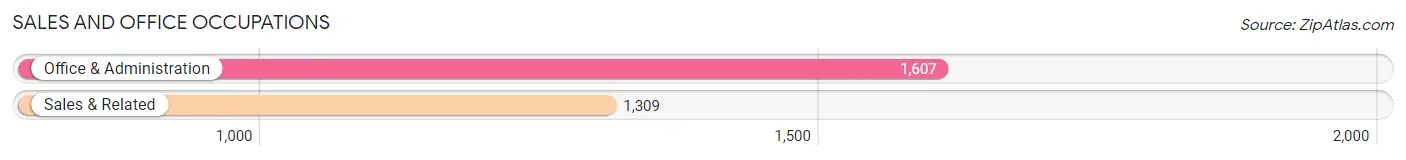
Sales and Office Occupations
The most common Sales and Office occupations in Mount Vernon are Office & Administration (1,607 | 10.3%), and Sales & Related (1,309 | 8.4%).
Sales and Office Occupations by Sex
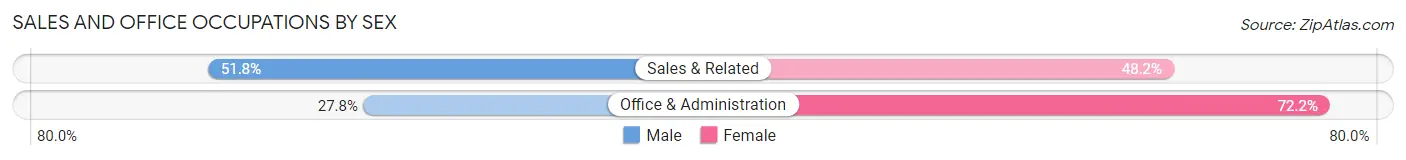
| Occupation | Male | Female |
| Sales & Related | 678 (51.8%) | 631 (48.2%) |
| Office & Administration | 447 (27.8%) | 1,160 (72.2%) |
| Total (Category) | 1,125 (38.6%) | 1,791 (61.4%) |
| Total (Overall) | 8,309 (53.5%) | 7,211 (46.5%) |
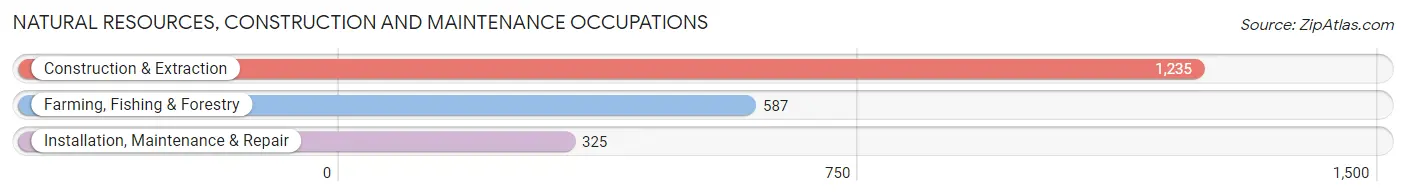
Natural Resources, Construction and Maintenance Occupations
The most common Natural Resources, Construction and Maintenance occupations in Mount Vernon are Construction & Extraction (1,235 | 8.0%), Farming, Fishing & Forestry (587 | 3.8%), and Installation, Maintenance & Repair (325 | 2.1%).
Natural Resources, Construction and Maintenance Occupations by Sex
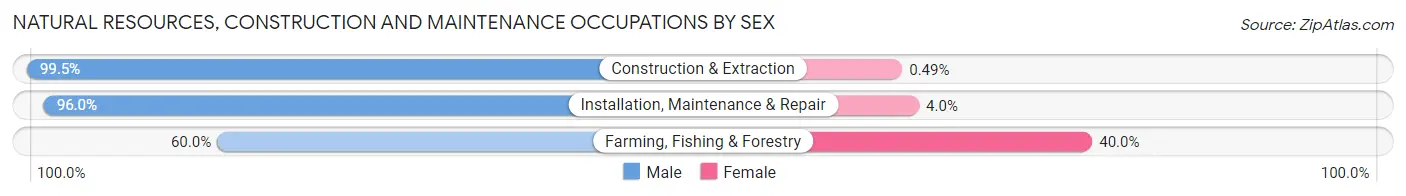
| Occupation | Male | Female |
| Farming, Fishing & Forestry | 352 (60.0%) | 235 (40.0%) |
| Construction & Extraction | 1,229 (99.5%) | 6 (0.5%) |
| Installation, Maintenance & Repair | 312 (96.0%) | 13 (4.0%) |
| Total (Category) | 1,893 (88.2%) | 254 (11.8%) |
| Total (Overall) | 8,309 (53.5%) | 7,211 (46.5%) |
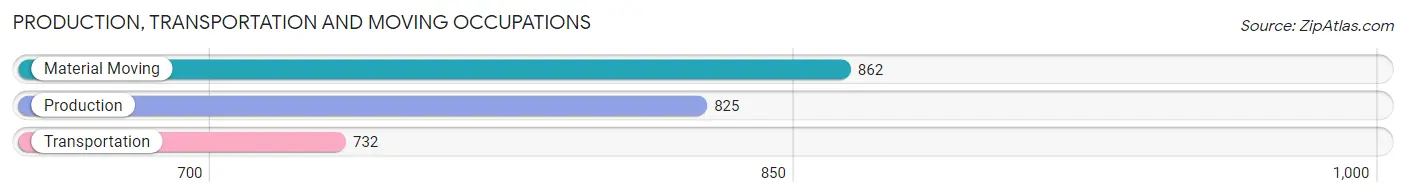
Production, Transportation and Moving Occupations
The most common Production, Transportation and Moving occupations in Mount Vernon are Material Moving (862 | 5.6%), Production (825 | 5.3%), and Transportation (732 | 4.7%).
Production, Transportation and Moving Occupations by Sex
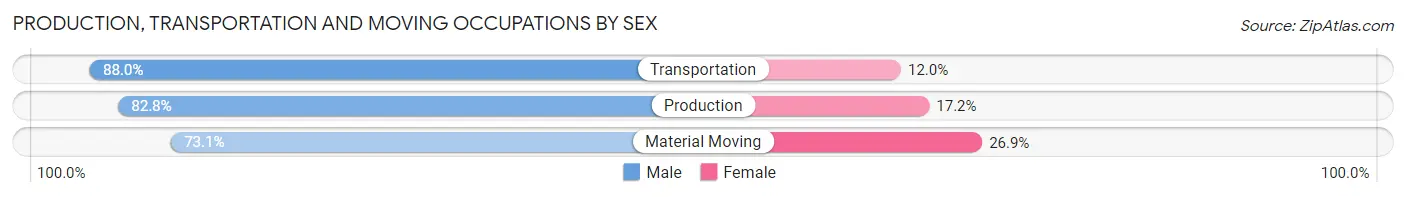
| Occupation | Male | Female |
| Production | 683 (82.8%) | 142 (17.2%) |
| Transportation | 644 (88.0%) | 88 (12.0%) |
| Material Moving | 630 (73.1%) | 232 (26.9%) |
| Total (Category) | 1,957 (80.9%) | 462 (19.1%) |
| Total (Overall) | 8,309 (53.5%) | 7,211 (46.5%) |
Employment Industries by Sex in Mount Vernon
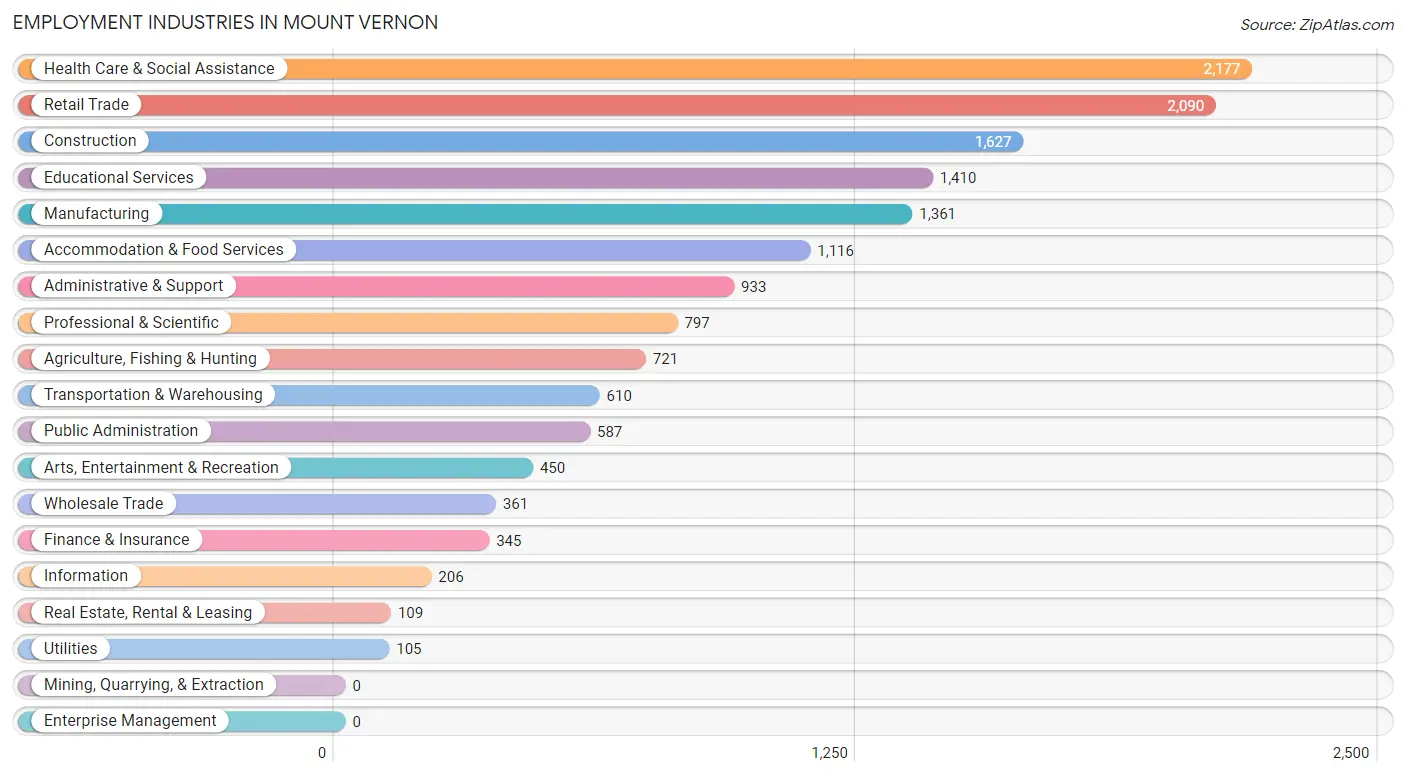
Employment Industries in Mount Vernon
The major employment industries in Mount Vernon include Health Care & Social Assistance (2,177 | 14.0%), Retail Trade (2,090 | 13.5%), Construction (1,627 | 10.5%), Educational Services (1,410 | 9.1%), and Manufacturing (1,361 | 8.8%).
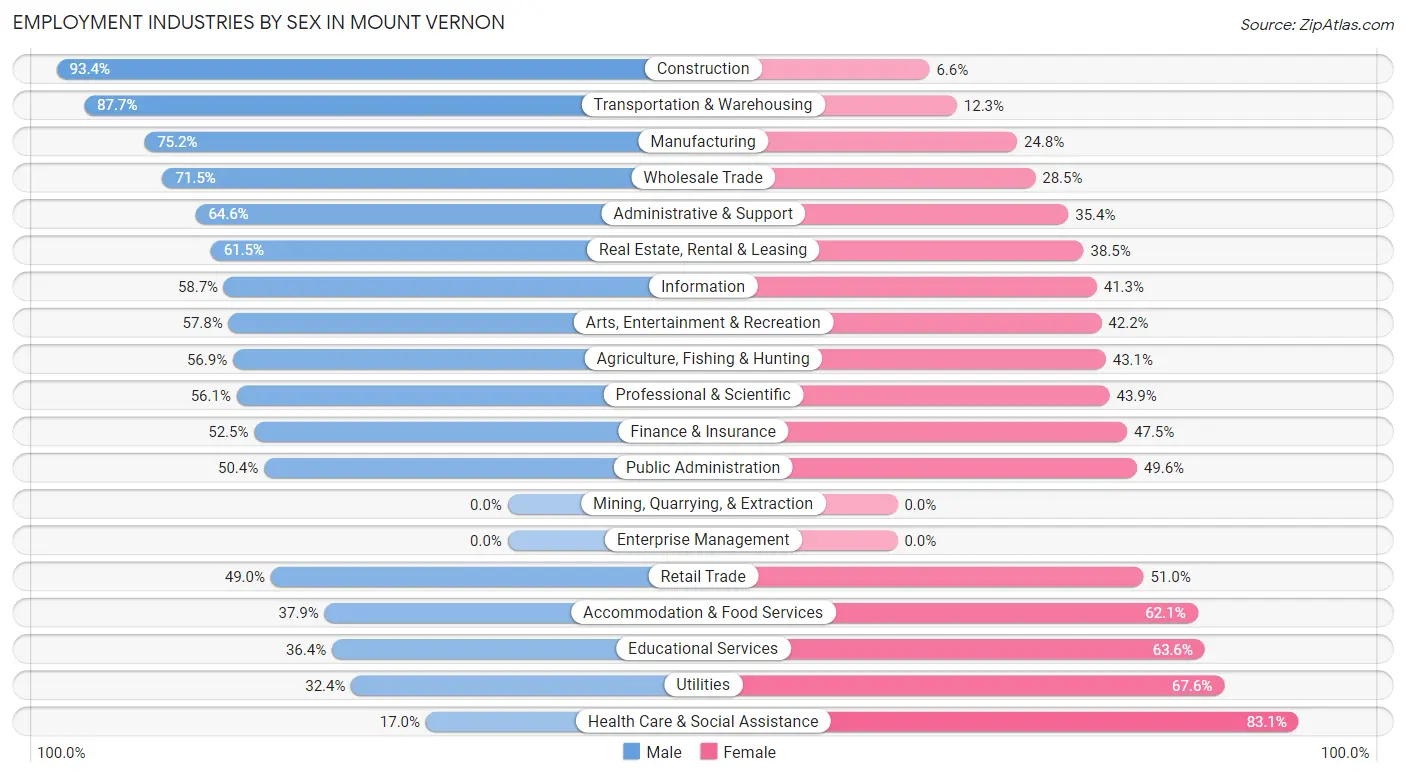
Employment Industries by Sex in Mount Vernon
The Mount Vernon industries that see more men than women are Construction (93.4%), Transportation & Warehousing (87.7%), and Manufacturing (75.2%), whereas the industries that tend to have a higher number of women are Health Care & Social Assistance (83.1%), Utilities (67.6%), and Educational Services (63.6%).
| Industry | Male | Female |
| Agriculture, Fishing & Hunting | 410 (56.9%) | 311 (43.1%) |
| Mining, Quarrying, & Extraction | 0 (0.0%) | 0 (0.0%) |
| Construction | 1,519 (93.4%) | 108 (6.6%) |
| Manufacturing | 1,024 (75.2%) | 337 (24.8%) |
| Wholesale Trade | 258 (71.5%) | 103 (28.5%) |
| Retail Trade | 1,025 (49.0%) | 1,065 (51.0%) |
| Transportation & Warehousing | 535 (87.7%) | 75 (12.3%) |
| Utilities | 34 (32.4%) | 71 (67.6%) |
| Information | 121 (58.7%) | 85 (41.3%) |
| Finance & Insurance | 181 (52.5%) | 164 (47.5%) |
| Real Estate, Rental & Leasing | 67 (61.5%) | 42 (38.5%) |
| Professional & Scientific | 447 (56.1%) | 350 (43.9%) |
| Enterprise Management | 0 (0.0%) | 0 (0.0%) |
| Administrative & Support | 603 (64.6%) | 330 (35.4%) |
| Educational Services | 513 (36.4%) | 897 (63.6%) |
| Health Care & Social Assistance | 369 (17.0%) | 1,808 (83.1%) |
| Arts, Entertainment & Recreation | 260 (57.8%) | 190 (42.2%) |
| Accommodation & Food Services | 423 (37.9%) | 693 (62.1%) |
| Public Administration | 296 (50.4%) | 291 (49.6%) |
| Total | 8,309 (53.5%) | 7,211 (46.5%) |
Education in Mount Vernon
School Enrollment in Mount Vernon
The most common levels of schooling among the 8,902 students in Mount Vernon are middle school (2,015 | 22.6%), elementary school (1,832 | 20.6%), and high school (1,719 | 19.3%).
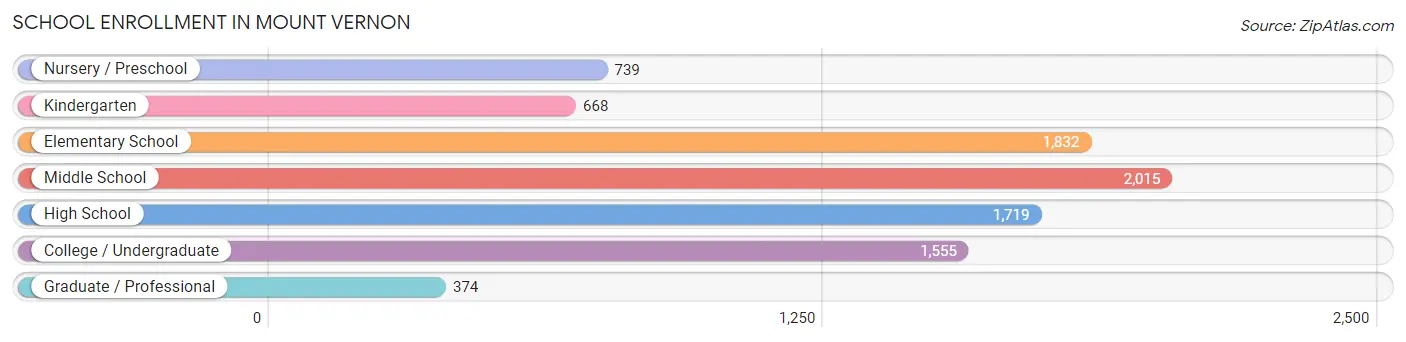
| School Level | # Students | % Students |
| Nursery / Preschool | 739 | 8.3% |
| Kindergarten | 668 | 7.5% |
| Elementary School | 1,832 | 20.6% |
| Middle School | 2,015 | 22.6% |
| High School | 1,719 | 19.3% |
| College / Undergraduate | 1,555 | 17.5% |
| Graduate / Professional | 374 | 4.2% |
| Total | 8,902 | 100.0% |
School Enrollment by Age by Funding Source in Mount Vernon
Out of a total of 8,902 students who are enrolled in schools in Mount Vernon, 1,567 (17.6%) attend a private institution, while the remaining 7,335 (82.4%) are enrolled in public schools. The age group of 3 to 4 year olds has the highest likelihood of being enrolled in private schools, with 406 (65.6% in the age bracket) enrolled. Conversely, the age group of 15 to 17 year olds has the lowest likelihood of being enrolled in a private school, with 1,279 (92.2% in the age bracket) attending a public institution.
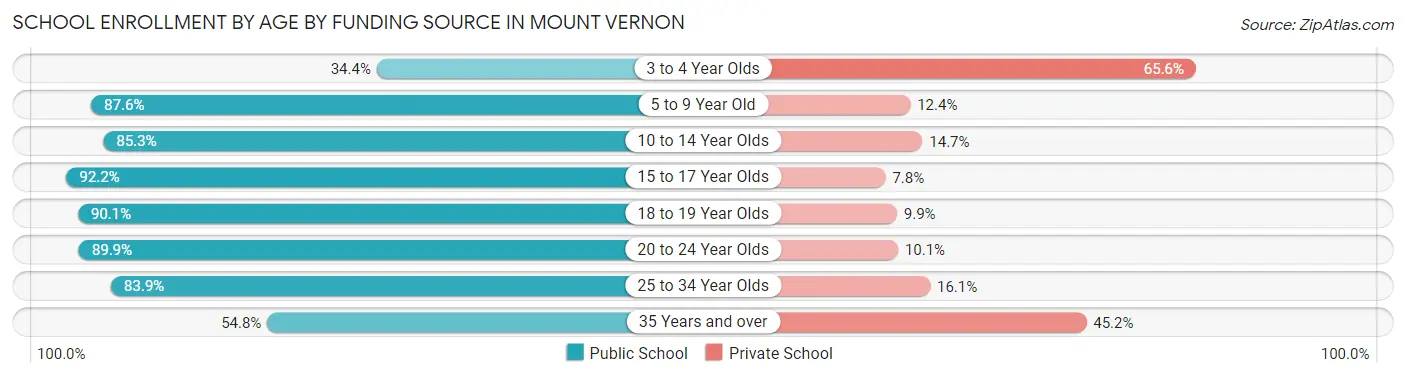
| Age Bracket | Public School | Private School |
| 3 to 4 Year Olds | 213 (34.4%) | 406 (65.6%) |
| 5 to 9 Year Old | 1,914 (87.6%) | 271 (12.4%) |
| 10 to 14 Year Olds | 2,218 (85.3%) | 381 (14.7%) |
| 15 to 17 Year Olds | 1,279 (92.2%) | 108 (7.8%) |
| 18 to 19 Year Olds | 300 (90.1%) | 33 (9.9%) |
| 20 to 24 Year Olds | 711 (89.9%) | 80 (10.1%) |
| 25 to 34 Year Olds | 454 (83.9%) | 87 (16.1%) |
| 35 Years and over | 245 (54.8%) | 202 (45.2%) |
| Total | 7,335 (82.4%) | 1,567 (17.6%) |
Educational Attainment by Field of Study in Mount Vernon
Business (973 | 15.7%), education (728 | 11.7%), science & technology (560 | 9.0%), bio, nature & agricultural (503 | 8.1%), and social sciences (494 | 8.0%) are the most common fields of study among 6,197 individuals in Mount Vernon who have obtained a bachelor's degree or higher.
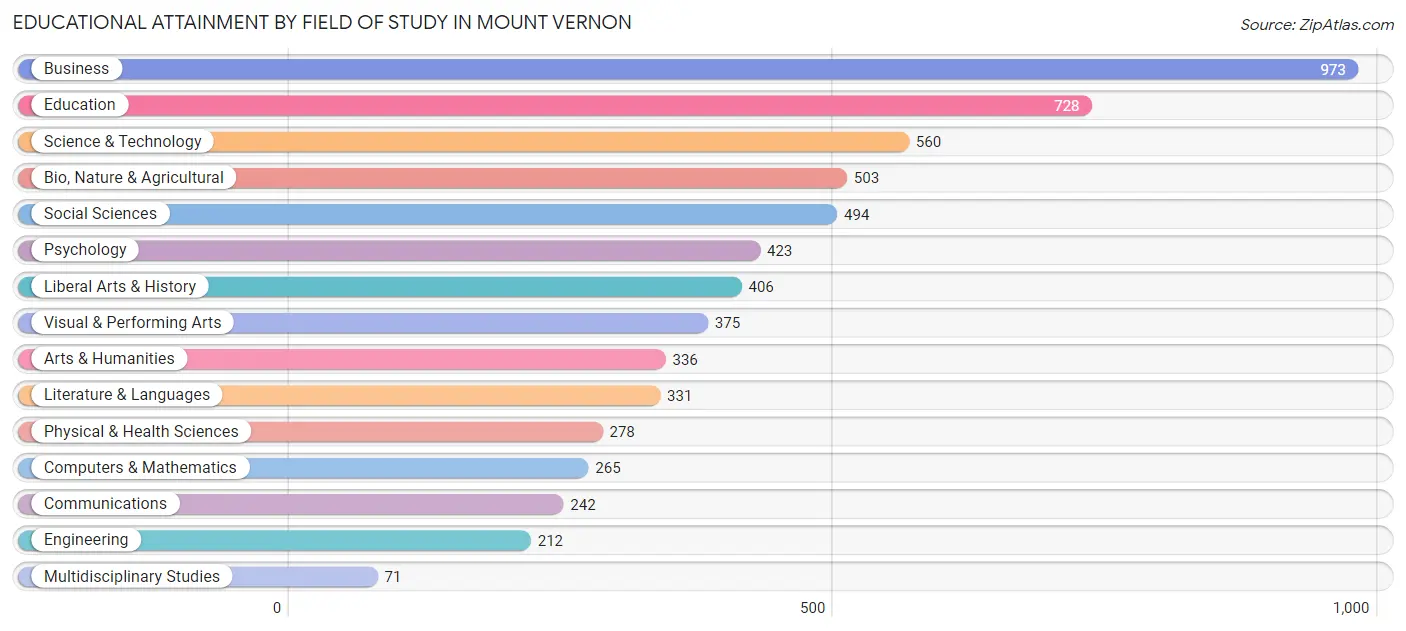
| Field of Study | # Graduates | % Graduates |
| Computers & Mathematics | 265 | 4.3% |
| Bio, Nature & Agricultural | 503 | 8.1% |
| Physical & Health Sciences | 278 | 4.5% |
| Psychology | 423 | 6.8% |
| Social Sciences | 494 | 8.0% |
| Engineering | 212 | 3.4% |
| Multidisciplinary Studies | 71 | 1.1% |
| Science & Technology | 560 | 9.0% |
| Business | 973 | 15.7% |
| Education | 728 | 11.7% |
| Literature & Languages | 331 | 5.3% |
| Liberal Arts & History | 406 | 6.6% |
| Visual & Performing Arts | 375 | 6.0% |
| Communications | 242 | 3.9% |
| Arts & Humanities | 336 | 5.4% |
| Total | 6,197 | 100.0% |
Transportation & Commute in Mount Vernon
Vehicle Availability by Sex in Mount Vernon
The most prevalent vehicle ownership categories in Mount Vernon are males with 2 vehicles (2,955, accounting for 36.2%) and females with 2 vehicles (2,557, making up 42.5%).
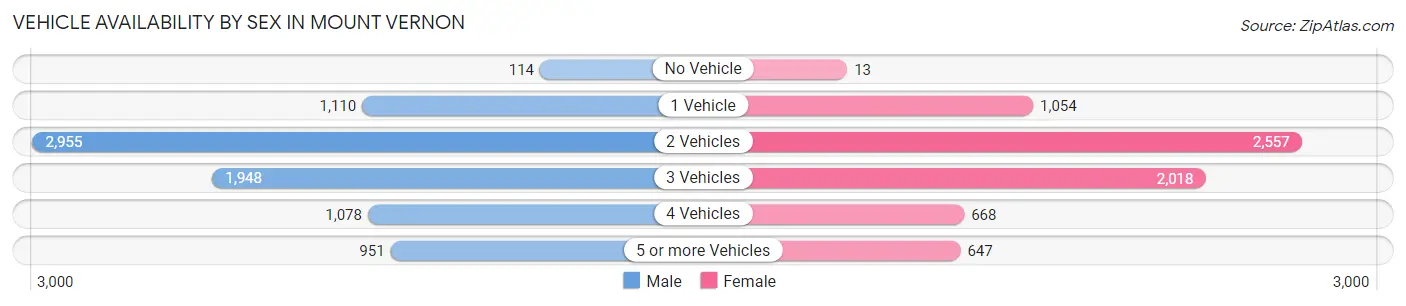
| Vehicles Available | Male | Female |
| No Vehicle | 114 (1.4%) | 13 (0.2%) |
| 1 Vehicle | 1,110 (13.6%) | 1,054 (15.1%) |
| 2 Vehicles | 2,955 (36.2%) | 2,557 (36.7%) |
| 3 Vehicles | 1,948 (23.9%) | 2,018 (29.0%) |
| 4 Vehicles | 1,078 (13.2%) | 668 (9.6%) |
| 5 or more Vehicles | 951 (11.7%) | 647 (9.3%) |
| Total | 8,156 (100.0%) | 6,957 (100.0%) |
Commute Time in Mount Vernon
The most frequently occuring commute durations in Mount Vernon are 10 to 14 minutes (2,763 commuters, 20.5%), 5 to 9 minutes (2,097 commuters, 15.5%), and 15 to 19 minutes (1,795 commuters, 13.3%).
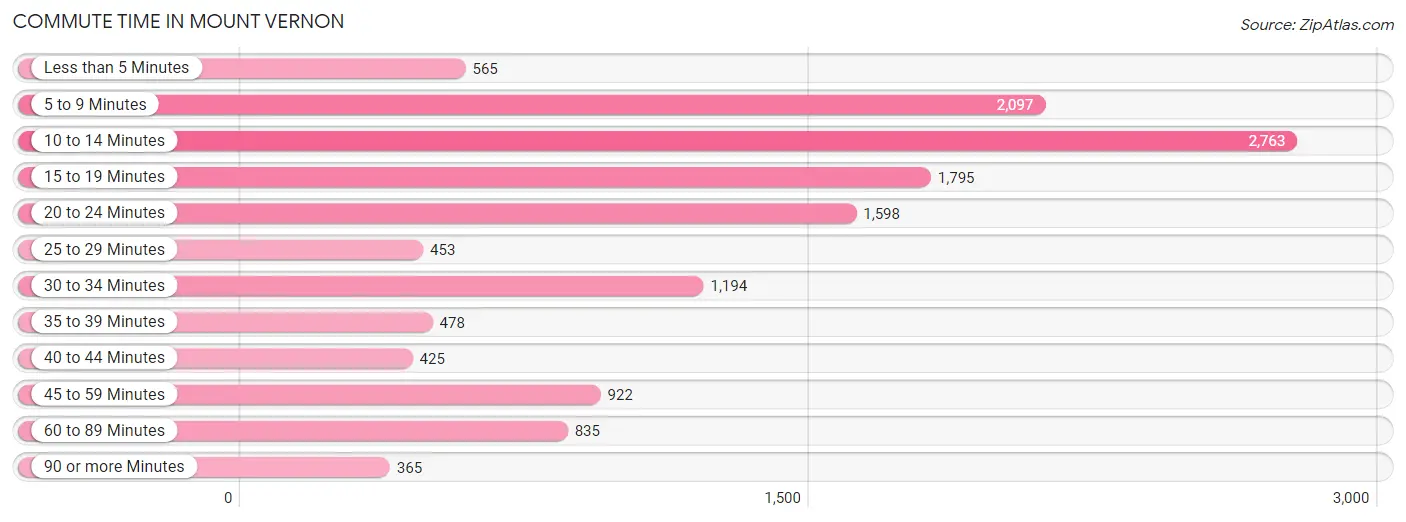
| Commute Time | # Commuters | % Commuters |
| Less than 5 Minutes | 565 | 4.2% |
| 5 to 9 Minutes | 2,097 | 15.5% |
| 10 to 14 Minutes | 2,763 | 20.5% |
| 15 to 19 Minutes | 1,795 | 13.3% |
| 20 to 24 Minutes | 1,598 | 11.8% |
| 25 to 29 Minutes | 453 | 3.4% |
| 30 to 34 Minutes | 1,194 | 8.8% |
| 35 to 39 Minutes | 478 | 3.5% |
| 40 to 44 Minutes | 425 | 3.2% |
| 45 to 59 Minutes | 922 | 6.8% |
| 60 to 89 Minutes | 835 | 6.2% |
| 90 or more Minutes | 365 | 2.7% |
Commute Time by Sex in Mount Vernon
The most common commute times in Mount Vernon are 10 to 14 minutes (1,250 commuters, 16.8%) for males and 10 to 14 minutes (1,513 commuters, 25.1%) for females.
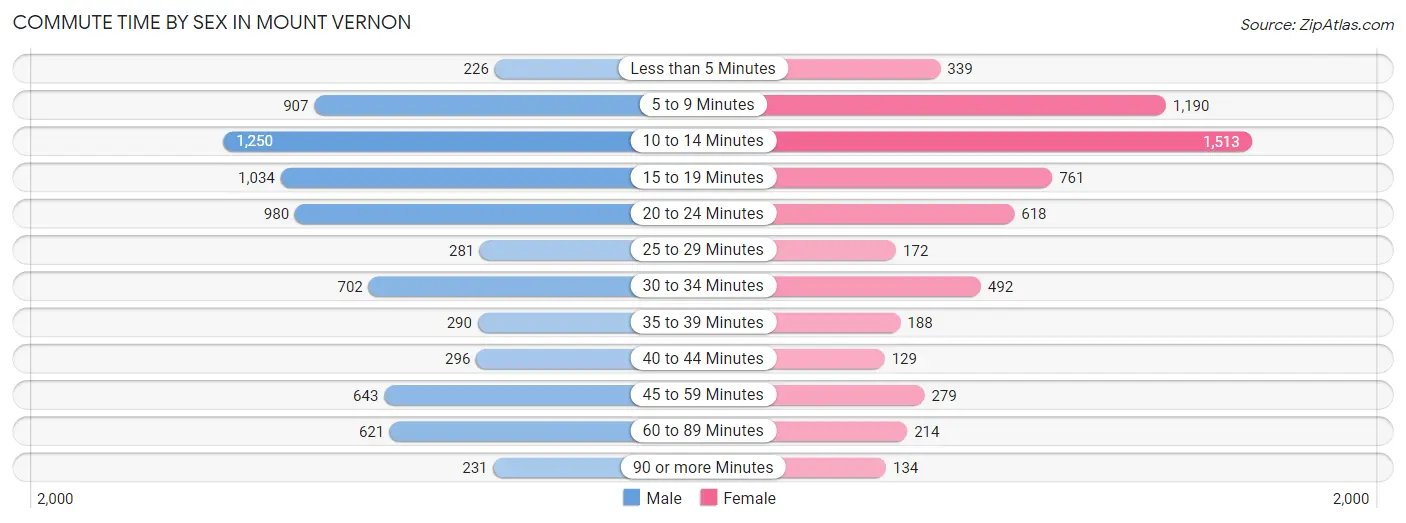
| Commute Time | Male | Female |
| Less than 5 Minutes | 226 (3.0%) | 339 (5.6%) |
| 5 to 9 Minutes | 907 (12.2%) | 1,190 (19.7%) |
| 10 to 14 Minutes | 1,250 (16.8%) | 1,513 (25.1%) |
| 15 to 19 Minutes | 1,034 (13.9%) | 761 (12.6%) |
| 20 to 24 Minutes | 980 (13.1%) | 618 (10.2%) |
| 25 to 29 Minutes | 281 (3.8%) | 172 (2.9%) |
| 30 to 34 Minutes | 702 (9.4%) | 492 (8.2%) |
| 35 to 39 Minutes | 290 (3.9%) | 188 (3.1%) |
| 40 to 44 Minutes | 296 (4.0%) | 129 (2.1%) |
| 45 to 59 Minutes | 643 (8.6%) | 279 (4.6%) |
| 60 to 89 Minutes | 621 (8.3%) | 214 (3.5%) |
| 90 or more Minutes | 231 (3.1%) | 134 (2.2%) |
Time of Departure to Work by Sex in Mount Vernon
The most frequent times of departure to work in Mount Vernon are 7:00 AM to 7:29 AM (982, 13.2%) for males and 7:30 AM to 7:59 AM (1,048, 17.4%) for females.
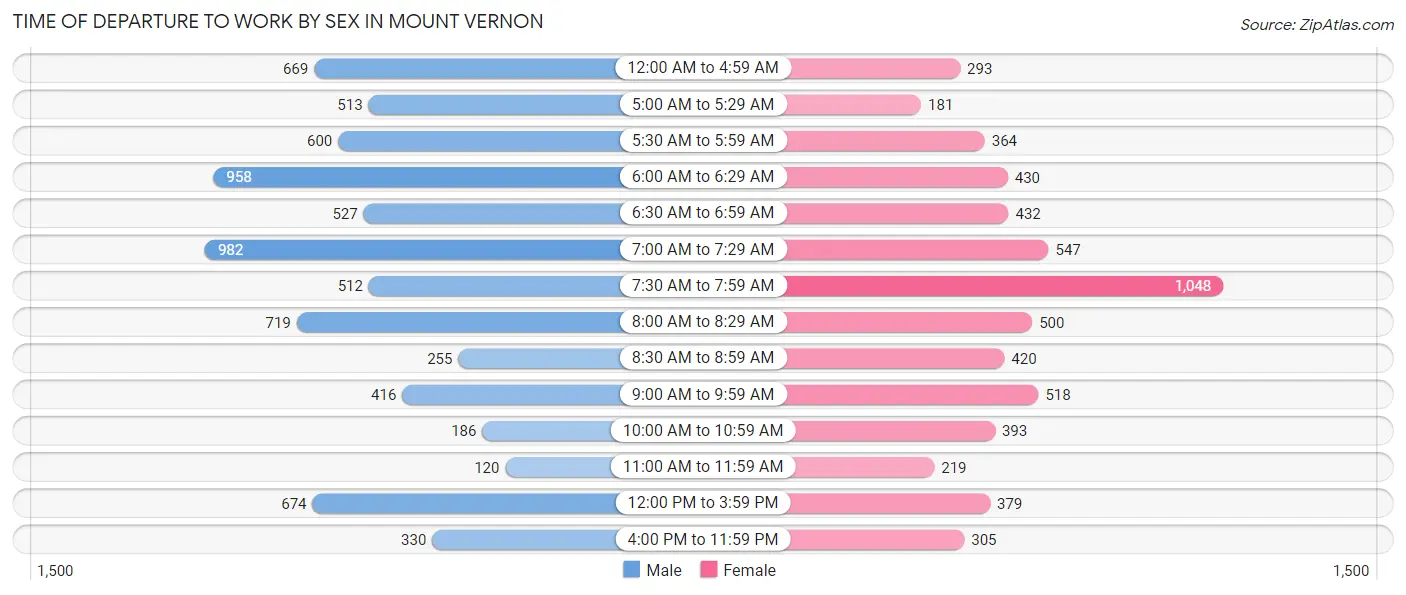
| Time of Departure | Male | Female |
| 12:00 AM to 4:59 AM | 669 (9.0%) | 293 (4.9%) |
| 5:00 AM to 5:29 AM | 513 (6.9%) | 181 (3.0%) |
| 5:30 AM to 5:59 AM | 600 (8.0%) | 364 (6.0%) |
| 6:00 AM to 6:29 AM | 958 (12.8%) | 430 (7.1%) |
| 6:30 AM to 6:59 AM | 527 (7.1%) | 432 (7.2%) |
| 7:00 AM to 7:29 AM | 982 (13.2%) | 547 (9.1%) |
| 7:30 AM to 7:59 AM | 512 (6.9%) | 1,048 (17.4%) |
| 8:00 AM to 8:29 AM | 719 (9.6%) | 500 (8.3%) |
| 8:30 AM to 8:59 AM | 255 (3.4%) | 420 (7.0%) |
| 9:00 AM to 9:59 AM | 416 (5.6%) | 518 (8.6%) |
| 10:00 AM to 10:59 AM | 186 (2.5%) | 393 (6.5%) |
| 11:00 AM to 11:59 AM | 120 (1.6%) | 219 (3.6%) |
| 12:00 PM to 3:59 PM | 674 (9.0%) | 379 (6.3%) |
| 4:00 PM to 11:59 PM | 330 (4.4%) | 305 (5.1%) |
| Total | 7,461 (100.0%) | 6,029 (100.0%) |
Housing Occupancy in Mount Vernon
Occupancy by Ownership in Mount Vernon
Of the total 12,942 dwellings in Mount Vernon, owner-occupied units account for 8,245 (63.7%), while renter-occupied units make up 4,697 (36.3%).
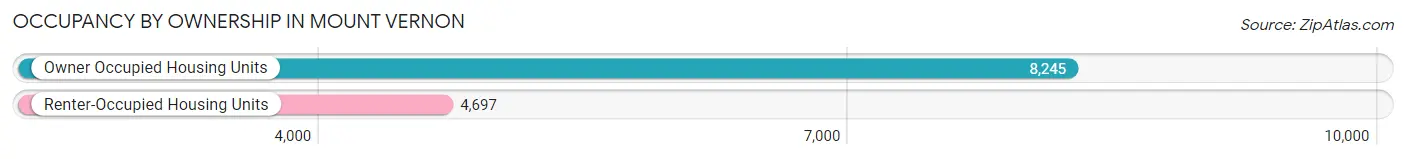
| Occupancy | # Housing Units | % Housing Units |
| Owner Occupied Housing Units | 8,245 | 63.7% |
| Renter-Occupied Housing Units | 4,697 | 36.3% |
| Total Occupied Housing Units | 12,942 | 100.0% |
Occupancy by Household Size in Mount Vernon
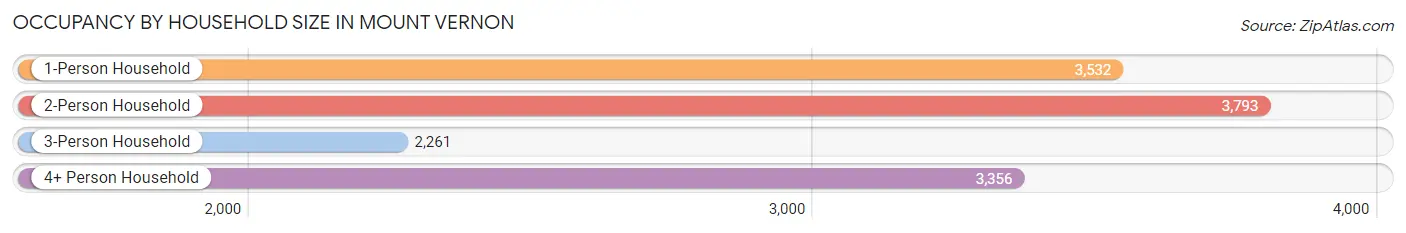
| Household Size | # Housing Units | % Housing Units |
| 1-Person Household | 3,532 | 27.3% |
| 2-Person Household | 3,793 | 29.3% |
| 3-Person Household | 2,261 | 17.5% |
| 4+ Person Household | 3,356 | 25.9% |
| Total Housing Units | 12,942 | 100.0% |
Occupancy by Ownership by Household Size in Mount Vernon
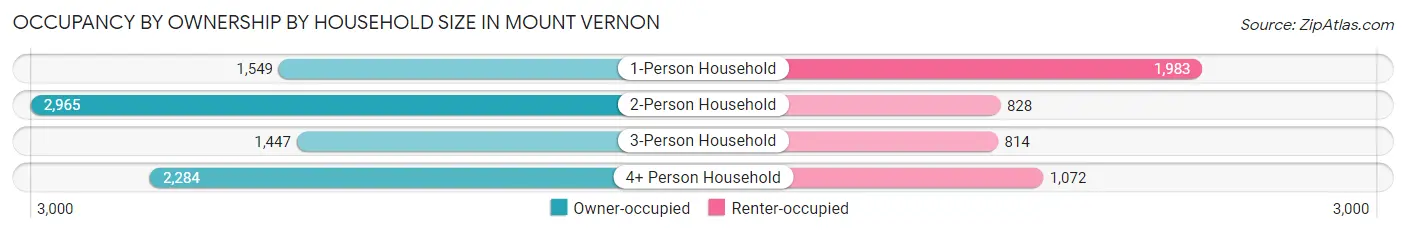
| Household Size | Owner-occupied | Renter-occupied |
| 1-Person Household | 1,549 (43.9%) | 1,983 (56.1%) |
| 2-Person Household | 2,965 (78.2%) | 828 (21.8%) |
| 3-Person Household | 1,447 (64.0%) | 814 (36.0%) |
| 4+ Person Household | 2,284 (68.1%) | 1,072 (31.9%) |
| Total Housing Units | 8,245 (63.7%) | 4,697 (36.3%) |
Occupancy by Educational Attainment in Mount Vernon
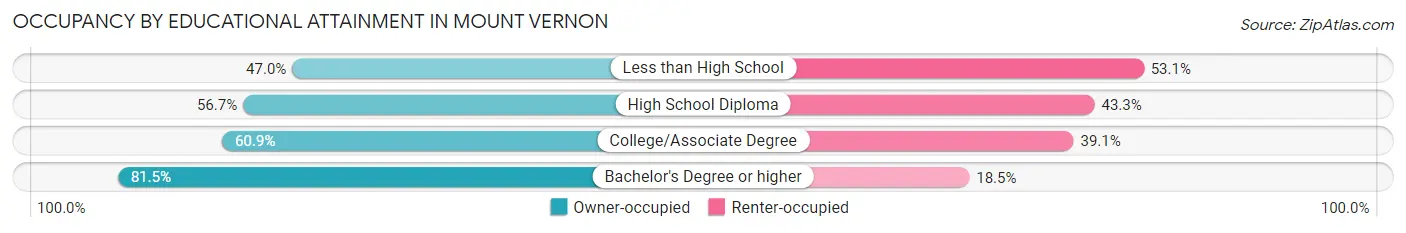
| Household Size | Owner-occupied | Renter-occupied |
| Less than High School | 770 (46.9%) | 870 (53.0%) |
| High School Diploma | 1,654 (56.7%) | 1,263 (43.3%) |
| College/Associate Degree | 2,988 (60.9%) | 1,922 (39.1%) |
| Bachelor's Degree or higher | 2,833 (81.5%) | 642 (18.5%) |
Occupancy by Age of Householder in Mount Vernon
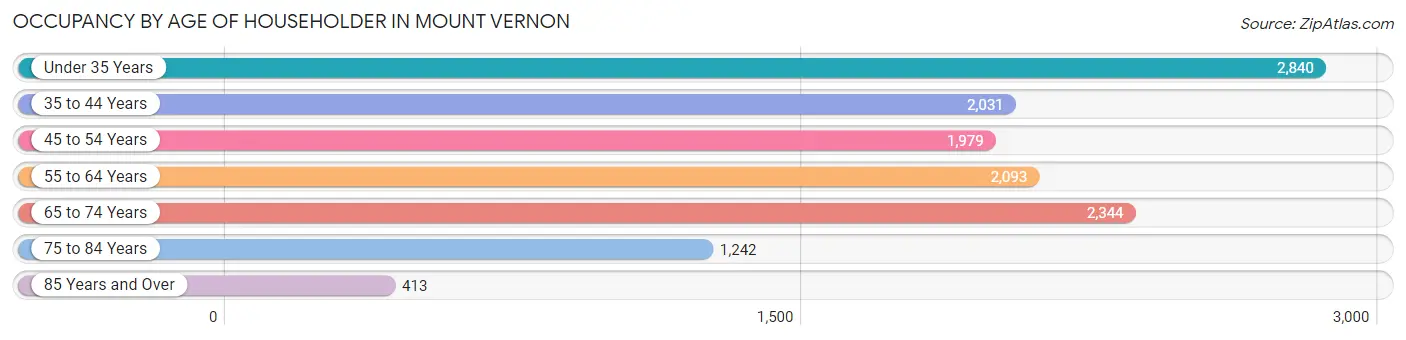
| Age Bracket | # Households | % Households |
| Under 35 Years | 2,840 | 21.9% |
| 35 to 44 Years | 2,031 | 15.7% |
| 45 to 54 Years | 1,979 | 15.3% |
| 55 to 64 Years | 2,093 | 16.2% |
| 65 to 74 Years | 2,344 | 18.1% |
| 75 to 84 Years | 1,242 | 9.6% |
| 85 Years and Over | 413 | 3.2% |
| Total | 12,942 | 100.0% |
Housing Finances in Mount Vernon
Median Income by Occupancy in Mount Vernon
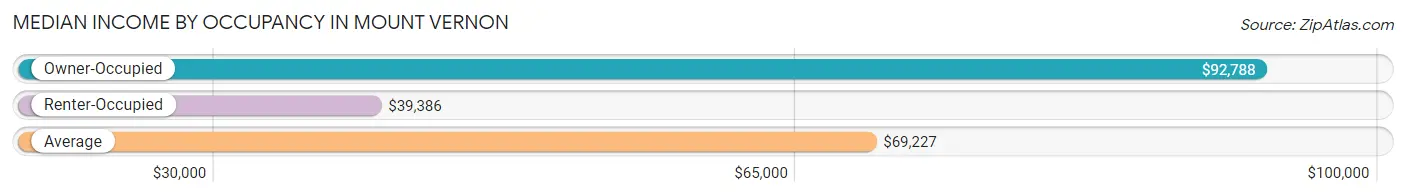
| Occupancy Type | # Households | Median Income |
| Owner-Occupied | 8,245 (63.7%) | $92,788 |
| Renter-Occupied | 4,697 (36.3%) | $39,386 |
| Average | 12,942 (100.0%) | $69,227 |
Occupancy by Householder Income Bracket in Mount Vernon
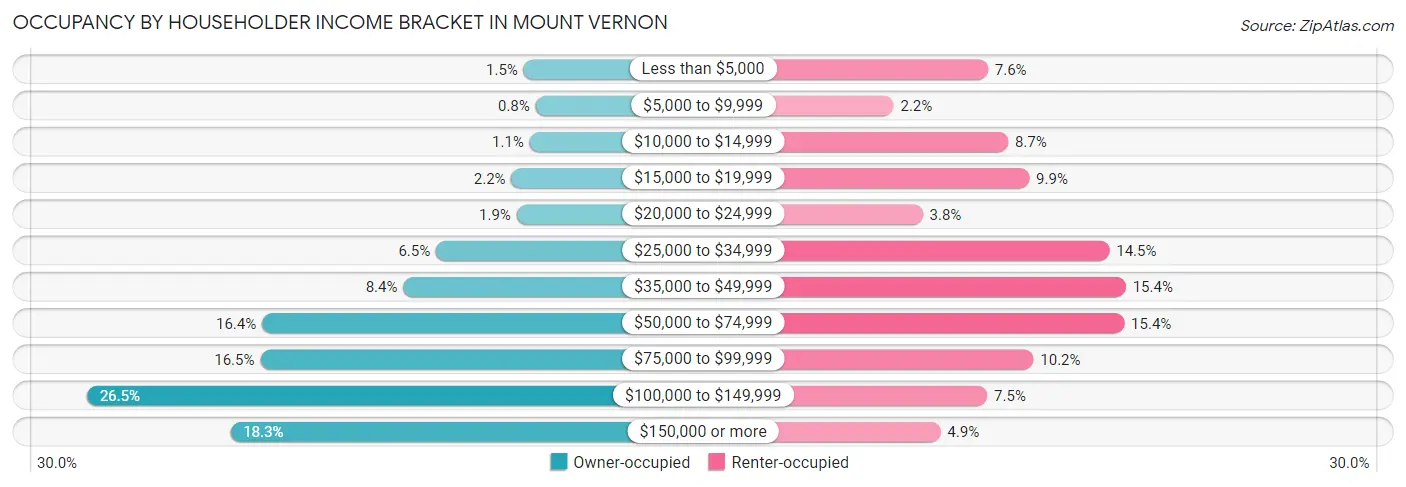
| Income Bracket | Owner-occupied | Renter-occupied |
| Less than $5,000 | 122 (1.5%) | 355 (7.6%) |
| $5,000 to $9,999 | 66 (0.8%) | 102 (2.2%) |
| $10,000 to $14,999 | 94 (1.1%) | 409 (8.7%) |
| $15,000 to $19,999 | 180 (2.2%) | 466 (9.9%) |
| $20,000 to $24,999 | 155 (1.9%) | 180 (3.8%) |
| $25,000 to $34,999 | 535 (6.5%) | 681 (14.5%) |
| $35,000 to $49,999 | 689 (8.4%) | 725 (15.4%) |
| $50,000 to $74,999 | 1,355 (16.4%) | 721 (15.3%) |
| $75,000 to $99,999 | 1,363 (16.5%) | 477 (10.2%) |
| $100,000 to $149,999 | 2,181 (26.5%) | 353 (7.5%) |
| $150,000 or more | 1,505 (18.2%) | 228 (4.9%) |
| Total | 8,245 (100.0%) | 4,697 (100.0%) |
Monthly Housing Cost Tiers in Mount Vernon
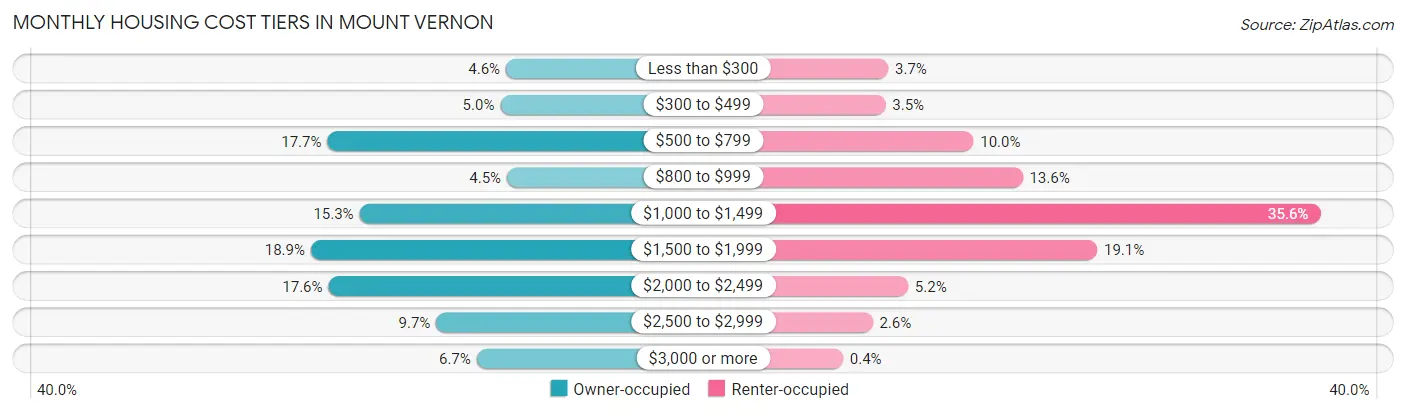
| Monthly Cost | Owner-occupied | Renter-occupied |
| Less than $300 | 375 (4.5%) | 175 (3.7%) |
| $300 to $499 | 410 (5.0%) | 166 (3.5%) |
| $500 to $799 | 1,460 (17.7%) | 470 (10.0%) |
| $800 to $999 | 369 (4.5%) | 640 (13.6%) |
| $1,000 to $1,499 | 1,265 (15.3%) | 1,670 (35.5%) |
| $1,500 to $1,999 | 1,560 (18.9%) | 898 (19.1%) |
| $2,000 to $2,499 | 1,454 (17.6%) | 244 (5.2%) |
| $2,500 to $2,999 | 799 (9.7%) | 121 (2.6%) |
| $3,000 or more | 553 (6.7%) | 19 (0.4%) |
| Total | 8,245 (100.0%) | 4,697 (100.0%) |
Physical Housing Characteristics in Mount Vernon
Housing Structures in Mount Vernon
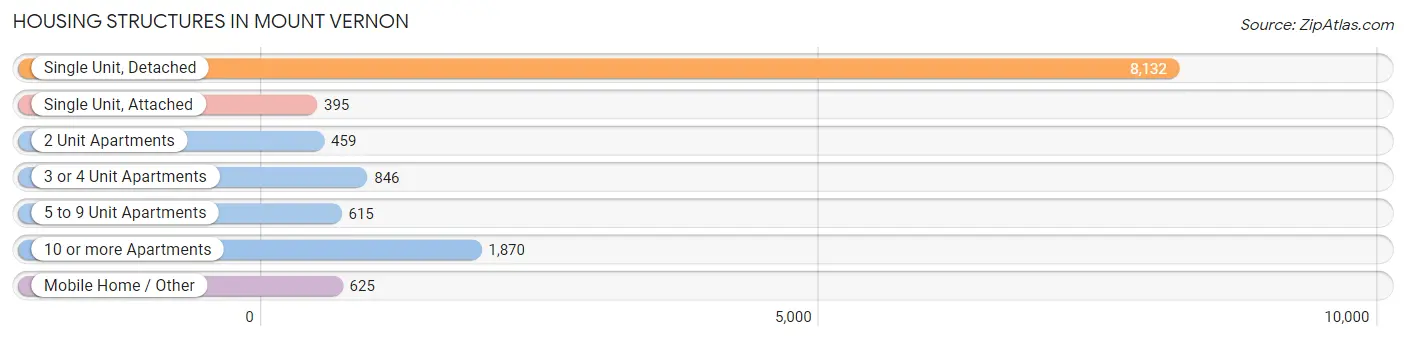
| Structure Type | # Housing Units | % Housing Units |
| Single Unit, Detached | 8,132 | 62.8% |
| Single Unit, Attached | 395 | 3.0% |
| 2 Unit Apartments | 459 | 3.5% |
| 3 or 4 Unit Apartments | 846 | 6.5% |
| 5 to 9 Unit Apartments | 615 | 4.8% |
| 10 or more Apartments | 1,870 | 14.4% |
| Mobile Home / Other | 625 | 4.8% |
| Total | 12,942 | 100.0% |
Housing Structures by Occupancy in Mount Vernon
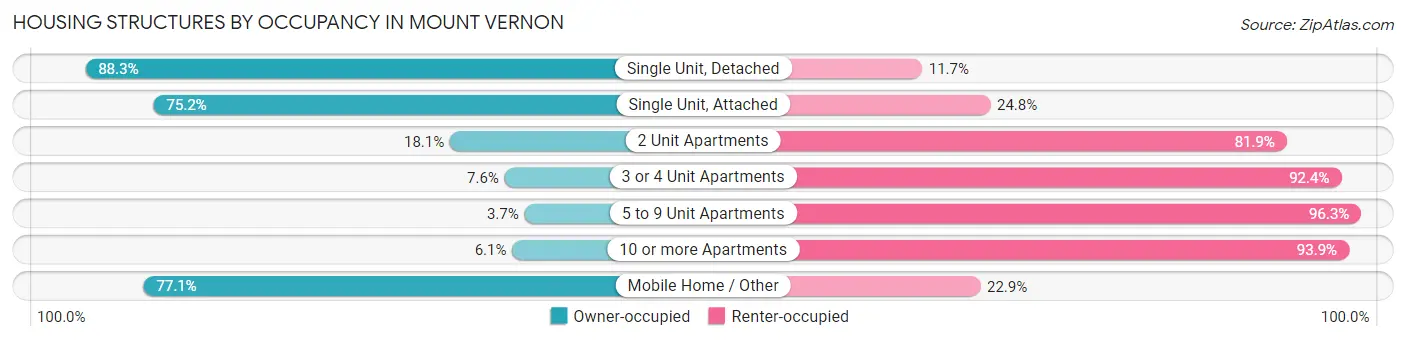
| Structure Type | Owner-occupied | Renter-occupied |
| Single Unit, Detached | 7,182 (88.3%) | 950 (11.7%) |
| Single Unit, Attached | 297 (75.2%) | 98 (24.8%) |
| 2 Unit Apartments | 83 (18.1%) | 376 (81.9%) |
| 3 or 4 Unit Apartments | 64 (7.6%) | 782 (92.4%) |
| 5 to 9 Unit Apartments | 23 (3.7%) | 592 (96.3%) |
| 10 or more Apartments | 114 (6.1%) | 1,756 (93.9%) |
| Mobile Home / Other | 482 (77.1%) | 143 (22.9%) |
| Total | 8,245 (63.7%) | 4,697 (36.3%) |
Housing Structures by Number of Rooms in Mount Vernon
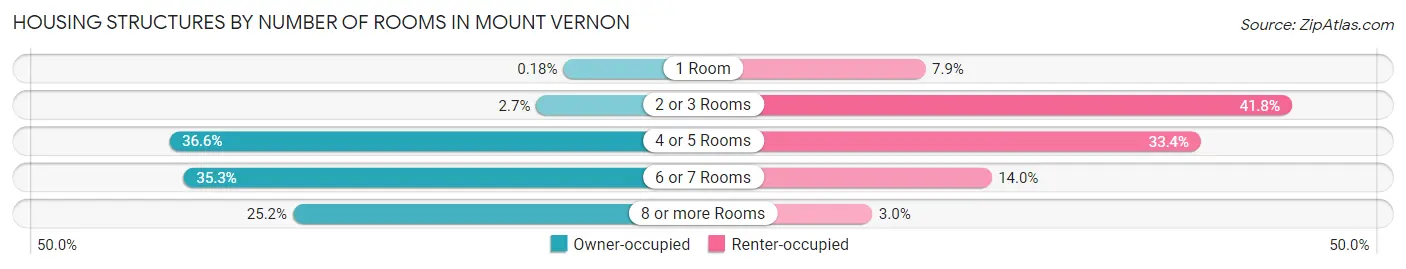
| Number of Rooms | Owner-occupied | Renter-occupied |
| 1 Room | 15 (0.2%) | 370 (7.9%) |
| 2 or 3 Rooms | 221 (2.7%) | 1,963 (41.8%) |
| 4 or 5 Rooms | 3,021 (36.6%) | 1,568 (33.4%) |
| 6 or 7 Rooms | 2,911 (35.3%) | 657 (14.0%) |
| 8 or more Rooms | 2,077 (25.2%) | 139 (3.0%) |
| Total | 8,245 (100.0%) | 4,697 (100.0%) |
Housing Structure by Heating Type in Mount Vernon
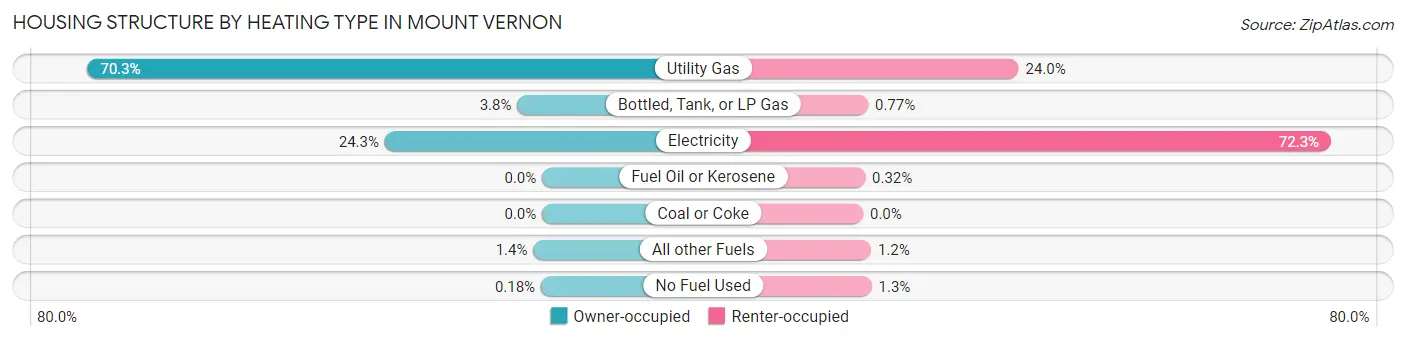
| Heating Type | Owner-occupied | Renter-occupied |
| Utility Gas | 5,796 (70.3%) | 1,129 (24.0%) |
| Bottled, Tank, or LP Gas | 317 (3.8%) | 36 (0.8%) |
| Electricity | 2,005 (24.3%) | 3,397 (72.3%) |
| Fuel Oil or Kerosene | 0 (0.0%) | 15 (0.3%) |
| Coal or Coke | 0 (0.0%) | 0 (0.0%) |
| All other Fuels | 112 (1.4%) | 58 (1.2%) |
| No Fuel Used | 15 (0.2%) | 62 (1.3%) |
| Total | 8,245 (100.0%) | 4,697 (100.0%) |
Household Vehicle Usage in Mount Vernon
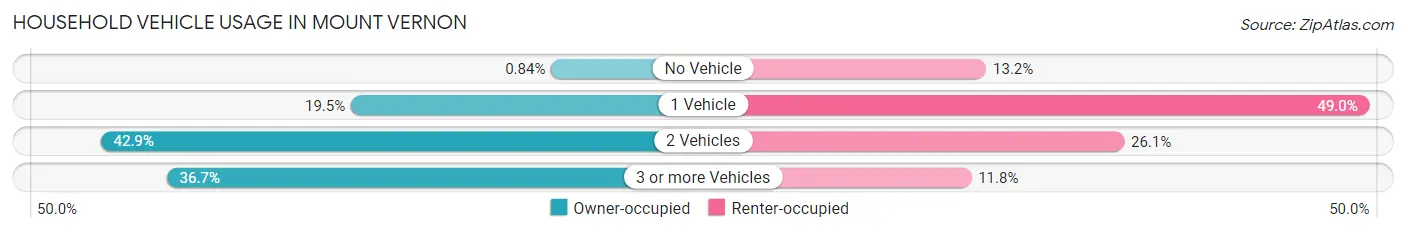
| Vehicles per Household | Owner-occupied | Renter-occupied |
| No Vehicle | 69 (0.8%) | 619 (13.2%) |
| 1 Vehicle | 1,610 (19.5%) | 2,300 (49.0%) |
| 2 Vehicles | 3,537 (42.9%) | 1,224 (26.1%) |
| 3 or more Vehicles | 3,029 (36.7%) | 554 (11.8%) |
| Total | 8,245 (100.0%) | 4,697 (100.0%) |
Real Estate & Mortgages in Mount Vernon
Real Estate and Mortgage Overview in Mount Vernon
| Characteristic | Without Mortgage | With Mortgage |
| Housing Units | 2,777 | 5,468 |
| Median Property Value | $357,700 | $393,900 |
| Median Household Income | $70,584 | $1,250 |
| Monthly Housing Costs | $651 | $537 |
| Real Estate Taxes | $3,590 | $175 |
Property Value by Mortgage Status in Mount Vernon
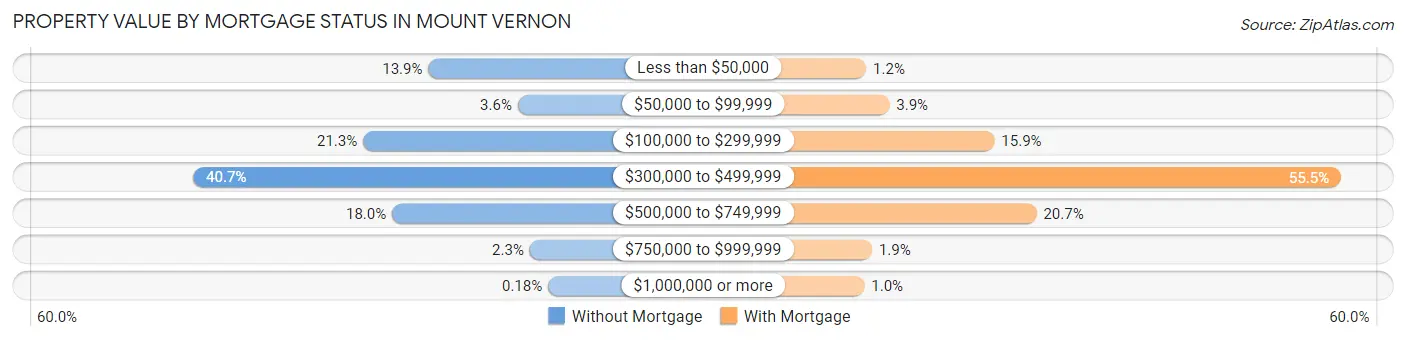
| Property Value | Without Mortgage | With Mortgage |
| Less than $50,000 | 385 (13.9%) | 66 (1.2%) |
| $50,000 to $99,999 | 101 (3.6%) | 211 (3.9%) |
| $100,000 to $299,999 | 592 (21.3%) | 868 (15.9%) |
| $300,000 to $499,999 | 1,131 (40.7%) | 3,034 (55.5%) |
| $500,000 to $749,999 | 500 (18.0%) | 1,131 (20.7%) |
| $750,000 to $999,999 | 63 (2.3%) | 103 (1.9%) |
| $1,000,000 or more | 5 (0.2%) | 55 (1.0%) |
| Total | 2,777 (100.0%) | 5,468 (100.0%) |
Household Income by Mortgage Status in Mount Vernon
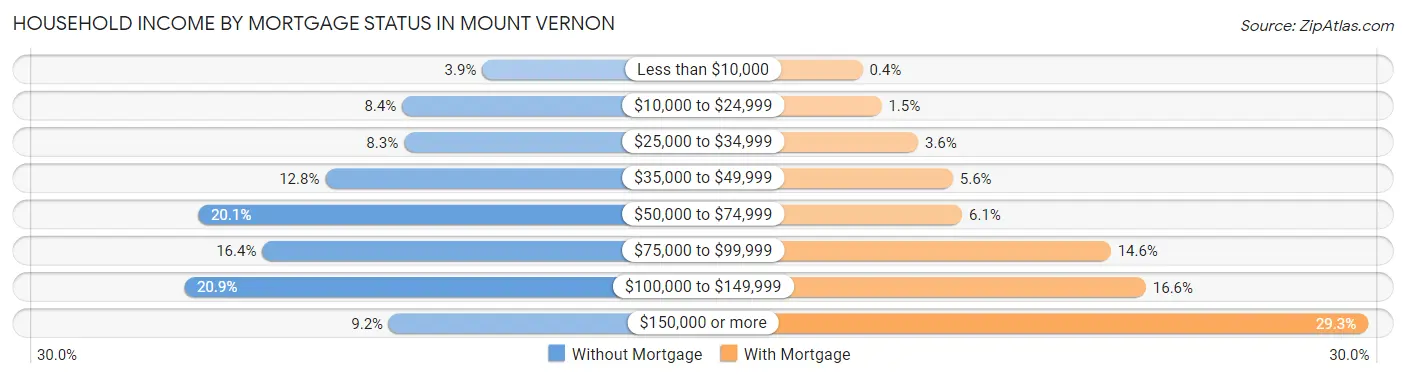
| Household Income | Without Mortgage | With Mortgage |
| Less than $10,000 | 107 (3.8%) | 22 (0.4%) |
| $10,000 to $24,999 | 234 (8.4%) | 81 (1.5%) |
| $25,000 to $34,999 | 231 (8.3%) | 195 (3.6%) |
| $35,000 to $49,999 | 356 (12.8%) | 304 (5.6%) |
| $50,000 to $74,999 | 558 (20.1%) | 333 (6.1%) |
| $75,000 to $99,999 | 456 (16.4%) | 797 (14.6%) |
| $100,000 to $149,999 | 580 (20.9%) | 907 (16.6%) |
| $150,000 or more | 255 (9.2%) | 1,601 (29.3%) |
| Total | 2,777 (100.0%) | 5,468 (100.0%) |
Property Value to Household Income Ratio in Mount Vernon
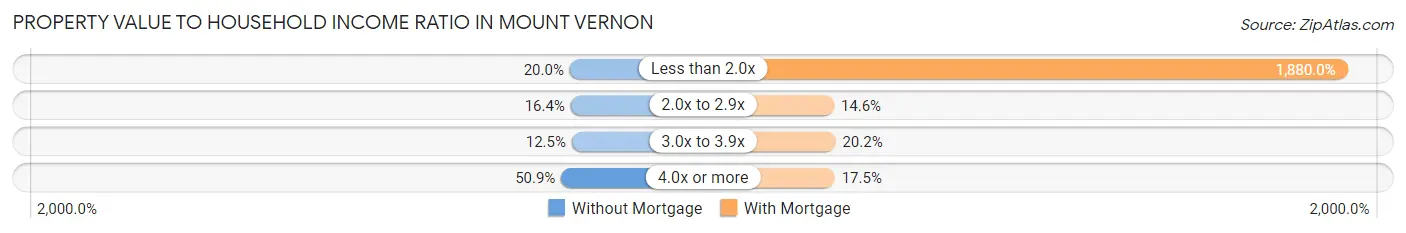
| Value-to-Income Ratio | Without Mortgage | With Mortgage |
| Less than 2.0x | 554 (20.0%) | 102,800 (1,880.0%) |
| 2.0x to 2.9x | 456 (16.4%) | 796 (14.6%) |
| 3.0x to 3.9x | 347 (12.5%) | 1,106 (20.2%) |
| 4.0x or more | 1,414 (50.9%) | 958 (17.5%) |
| Total | 2,777 (100.0%) | 5,468 (100.0%) |
Real Estate Taxes by Mortgage Status in Mount Vernon
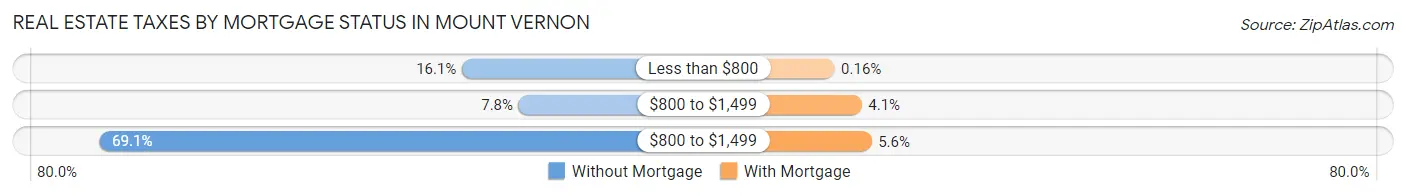
| Property Taxes | Without Mortgage | With Mortgage |
| Less than $800 | 446 (16.1%) | 9 (0.2%) |
| $800 to $1,499 | 216 (7.8%) | 226 (4.1%) |
| $800 to $1,499 | 1,919 (69.1%) | 305 (5.6%) |
| Total | 2,777 (100.0%) | 5,468 (100.0%) |
Health & Disability in Mount Vernon
Health Insurance Coverage by Age in Mount Vernon
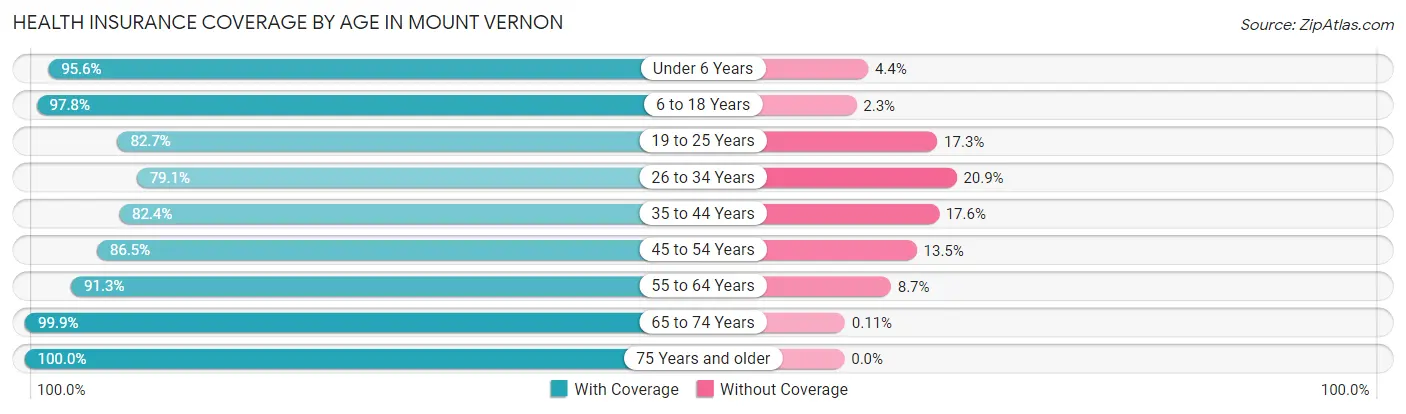
| Age Bracket | With Coverage | Without Coverage |
| Under 6 Years | 3,079 (95.6%) | 142 (4.4%) |
| 6 to 18 Years | 5,870 (97.8%) | 135 (2.2%) |
| 19 to 25 Years | 2,759 (82.7%) | 578 (17.3%) |
| 26 to 34 Years | 3,711 (79.1%) | 981 (20.9%) |
| 35 to 44 Years | 3,055 (82.4%) | 653 (17.6%) |
| 45 to 54 Years | 3,009 (86.5%) | 469 (13.5%) |
| 55 to 64 Years | 3,559 (91.3%) | 338 (8.7%) |
| 65 to 74 Years | 3,765 (99.9%) | 4 (0.1%) |
| 75 Years and older | 2,390 (100.0%) | 0 (0.0%) |
| Total | 31,197 (90.4%) | 3,300 (9.6%) |
Health Insurance Coverage by Citizenship Status in Mount Vernon
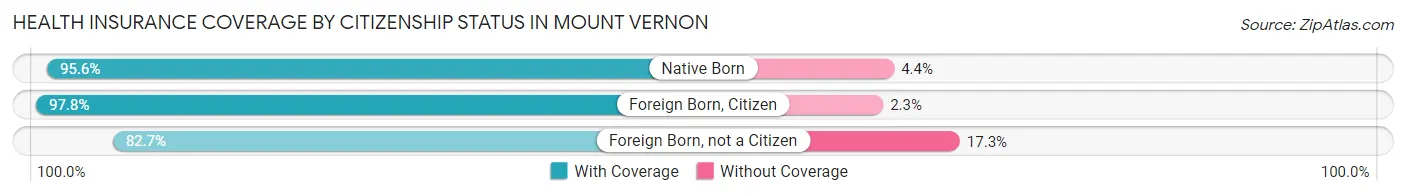
| Citizenship Status | With Coverage | Without Coverage |
| Native Born | 3,079 (95.6%) | 142 (4.4%) |
| Foreign Born, Citizen | 5,870 (97.8%) | 135 (2.2%) |
| Foreign Born, not a Citizen | 2,759 (82.7%) | 578 (17.3%) |
Health Insurance Coverage by Household Income in Mount Vernon
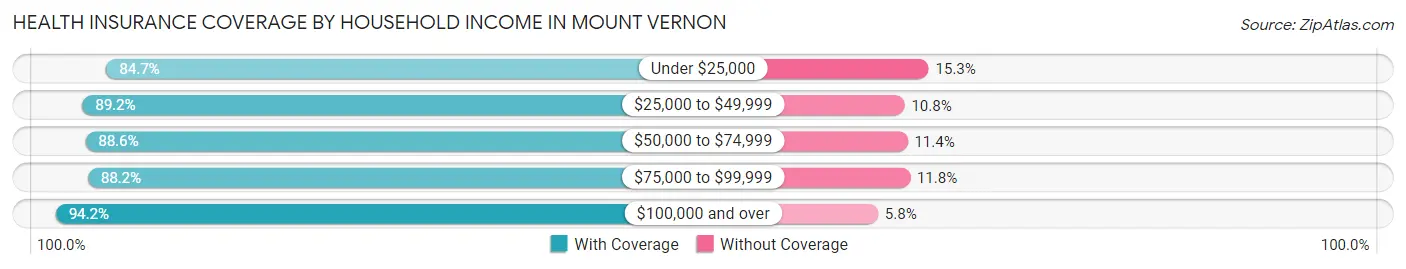
| Household Income | With Coverage | Without Coverage |
| Under $25,000 | 3,579 (84.7%) | 648 (15.3%) |
| $25,000 to $49,999 | 5,512 (89.2%) | 668 (10.8%) |
| $50,000 to $74,999 | 4,249 (88.6%) | 545 (11.4%) |
| $75,000 to $99,999 | 4,700 (88.2%) | 631 (11.8%) |
| $100,000 and over | 12,801 (94.2%) | 793 (5.8%) |
Public vs Private Health Insurance Coverage by Age in Mount Vernon
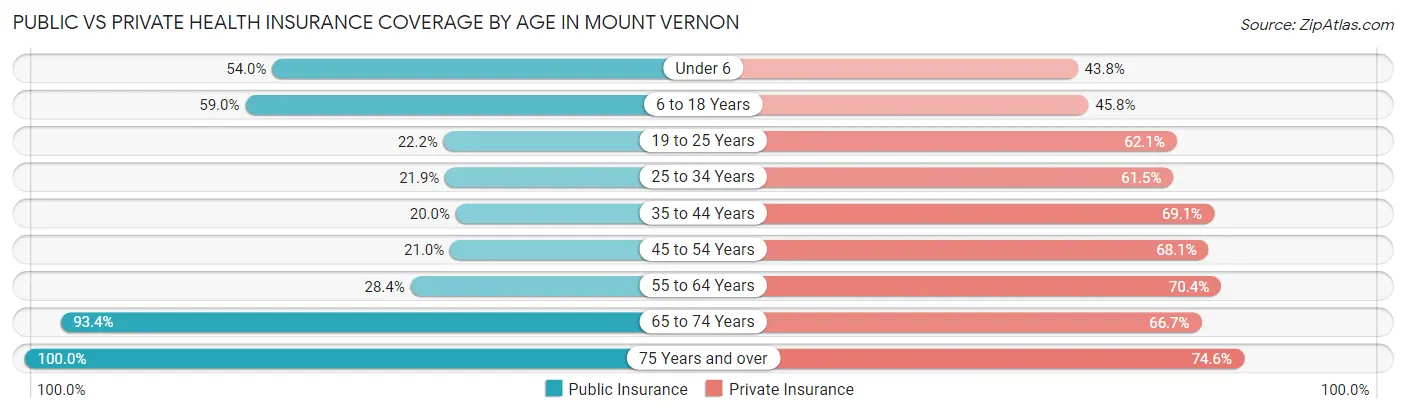
| Age Bracket | Public Insurance | Private Insurance |
| Under 6 | 1,740 (54.0%) | 1,410 (43.8%) |
| 6 to 18 Years | 3,545 (59.0%) | 2,747 (45.8%) |
| 19 to 25 Years | 741 (22.2%) | 2,073 (62.1%) |
| 25 to 34 Years | 1,029 (21.9%) | 2,887 (61.5%) |
| 35 to 44 Years | 740 (20.0%) | 2,561 (69.1%) |
| 45 to 54 Years | 731 (21.0%) | 2,367 (68.1%) |
| 55 to 64 Years | 1,105 (28.4%) | 2,743 (70.4%) |
| 65 to 74 Years | 3,520 (93.4%) | 2,515 (66.7%) |
| 75 Years and over | 2,390 (100.0%) | 1,783 (74.6%) |
| Total | 15,541 (45.1%) | 21,086 (61.1%) |
Disability Status by Sex by Age in Mount Vernon
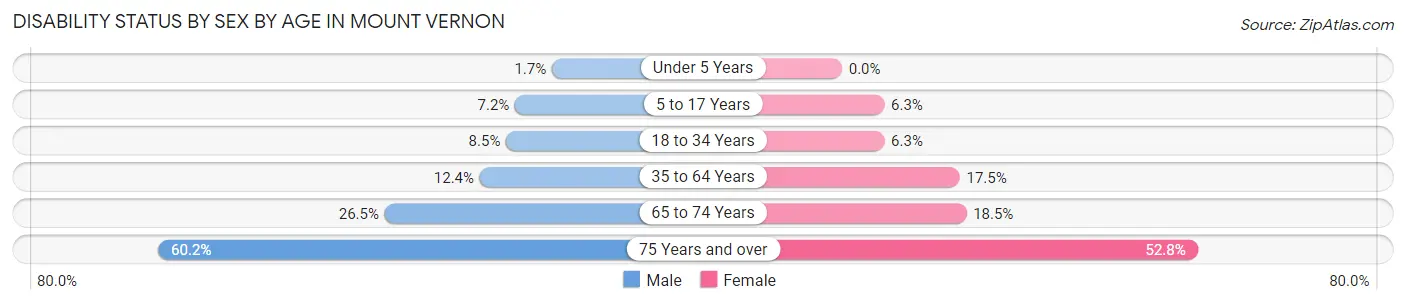
| Age Bracket | Male | Female |
| Under 5 Years | 23 (1.7%) | 0 (0.0%) |
| 5 to 17 Years | 226 (7.1%) | 204 (6.3%) |
| 18 to 34 Years | 373 (8.5%) | 248 (6.3%) |
| 35 to 64 Years | 651 (12.4%) | 1,020 (17.5%) |
| 65 to 74 Years | 451 (26.5%) | 382 (18.5%) |
| 75 Years and over | 562 (60.2%) | 769 (52.8%) |
Disability Class by Sex by Age in Mount Vernon
Disability Class: Hearing Difficulty
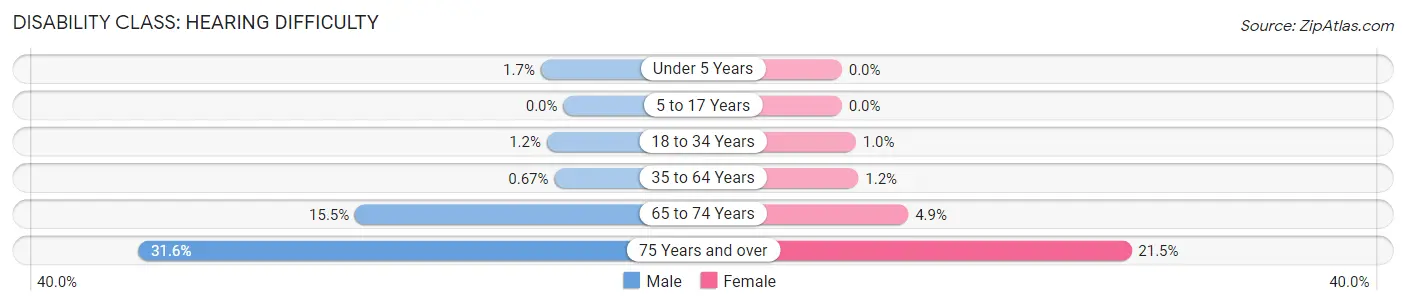
| Age Bracket | Male | Female |
| Under 5 Years | 23 (1.7%) | 0 (0.0%) |
| 5 to 17 Years | 0 (0.0%) | 0 (0.0%) |
| 18 to 34 Years | 54 (1.2%) | 41 (1.0%) |
| 35 to 64 Years | 35 (0.7%) | 72 (1.2%) |
| 65 to 74 Years | 263 (15.5%) | 102 (4.9%) |
| 75 Years and over | 295 (31.6%) | 313 (21.5%) |
Disability Class: Vision Difficulty
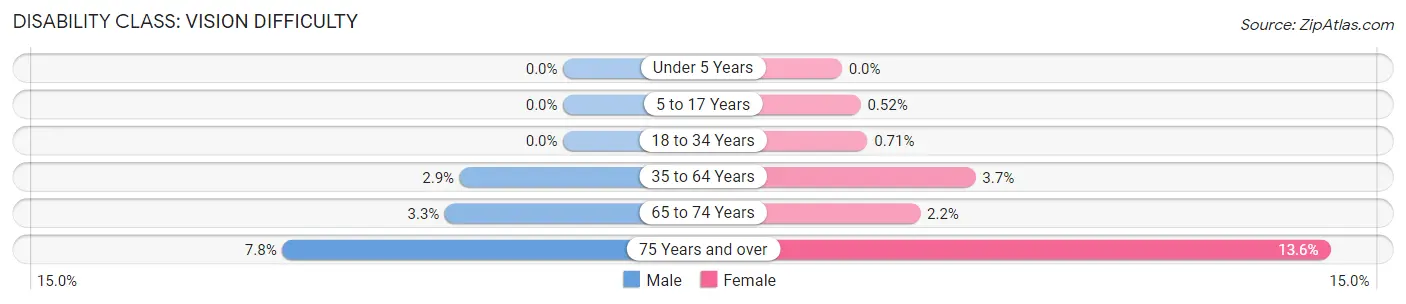
| Age Bracket | Male | Female |
| Under 5 Years | 0 (0.0%) | 0 (0.0%) |
| 5 to 17 Years | 0 (0.0%) | 17 (0.5%) |
| 18 to 34 Years | 0 (0.0%) | 28 (0.7%) |
| 35 to 64 Years | 151 (2.9%) | 217 (3.7%) |
| 65 to 74 Years | 56 (3.3%) | 45 (2.2%) |
| 75 Years and over | 73 (7.8%) | 198 (13.6%) |
Disability Class: Cognitive Difficulty

| Age Bracket | Male | Female |
| 5 to 17 Years | 193 (6.1%) | 129 (4.0%) |
| 18 to 34 Years | 218 (5.0%) | 119 (3.0%) |
| 35 to 64 Years | 326 (6.2%) | 340 (5.8%) |
| 65 to 74 Years | 44 (2.6%) | 107 (5.2%) |
| 75 Years and over | 152 (16.3%) | 221 (15.2%) |
Disability Class: Ambulatory Difficulty
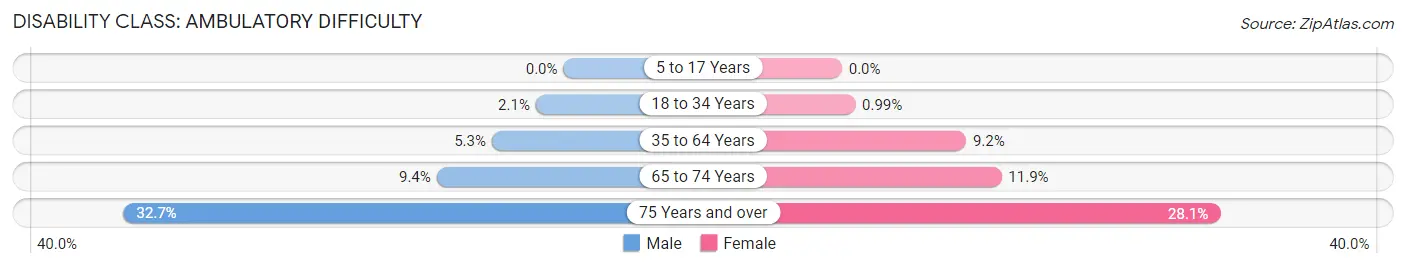
| Age Bracket | Male | Female |
| 5 to 17 Years | 0 (0.0%) | 0 (0.0%) |
| 18 to 34 Years | 90 (2.1%) | 39 (1.0%) |
| 35 to 64 Years | 279 (5.3%) | 538 (9.2%) |
| 65 to 74 Years | 160 (9.4%) | 245 (11.8%) |
| 75 Years and over | 305 (32.7%) | 409 (28.1%) |
Disability Class: Self-Care Difficulty
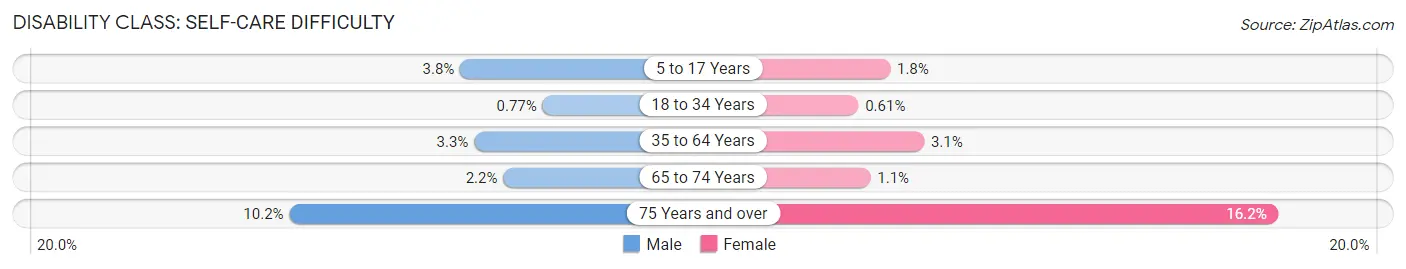
| Age Bracket | Male | Female |
| 5 to 17 Years | 121 (3.8%) | 58 (1.8%) |
| 18 to 34 Years | 34 (0.8%) | 24 (0.6%) |
| 35 to 64 Years | 174 (3.3%) | 178 (3.0%) |
| 65 to 74 Years | 38 (2.2%) | 22 (1.1%) |
| 75 Years and over | 95 (10.2%) | 236 (16.2%) |
Technology Access in Mount Vernon
Computing Device Access in Mount Vernon
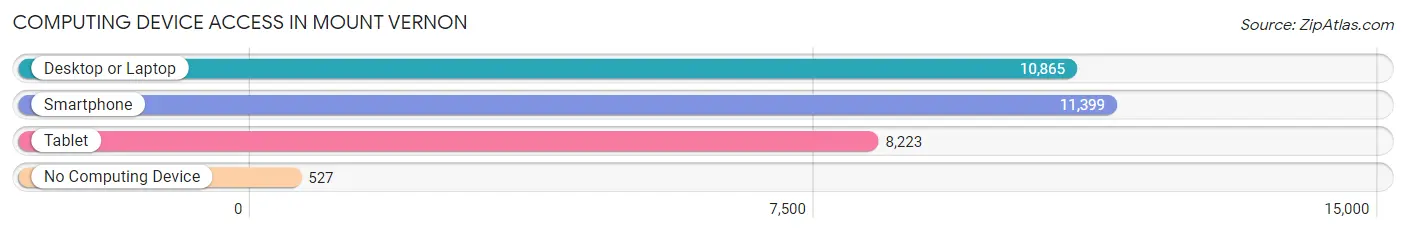
| Device Type | # Households | % Households |
| Desktop or Laptop | 10,865 | 84.0% |
| Smartphone | 11,399 | 88.1% |
| Tablet | 8,223 | 63.5% |
| No Computing Device | 527 | 4.1% |
| Total | 12,942 | 100.0% |
Internet Access in Mount Vernon
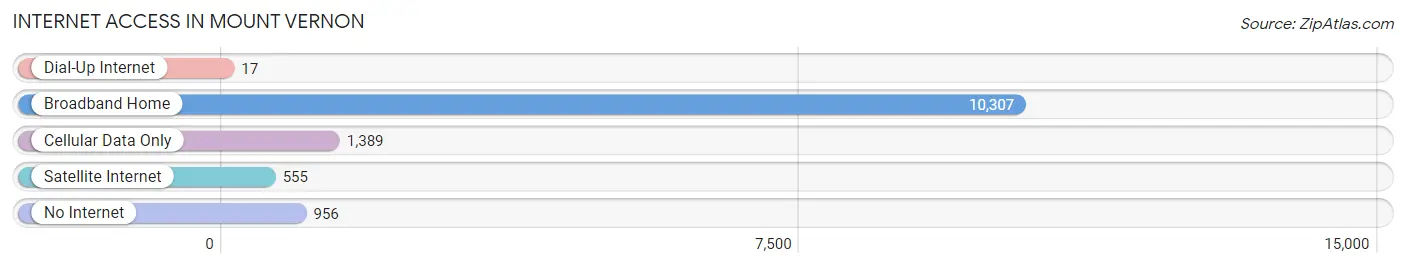
| Internet Type | # Households | % Households |
| Dial-Up Internet | 17 | 0.1% |
| Broadband Home | 10,307 | 79.6% |
| Cellular Data Only | 1,389 | 10.7% |
| Satellite Internet | 555 | 4.3% |
| No Internet | 956 | 7.4% |
| Total | 12,942 | 100.0% |
Mount Vernon Summary
Introduction
Mount Vernon is a city located in Skagit County, Washington, United States. It is the county seat of Skagit County and the largest city in the county. The city is located in the northwest corner of the state, about 50 miles north of Seattle and about 30 miles south of the Canadian border. The city is situated on the banks of the Skagit River, which flows through the city and is a major source of recreation and economic activity. The city is home to a population of over 32,000 people, making it the largest city in Skagit County and the fourth largest city in Washington State.
History
The area that is now Mount Vernon was first settled by Native Americans of the Samish and Swinomish tribes. The first European settlers arrived in the area in the late 1800s, and the city was officially incorporated in 1891. The city was named after George Washington's home in Virginia, and the city's motto is "The City of Presidents."
The city grew rapidly in the early 20th century, and by the 1950s, it had become a major agricultural center. The city was also home to a large lumber industry, and the city's economy was largely based on these two industries. In the late 20th century, the city began to diversify its economy, and today, it is home to a variety of industries, including manufacturing, retail, and tourism.
Geography
Mount Vernon is located in the northwest corner of Washington State, about 50 miles north of Seattle and about 30 miles south of the Canadian border. The city is situated on the banks of the Skagit River, which flows through the city and is a major source of recreation and economic activity. The city is surrounded by the Cascade Mountains to the east and the Olympic Mountains to the west. The city is located in a temperate rainforest climate, with mild temperatures and abundant rainfall throughout the year.
Economy
Mount Vernon's economy is largely based on agriculture, manufacturing, retail, and tourism. The city is home to a variety of agricultural businesses, including dairy farms, fruit orchards, and vegetable farms. The city is also home to a number of manufacturing businesses, including food processing, wood products, and metal fabrication. The city is also home to a variety of retail businesses, including restaurants, shops, and galleries. Tourism is also an important part of the city's economy, with visitors coming to the city to enjoy its natural beauty and outdoor recreation opportunities.
Demographics
As of the 2010 census, the population of Mount Vernon was 32,339. The city has a population that is largely white (86.3%), with smaller percentages of Hispanic (7.2%), Asian (3.2%), and African American (1.7%) residents. The median household income in the city is $50,845, and the median age is 38.7 years.
Conclusion
Mount Vernon is a city located in Skagit County, Washington, United States. It is the county seat of Skagit County and the largest city in the county. The city is situated on the banks of the Skagit River, which flows through the city and is a major source of recreation and economic activity. The city is home to a population of over 32,000 people, making it the largest city in Skagit County and the fourth largest city in Washington State. The city's economy is largely based on agriculture, manufacturing, retail, and tourism, and the city is home to a variety of businesses and attractions. The city has a population that is largely white, with smaller percentages of Hispanic, Asian, and African American residents.
Common Questions
What is Per Capita Income in Mount Vernon?
Per Capita income in Mount Vernon is $33,522.
What is the Median Family Income in Mount Vernon?
Median Family Income in Mount Vernon is $87,076.
What is the Median Household income in Mount Vernon?
Median Household Income in Mount Vernon is $69,227.
What is Income or Wage Gap in Mount Vernon?
Income or Wage Gap in Mount Vernon is 20.4%.
Women in Mount Vernon earn 79.6 cents for every dollar earned by a man.
What is Family Income Deficit in Mount Vernon?
Family Income Deficit in Mount Vernon is $12,379.
Families that are below poverty line in Mount Vernon earn $12,379 less on average than the poverty threshold level.
What is Inequality or Gini Index in Mount Vernon?
Inequality or Gini Index in Mount Vernon is 0.44.
What is the Total Population of Mount Vernon?
Total Population of Mount Vernon is 35,120.
What is the Total Male Population of Mount Vernon?
Total Male Population of Mount Vernon is 17,266.
What is the Total Female Population of Mount Vernon?
Total Female Population of Mount Vernon is 17,854.
What is the Ratio of Males per 100 Females in Mount Vernon?
There are 96.71 Males per 100 Females in Mount Vernon.
What is the Ratio of Females per 100 Males in Mount Vernon?
There are 103.41 Females per 100 Males in Mount Vernon.
What is the Median Population Age in Mount Vernon?
Median Population Age in Mount Vernon is 35.0 Years.
What is the Average Family Size in Mount Vernon
Average Family Size in Mount Vernon is 3.2 People.
What is the Average Household Size in Mount Vernon
Average Household Size in Mount Vernon is 2.6 People.
How Large is the Labor Force in Mount Vernon?
There are 16,782 People in the Labor Forcein in Mount Vernon.
What is the Percentage of People in the Labor Force in Mount Vernon?
61.6% of People are in the Labor Force in Mount Vernon.
What is the Unemployment Rate in Mount Vernon?
Unemployment Rate in Mount Vernon is 6.3%.