Cities with the Lowest Unemployment Rate Amomg Seniors Over the Age of 65 in Florida
RELATED REPORTS & OPTIONS
Lowest Unemployment | Senior > 65
Florida
Compare Cities
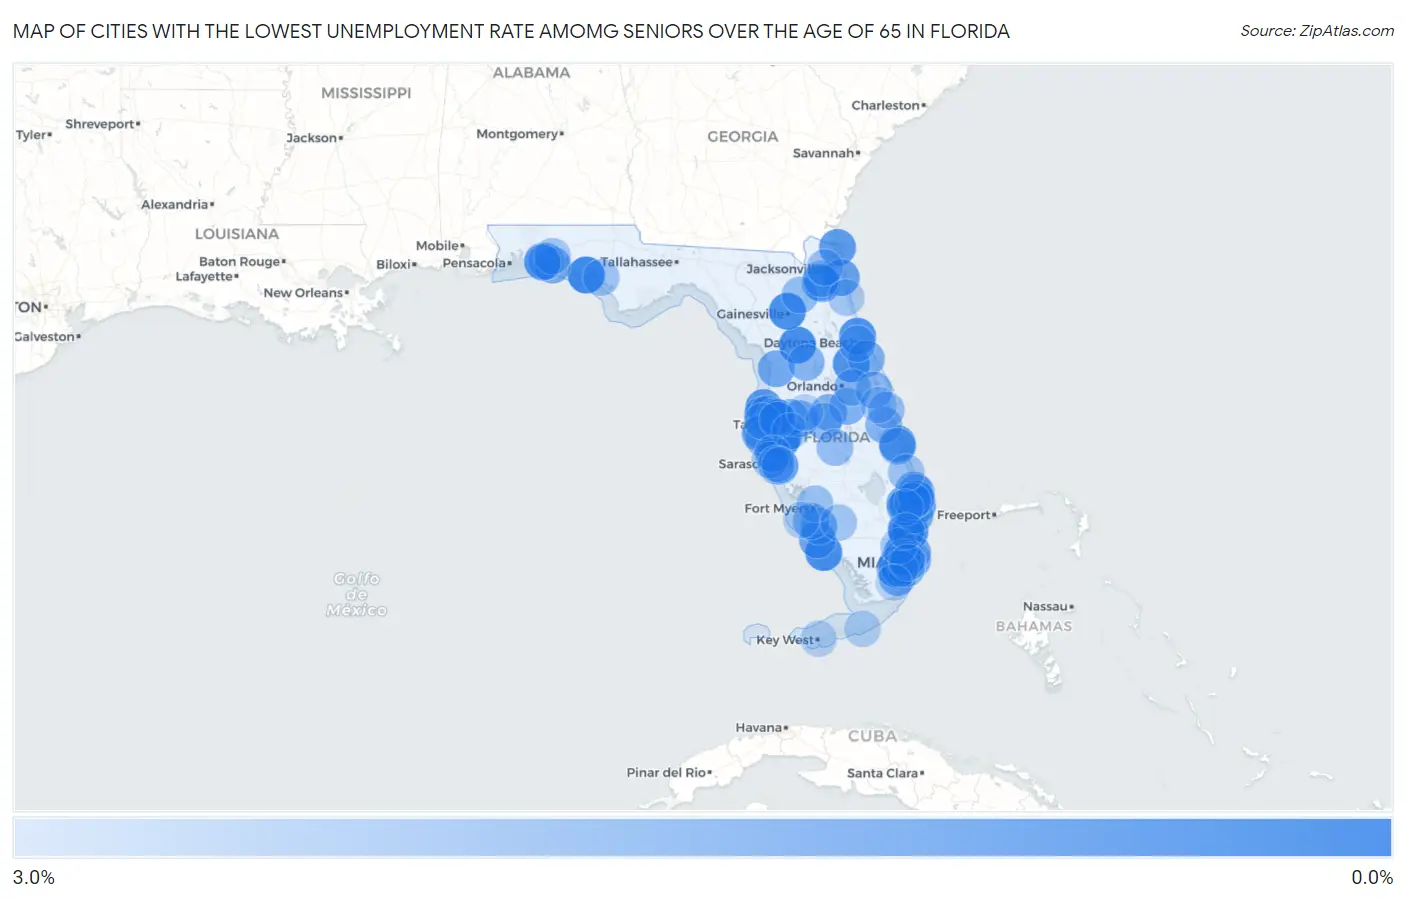
Map of Cities with the Lowest Unemployment Rate Amomg Seniors Over the Age of 65 in Florida
3.0%
0.0%
Cities with the Lowest Unemployment Rate Amomg Seniors Over the Age of 65 in Florida
| City | Senior Unemployment | vs State | vs National | |
| 1. | Ruskin | 0.10% | 4.1%(-4.00)#1 | 3.9%(-3.80)#4 |
| 2. | North Lauderdale | 0.30% | 4.1%(-3.80)#2 | 3.9%(-3.60)#15 |
| 3. | Panama City Beach | 0.30% | 4.1%(-3.80)#3 | 3.9%(-3.60)#20 |
| 4. | Ocala | 0.40% | 4.1%(-3.70)#4 | 3.9%(-3.50)#26 |
| 5. | Gainesville | 0.50% | 4.1%(-3.60)#5 | 3.9%(-3.40)#45 |
| 6. | Westchester | 0.50% | 4.1%(-3.60)#6 | 3.9%(-3.40)#50 |
| 7. | Marco Island | 0.50% | 4.1%(-3.60)#7 | 3.9%(-3.40)#68 |
| 8. | Deltona | 0.60% | 4.1%(-3.50)#8 | 3.9%(-3.30)#74 |
| 9. | Country Club | 0.60% | 4.1%(-3.50)#9 | 3.9%(-3.30)#78 |
| 10. | Ormond Beach | 0.60% | 4.1%(-3.50)#10 | 3.9%(-3.30)#81 |
| 11. | Tamiami | 0.70% | 4.1%(-3.40)#11 | 3.9%(-3.20)#110 |
| 12. | Beacon Square | 0.80% | 4.1%(-3.30)#12 | 3.9%(-3.10)#151 |
| 13. | Parkland | 0.90% | 4.1%(-3.20)#13 | 3.9%(-3.00)#163 |
| 14. | Bradfordville | 0.90% | 4.1%(-3.20)#14 | 3.9%(-3.00)#176 |
| 15. | Fernandina Beach | 0.90% | 4.1%(-3.20)#15 | 3.9%(-3.00)#182 |
| 16. | Coconut Creek | 1.0% | 4.1%(-3.10)#16 | 3.9%(-2.90)#198 |
| 17. | Vero Beach | 1.0% | 4.1%(-3.10)#17 | 3.9%(-2.90)#218 |
| 18. | Palm Beach | 1.0% | 4.1%(-3.10)#18 | 3.9%(-2.90)#226 |
| 19. | West Samoset | 1.0% | 4.1%(-3.10)#19 | 3.9%(-2.90)#227 |
| 20. | Loxahatchee Groves | 1.0% | 4.1%(-3.10)#20 | 3.9%(-2.90)#232 |
| 21. | Town N Country | 1.1% | 4.1%(-3.00)#21 | 3.9%(-2.80)#239 |
| 22. | Royal Palm Beach | 1.1% | 4.1%(-3.00)#22 | 3.9%(-2.80)#249 |
| 23. | Wright | 1.1% | 4.1%(-3.00)#23 | 3.9%(-2.80)#254 |
| 24. | Palm Valley | 1.1% | 4.1%(-3.00)#24 | 3.9%(-2.80)#263 |
| 25. | Palm Harbor | 1.3% | 4.1%(-2.80)#25 | 3.9%(-2.60)#335 |
| 26. | The Crossings | 1.3% | 4.1%(-2.80)#26 | 3.9%(-2.60)#359 |
| 27. | Naples | 1.3% | 4.1%(-2.80)#27 | 3.9%(-2.60)#363 |
| 28. | Fleming Island | 1.4% | 4.1%(-2.70)#28 | 3.9%(-2.50)#397 |
| 29. | Homosassa Springs | 1.4% | 4.1%(-2.70)#29 | 3.9%(-2.50)#412 |
| 30. | Lake Park | 1.4% | 4.1%(-2.70)#30 | 3.9%(-2.50)#424 |
| 31. | Miami Beach | 1.5% | 4.1%(-2.60)#31 | 3.9%(-2.40)#440 |
| 32. | Princeton | 1.5% | 4.1%(-2.60)#32 | 3.9%(-2.40)#446 |
| 33. | Apollo Beach | 1.5% | 4.1%(-2.60)#33 | 3.9%(-2.40)#460 |
| 34. | Sunny Isles Beach | 1.5% | 4.1%(-2.60)#34 | 3.9%(-2.40)#465 |
| 35. | Destin | 1.5% | 4.1%(-2.60)#35 | 3.9%(-2.40)#470 |
| 36. | Boynton Beach | 1.6% | 4.1%(-2.50)#36 | 3.9%(-2.30)#488 |
| 37. | Jupiter | 1.6% | 4.1%(-2.50)#37 | 3.9%(-2.30)#491 |
| 38. | Bonita Springs | 1.6% | 4.1%(-2.50)#38 | 3.9%(-2.30)#494 |
| 39. | West Little River | 1.6% | 4.1%(-2.50)#39 | 3.9%(-2.30)#499 |
| 40. | Haines City | 1.6% | 4.1%(-2.50)#40 | 3.9%(-2.30)#503 |
| 41. | Edgewater | 1.6% | 4.1%(-2.50)#41 | 3.9%(-2.30)#509 |
| 42. | Seminole | 1.6% | 4.1%(-2.50)#42 | 3.9%(-2.30)#514 |
| 43. | St Cloud | 1.7% | 4.1%(-2.40)#43 | 3.9%(-2.20)#554 |
| 44. | The Hammocks | 1.7% | 4.1%(-2.40)#44 | 3.9%(-2.20)#555 |
| 45. | Plant City | 1.7% | 4.1%(-2.40)#45 | 3.9%(-2.20)#558 |
| 46. | Thonotosassa | 1.7% | 4.1%(-2.40)#46 | 3.9%(-2.20)#580 |
| 47. | Bee Ridge | 1.7% | 4.1%(-2.40)#47 | 3.9%(-2.20)#587 |
| 48. | Palm Bay | 1.8% | 4.1%(-2.30)#48 | 3.9%(-2.10)#610 |
| 49. | Alafaya | 1.8% | 4.1%(-2.30)#49 | 3.9%(-2.10)#612 |
| 50. | The Villages | 1.8% | 4.1%(-2.30)#50 | 3.9%(-2.10)#613 |
| 51. | East Lake | 1.8% | 4.1%(-2.30)#51 | 3.9%(-2.10)#627 |
| 52. | Lakeside | 1.8% | 4.1%(-2.30)#52 | 3.9%(-2.10)#630 |
| 53. | Citrus Park | 1.8% | 4.1%(-2.30)#53 | 3.9%(-2.10)#632 |
| 54. | Port St John | 1.8% | 4.1%(-2.30)#54 | 3.9%(-2.10)#633 |
| 55. | St Pete Beach | 1.9% | 4.1%(-2.20)#55 | 3.9%(-2.00)#712 |
| 56. | Fort Myers Beach | 1.9% | 4.1%(-2.20)#56 | 3.9%(-2.00)#719 |
| 57. | Juno Beach | 1.9% | 4.1%(-2.20)#57 | 3.9%(-2.00)#721 |
| 58. | Coral Gables | 2.0% | 4.1%(-2.10)#58 | 3.9%(-1.90)#739 |
| 59. | Vero Beach South | 2.0% | 4.1%(-2.10)#59 | 3.9%(-1.90)#749 |
| 60. | Cypress Gardens | 2.0% | 4.1%(-2.10)#60 | 3.9%(-1.90)#780 |
| 61. | Redington Beach | 2.0% | 4.1%(-2.10)#61 | 3.9%(-1.90)#794 |
| 62. | Hialeah | 2.1% | 4.1%(-2.00)#62 | 3.9%(-1.80)#795 |
| 63. | Riviera Beach | 2.1% | 4.1%(-2.00)#63 | 3.9%(-1.80)#805 |
| 64. | Carrollwood | 2.1% | 4.1%(-2.00)#64 | 3.9%(-1.80)#806 |
| 65. | Satellite Beach | 2.1% | 4.1%(-2.00)#65 | 3.9%(-1.80)#834 |
| 66. | Avon Park | 2.1% | 4.1%(-2.00)#66 | 3.9%(-1.80)#835 |
| 67. | Lake Lorraine | 2.1% | 4.1%(-2.00)#67 | 3.9%(-1.80)#840 |
| 68. | Starke | 2.1% | 4.1%(-2.00)#68 | 3.9%(-1.80)#844 |
| 69. | Clearwater | 2.2% | 4.1%(-1.90)#69 | 3.9%(-1.70)#864 |
| 70. | North Fort Myers | 2.2% | 4.1%(-1.90)#70 | 3.9%(-1.70)#877 |
| 71. | Bellair Meadowbrook Terrace | 2.2% | 4.1%(-1.90)#71 | 3.9%(-1.70)#899 |
| 72. | Jacksonville | 2.3% | 4.1%(-1.80)#72 | 3.9%(-1.60)#929 |
| 73. | West Palm Beach | 2.3% | 4.1%(-1.80)#73 | 3.9%(-1.60)#933 |
| 74. | Panama City | 2.3% | 4.1%(-1.80)#74 | 3.9%(-1.60)#949 |
| 75. | Brownsville | 2.3% | 4.1%(-1.80)#75 | 3.9%(-1.60)#961 |
| 76. | Stuart | 2.3% | 4.1%(-1.80)#76 | 3.9%(-1.60)#963 |
| 77. | South Sarasota | 2.3% | 4.1%(-1.80)#77 | 3.9%(-1.60)#987 |
| 78. | Kendall | 2.4% | 4.1%(-1.70)#78 | 3.9%(-1.50)#1,006 |
| 79. | Daytona Beach | 2.4% | 4.1%(-1.70)#79 | 3.9%(-1.50)#1,011 |
| 80. | Wellington | 2.4% | 4.1%(-1.70)#80 | 3.9%(-1.50)#1,014 |
| 81. | Immokalee | 2.4% | 4.1%(-1.70)#81 | 3.9%(-1.50)#1,029 |
| 82. | Niceville | 2.4% | 4.1%(-1.70)#82 | 3.9%(-1.50)#1,046 |
| 83. | Longboat Key | 2.4% | 4.1%(-1.70)#83 | 3.9%(-1.50)#1,067 |
| 84. | Egypt Lake Leto | 2.5% | 4.1%(-1.60)#84 | 3.9%(-1.40)#1,104 |
| 85. | Fort Walton Beach | 2.5% | 4.1%(-1.60)#85 | 3.9%(-1.40)#1,115 |
| 86. | St Augustine | 2.5% | 4.1%(-1.60)#86 | 3.9%(-1.40)#1,121 |
| 87. | Southwest Ranches | 2.5% | 4.1%(-1.60)#87 | 3.9%(-1.40)#1,133 |
| 88. | Coral Springs | 2.6% | 4.1%(-1.50)#88 | 3.9%(-1.30)#1,158 |
| 89. | Marathon | 2.6% | 4.1%(-1.50)#89 | 3.9%(-1.30)#1,197 |
| 90. | Gulf Gate | 2.6% | 4.1%(-1.50)#90 | 3.9%(-1.30)#1,203 |
| 91. | Miami | 2.7% | 4.1%(-1.40)#91 | 3.9%(-1.20)#1,218 |
| 92. | Riverview | 2.7% | 4.1%(-1.40)#92 | 3.9%(-1.20)#1,223 |
| 93. | Bradenton | 2.7% | 4.1%(-1.40)#93 | 3.9%(-1.20)#1,230 |
| 94. | Sarasota | 2.7% | 4.1%(-1.40)#94 | 3.9%(-1.20)#1,231 |
| 95. | Key West | 2.7% | 4.1%(-1.40)#95 | 3.9%(-1.20)#1,248 |
| 96. | Viera West | 2.7% | 4.1%(-1.40)#96 | 3.9%(-1.20)#1,258 |
| 97. | Sarasota Springs | 2.7% | 4.1%(-1.40)#97 | 3.9%(-1.20)#1,267 |
| 98. | Sanibel | 2.7% | 4.1%(-1.40)#98 | 3.9%(-1.20)#1,279 |
| 99. | Kathleen | 2.7% | 4.1%(-1.40)#99 | 3.9%(-1.20)#1,281 |
| 100. | Homestead | 2.8% | 4.1%(-1.30)#100 | 3.9%(-1.10)#1,304 |
Common Questions
What are the Top 10 Cities with the Lowest Unemployment Rate Amomg Seniors Over the Age of 65 in Florida?
Top 10 Cities with the Lowest Unemployment Rate Amomg Seniors Over the Age of 65 in Florida are:
#1
0.10%
#2
0.30%
#3
0.30%
#4
0.40%
#5
0.50%
#6
0.50%
#7
0.50%
#8
0.60%
#9
0.60%
#10
0.60%
What city has the Lowest Unemployment Rate Amomg Seniors Over the Age of 65 in Florida?
Ruskin has the Lowest Unemployment Rate Amomg Seniors Over the Age of 65 in Florida with 0.10%.
What is the Unemployment Rate Amomg Seniors Over the Age of 65 in the State of Florida?
Unemployment Rate Amomg Seniors Over the Age of 65 in Florida is 4.1%.
What is the Unemployment Rate Amomg Seniors Over the Age of 65 in the United States?
Unemployment Rate Amomg Seniors Over the Age of 65 in the United States is 3.9%.