Cities with the Lowest Unemployment Rate Amomg Seniors Over the Age of 65 in Iowa
RELATED REPORTS & OPTIONS
Lowest Unemployment | Senior > 65
Iowa
Compare Cities
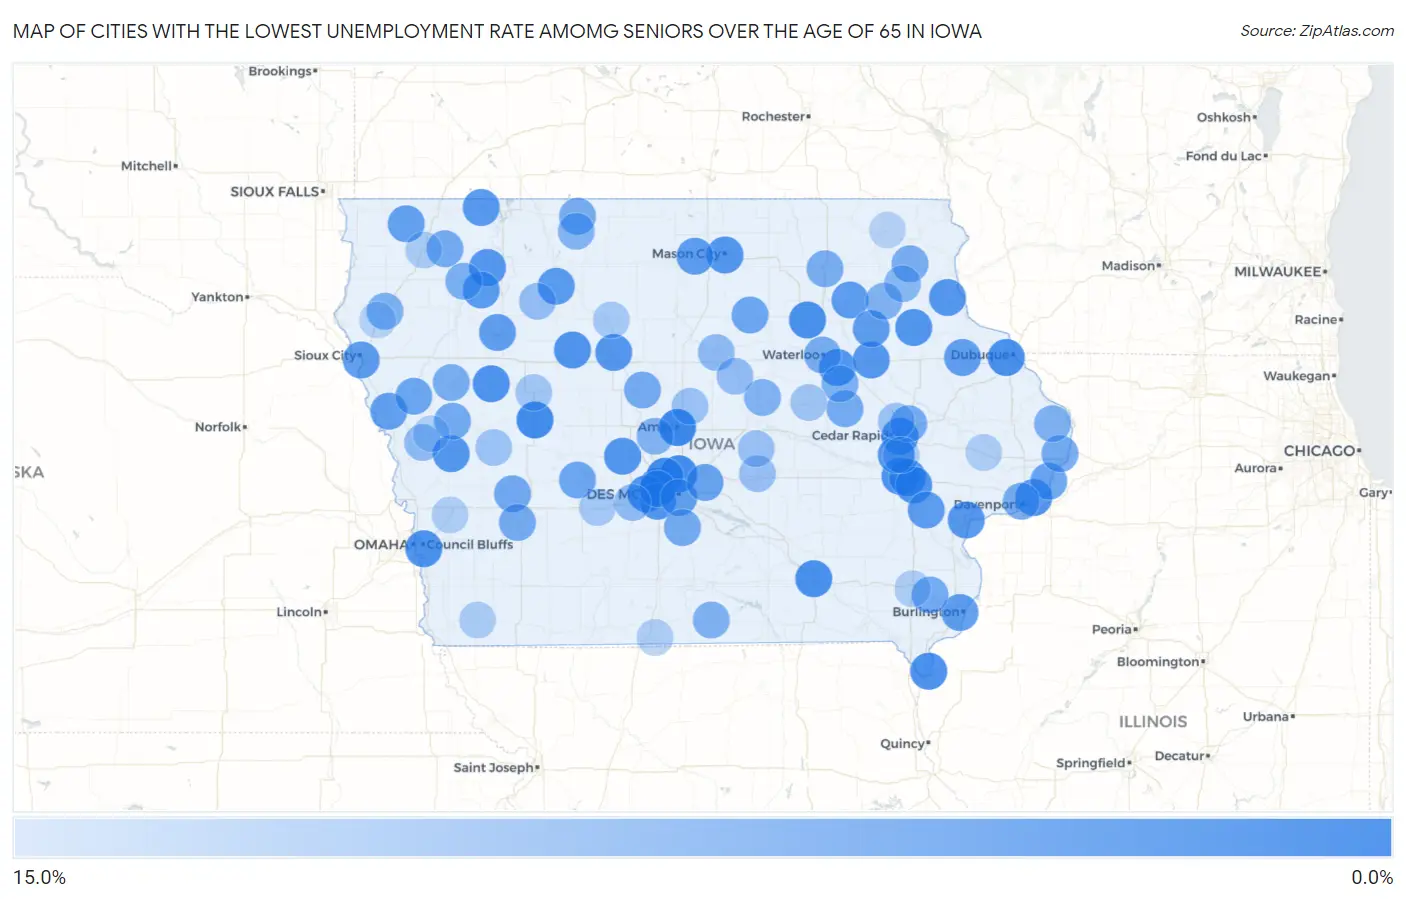
Map of Cities with the Lowest Unemployment Rate Amomg Seniors Over the Age of 65 in Iowa
15.0%
0.0%
Cities with the Lowest Unemployment Rate Amomg Seniors Over the Age of 65 in Iowa
| City | Senior Unemployment | vs State | vs National | |
| 1. | Urbandale | 0.60% | 2.6%(-2.00)#1 | 3.9%(-3.30)#80 |
| 2. | Ames | 0.90% | 2.6%(-1.70)#2 | 3.9%(-3.00)#155 |
| 3. | Ankeny | 1.4% | 2.6%(-1.20)#3 | 3.9%(-2.50)#389 |
| 4. | Carroll | 1.4% | 2.6%(-1.20)#4 | 3.9%(-2.50)#421 |
| 5. | Johnston | 1.8% | 2.6%(-0.800)#5 | 3.9%(-2.10)#635 |
| 6. | Dubuque | 1.9% | 2.6%(-0.700)#6 | 3.9%(-2.00)#675 |
| 7. | Keokuk | 1.9% | 2.6%(-0.700)#7 | 3.9%(-2.00)#707 |
| 8. | Ottumwa | 2.0% | 2.6%(-0.600)#8 | 3.9%(-1.90)#754 |
| 9. | Waverly | 2.0% | 2.6%(-0.600)#9 | 3.9%(-1.90)#776 |
| 10. | Council Bluffs | 2.2% | 2.6%(-0.400)#10 | 3.9%(-1.70)#869 |
| 11. | Waukee | 2.2% | 2.6%(-0.400)#11 | 3.9%(-1.70)#888 |
| 12. | Tiffin | 2.2% | 2.6%(-0.400)#12 | 3.9%(-1.70)#918 |
| 13. | Odebolt | 2.3% | 2.6%(-0.300)#13 | 3.9%(-1.60)#995 |
| 14. | Cedar Rapids | 2.4% | 2.6%(-0.200)#14 | 3.9%(-1.50)#1,000 |
| 15. | Coralville | 2.4% | 2.6%(-0.200)#15 | 3.9%(-1.50)#1,033 |
| 16. | Bettendorf | 2.5% | 2.6%(-0.100)#16 | 3.9%(-1.40)#1,102 |
| 17. | Manson | 2.5% | 2.6%(-0.100)#17 | 3.9%(-1.40)#1,147 |
| 18. | Strawberry Point | 2.6% | 2.6%(=0.000)#18 | 3.9%(-1.30)#1,216 |
| 19. | Iowa City | 2.7% | 2.6%(+0.100)#19 | 3.9%(-1.20)#1,227 |
| 20. | Mason City | 2.7% | 2.6%(+0.100)#20 | 3.9%(-1.20)#1,247 |
| 21. | Perry | 2.7% | 2.6%(+0.100)#21 | 3.9%(-1.20)#1,274 |
| 22. | Dunlap | 2.8% | 2.6%(+0.200)#22 | 3.9%(-1.10)#1,364 |
| 23. | Swisher | 2.8% | 2.6%(+0.200)#23 | 3.9%(-1.10)#1,367 |
| 24. | Gilbertville | 2.8% | 2.6%(+0.200)#24 | 3.9%(-1.10)#1,370 |
| 25. | West Des Moines | 2.9% | 2.6%(+0.300)#25 | 3.9%(-1.00)#1,384 |
| 26. | Fort Dodge | 2.9% | 2.6%(+0.300)#26 | 3.9%(-1.00)#1,405 |
| 27. | Royal | 2.9% | 2.6%(+0.300)#27 | 3.9%(-1.00)#1,451 |
| 28. | Muscatine | 3.0% | 2.6%(+0.400)#28 | 3.9%(-0.900)#1,478 |
| 29. | Independence | 3.0% | 2.6%(+0.400)#29 | 3.9%(-0.900)#1,511 |
| 30. | Garnavillo | 3.0% | 2.6%(+0.400)#30 | 3.9%(-0.900)#1,525 |
| 31. | Lake Park | 3.1% | 2.6%(+0.500)#31 | 3.9%(-0.800)#1,608 |
| 32. | Clive | 3.2% | 2.6%(+0.600)#32 | 3.9%(-0.700)#1,656 |
| 33. | Peterson | 3.3% | 2.6%(+0.700)#33 | 3.9%(-0.600)#1,782 |
| 34. | Mallard | 3.3% | 2.6%(+0.700)#34 | 3.9%(-0.600)#1,783 |
| 35. | Sioux City | 3.4% | 2.6%(+0.800)#35 | 3.9%(-0.500)#1,789 |
| 36. | Sumner | 3.4% | 2.6%(+0.800)#36 | 3.9%(-0.500)#1,849 |
| 37. | Lone Tree | 3.4% | 2.6%(+0.800)#37 | 3.9%(-0.500)#1,853 |
| 38. | Ventura | 3.5% | 2.6%(+0.900)#38 | 3.9%(-0.400)#1,926 |
| 39. | Burlington | 3.6% | 2.6%(+1.00)#39 | 3.9%(-0.300)#1,954 |
| 40. | Oelwein | 3.6% | 2.6%(+1.00)#40 | 3.9%(-0.300)#1,983 |
| 41. | Storm Lake | 3.7% | 2.6%(+1.10)#41 | 3.9%(-0.200)#2,035 |
| 42. | Dyersville | 3.8% | 2.6%(+1.20)#42 | 3.9%(-0.100)#2,128 |
| 43. | Des Moines | 3.9% | 2.6%(+1.30)#43 | 3.9%(=0.000)#2,148 |
| 44. | Whiting | 3.9% | 2.6%(+1.30)#44 | 3.9%(=0.000)#2,226 |
| 45. | George | 4.0% | 2.6%(+1.40)#45 | 3.9%(+0.100)#2,308 |
| 46. | Mitchellville | 4.5% | 2.6%(+1.90)#46 | 3.9%(+0.600)#2,679 |
| 47. | Princeton | 4.6% | 2.6%(+2.00)#47 | 3.9%(+0.700)#2,768 |
| 48. | Guthrie Center | 4.7% | 2.6%(+2.10)#48 | 3.9%(+0.800)#2,834 |
| 49. | Smithland | 4.7% | 2.6%(+2.10)#49 | 3.9%(+0.800)#2,849 |
| 50. | Dumont | 4.8% | 2.6%(+2.20)#50 | 3.9%(+0.900)#2,893 |
| 51. | Elk Horn | 5.1% | 2.6%(+2.50)#51 | 3.9%(+1.20)#3,091 |
| 52. | Clinton | 5.2% | 2.6%(+2.60)#52 | 3.9%(+1.30)#3,105 |
| 53. | Indianola | 5.2% | 2.6%(+2.60)#53 | 3.9%(+1.30)#3,114 |
| 54. | Charter Oak | 5.2% | 2.6%(+2.60)#54 | 3.9%(+1.30)#3,151 |
| 55. | Marion | 5.4% | 2.6%(+2.80)#55 | 3.9%(+1.50)#3,236 |
| 56. | Atlantic | 5.4% | 2.6%(+2.80)#56 | 3.9%(+1.50)#3,257 |
| 57. | Stratford | 5.4% | 2.6%(+2.80)#57 | 3.9%(+1.50)#3,275 |
| 58. | New London | 5.5% | 2.6%(+2.90)#58 | 3.9%(+1.60)#3,312 |
| 59. | Sanborn | 5.5% | 2.6%(+2.90)#59 | 3.9%(+1.60)#3,314 |
| 60. | Garrison | 5.5% | 2.6%(+2.90)#60 | 3.9%(+1.60)#3,328 |
| 61. | Davenport | 5.6% | 2.6%(+3.00)#61 | 3.9%(+1.70)#3,333 |
| 62. | Armstrong | 5.6% | 2.6%(+3.00)#62 | 3.9%(+1.70)#3,381 |
| 63. | Waterloo | 5.7% | 2.6%(+3.10)#63 | 3.9%(+1.80)#3,389 |
| 64. | New Hampton | 5.7% | 2.6%(+3.10)#64 | 3.9%(+1.80)#3,426 |
| 65. | Battle Creek | 5.7% | 2.6%(+3.10)#65 | 3.9%(+1.80)#3,434 |
| 66. | Postville | 5.8% | 2.6%(+3.20)#66 | 3.9%(+1.90)#3,469 |
| 67. | Sutherland | 6.0% | 2.6%(+3.40)#67 | 3.9%(+2.10)#3,589 |
| 68. | Le Mars | 6.1% | 2.6%(+3.50)#68 | 3.9%(+2.20)#3,616 |
| 69. | La Porte City | 6.1% | 2.6%(+3.50)#69 | 3.9%(+2.20)#3,630 |
| 70. | Corydon | 6.2% | 2.6%(+3.60)#70 | 3.9%(+2.30)#3,683 |
| 71. | Miles | 6.2% | 2.6%(+3.60)#71 | 3.9%(+2.30)#3,700 |
| 72. | Conrad | 6.5% | 2.6%(+3.90)#72 | 3.9%(+2.60)#3,856 |
| 73. | Fayette | 6.5% | 2.6%(+3.90)#73 | 3.9%(+2.60)#3,857 |
| 74. | Ringsted | 6.6% | 2.6%(+4.00)#74 | 3.9%(+2.70)#3,922 |
| 75. | Luther | 6.6% | 2.6%(+4.00)#75 | 3.9%(+2.70)#3,927 |
| 76. | Elgin | 7.1% | 2.6%(+4.50)#76 | 3.9%(+3.20)#4,118 |
| 77. | Iowa Falls | 7.5% | 2.6%(+4.90)#77 | 3.9%(+3.60)#4,269 |
| 78. | De Soto | 7.6% | 2.6%(+5.00)#78 | 3.9%(+3.70)#4,312 |
| 79. | Moorhead | 7.6% | 2.6%(+5.00)#79 | 3.9%(+3.70)#4,322 |
| 80. | Eldora | 7.9% | 2.6%(+5.30)#80 | 3.9%(+4.00)#4,423 |
| 81. | Laurens | 8.0% | 2.6%(+5.40)#81 | 3.9%(+4.10)#4,464 |
| 82. | Kellogg | 8.3% | 2.6%(+5.70)#82 | 3.9%(+4.40)#4,568 |
| 83. | Laurel | 8.3% | 2.6%(+5.70)#83 | 3.9%(+4.40)#4,581 |
| 84. | Roland | 8.5% | 2.6%(+5.90)#84 | 3.9%(+4.60)#4,641 |
| 85. | Hiawatha | 8.6% | 2.6%(+6.00)#85 | 3.9%(+4.70)#4,661 |
| 86. | Manilla | 8.6% | 2.6%(+6.00)#86 | 3.9%(+4.70)#4,679 |
| 87. | Traer | 8.8% | 2.6%(+6.20)#87 | 3.9%(+4.90)#4,728 |
| 88. | Auburn | 9.0% | 2.6%(+6.40)#88 | 3.9%(+5.10)#4,810 |
| 89. | Stuart | 9.2% | 2.6%(+6.60)#89 | 3.9%(+5.30)#4,870 |
| 90. | Dakota City | 9.5% | 2.6%(+6.90)#90 | 3.9%(+5.60)#4,967 |
| 91. | Sheldon | 9.7% | 2.6%(+7.10)#91 | 3.9%(+5.80)#5,011 |
| 92. | Shenandoah | 9.7% | 2.6%(+7.10)#92 | 3.9%(+5.80)#5,012 |
| 93. | Neola | 9.9% | 2.6%(+7.30)#93 | 3.9%(+6.00)#5,075 |
| 94. | Davis City | 9.9% | 2.6%(+7.30)#94 | 3.9%(+6.00)#5,082 |
| 95. | Soldier | 9.9% | 2.6%(+7.30)#95 | 3.9%(+6.00)#5,083 |
| 96. | Mount Pleasant | 10.0% | 2.6%(+7.40)#96 | 3.9%(+6.10)#5,091 |
| 97. | Shueyville | 10.0% | 2.6%(+7.40)#97 | 3.9%(+6.10)#5,109 |
| 98. | Lowden | 10.0% | 2.6%(+7.40)#98 | 3.9%(+6.10)#5,110 |
| 99. | Merrill | 10.5% | 2.6%(+7.90)#99 | 3.9%(+6.60)#5,240 |
| 100. | Decorah | 10.6% | 2.6%(+8.00)#100 | 3.9%(+6.70)#5,250 |
Common Questions
What are the Top 10 Cities with the Lowest Unemployment Rate Amomg Seniors Over the Age of 65 in Iowa?
Top 10 Cities with the Lowest Unemployment Rate Amomg Seniors Over the Age of 65 in Iowa are:
What city has the Lowest Unemployment Rate Amomg Seniors Over the Age of 65 in Iowa?
Urbandale has the Lowest Unemployment Rate Amomg Seniors Over the Age of 65 in Iowa with 0.60%.
What is the Unemployment Rate Amomg Seniors Over the Age of 65 in the State of Iowa?
Unemployment Rate Amomg Seniors Over the Age of 65 in Iowa is 2.6%.
What is the Unemployment Rate Amomg Seniors Over the Age of 65 in the United States?
Unemployment Rate Amomg Seniors Over the Age of 65 in the United States is 3.9%.