Cities with the Lowest Unemployment Rate Amomg Seniors Over the Age of 65 in Connecticut
RELATED REPORTS & OPTIONS
Lowest Unemployment | Senior > 65
Connecticut
Compare Cities
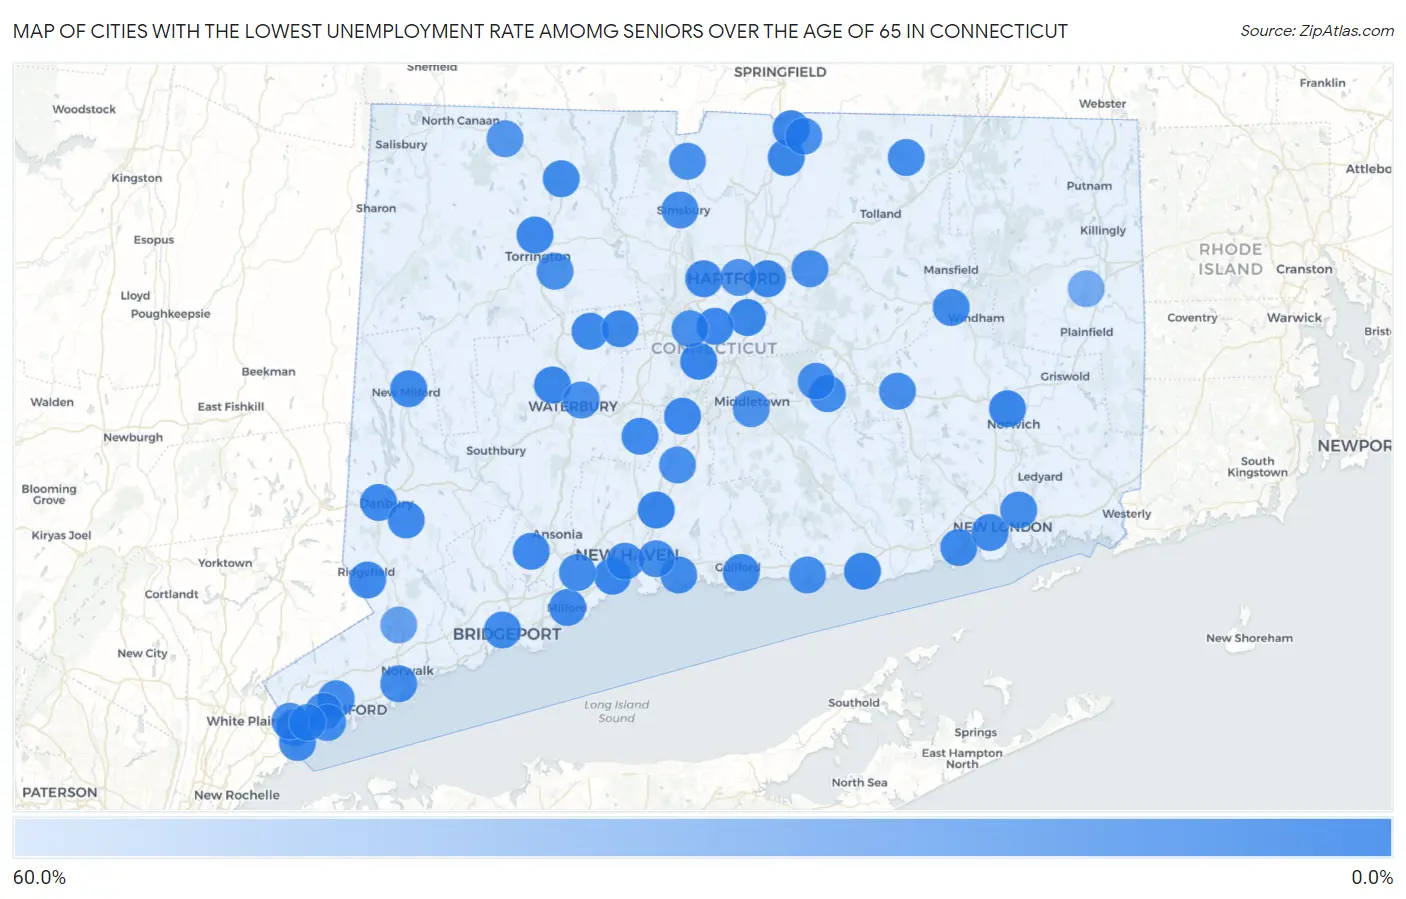
Map of Cities with the Lowest Unemployment Rate Amomg Seniors Over the Age of 65 in Connecticut
60.0%
0.0%
Cities with the Lowest Unemployment Rate Amomg Seniors Over the Age of 65 in Connecticut
| City | Senior Unemployment | vs State | vs National | |
| 1. | North Haven | 1.3% | 4.7%(-3.40)#1 | 3.9%(-2.60)#356 |
| 2. | Saybrook Manor | 1.4% | 4.7%(-3.30)#2 | 3.9%(-2.50)#433 |
| 3. | Kensington | 1.6% | 4.7%(-3.10)#3 | 3.9%(-2.30)#532 |
| 4. | Groton Long Point Borough | 1.6% | 4.7%(-3.10)#4 | 3.9%(-2.30)#545 |
| 5. | Wethersfield | 2.0% | 4.7%(-2.70)#5 | 3.9%(-1.90)#752 |
| 6. | West Haven | 2.3% | 4.7%(-2.40)#6 | 3.9%(-1.60)#943 |
| 7. | Norwich | 2.3% | 4.7%(-2.40)#7 | 3.9%(-1.60)#947 |
| 8. | East Hartford | 2.5% | 4.7%(-2.20)#8 | 3.9%(-1.40)#1,094 |
| 9. | Southwood Acres | 2.5% | 4.7%(-2.20)#9 | 3.9%(-1.40)#1,132 |
| 10. | Oakville | 2.6% | 4.7%(-2.10)#10 | 3.9%(-1.30)#1,200 |
| 11. | Newington | 2.9% | 4.7%(-1.80)#11 | 3.9%(-1.00)#1,397 |
| 12. | Staples | 3.1% | 4.7%(-1.60)#12 | 3.9%(-0.800)#1,589 |
| 13. | Woodmont Borough | 3.2% | 4.7%(-1.50)#13 | 3.9%(-0.700)#1,692 |
| 14. | West Hartford | 3.4% | 4.7%(-1.30)#14 | 3.9%(-0.500)#1,793 |
| 15. | Sherwood Manor | 3.4% | 4.7%(-1.30)#15 | 3.9%(-0.500)#1,837 |
| 16. | Meriden | 3.5% | 4.7%(-1.20)#16 | 3.9%(-0.400)#1,871 |
| 17. | Naugatuck Borough | 3.5% | 4.7%(-1.20)#17 | 3.9%(-0.400)#1,883 |
| 18. | Niantic | 3.9% | 4.7%(-0.800)#18 | 3.9%(=0.000)#2,213 |
| 19. | Tashua | 4.0% | 4.7%(-0.700)#19 | 3.9%(+0.100)#2,292 |
| 20. | Terryville | 4.4% | 4.7%(-0.300)#20 | 3.9%(+0.500)#2,586 |
| 21. | Bristol | 4.5% | 4.7%(-0.200)#21 | 3.9%(+0.600)#2,621 |
| 22. | Torrington | 4.6% | 4.7%(-0.100)#22 | 3.9%(+0.700)#2,712 |
| 23. | New Milford | 4.6% | 4.7%(-0.100)#23 | 3.9%(+0.700)#2,746 |
| 24. | Danbury | 4.7% | 4.7%(=0.000)#24 | 3.9%(+0.800)#2,780 |
| 25. | Bethel | 4.7% | 4.7%(=0.000)#25 | 3.9%(+0.800)#2,813 |
| 26. | Guilford Center | 4.8% | 4.7%(+0.100)#26 | 3.9%(+0.900)#2,882 |
| 27. | Milford City Balance | 4.9% | 4.7%(+0.200)#27 | 3.9%(+1.00)#2,907 |
| 28. | Mill Plain | 4.9% | 4.7%(+0.200)#28 | 3.9%(+1.00)#2,948 |
| 29. | Cheshire Village | 5.0% | 4.7%(+0.300)#29 | 3.9%(+1.10)#3,003 |
| 30. | Waterford | 5.1% | 4.7%(+0.400)#30 | 3.9%(+1.20)#3,069 |
| 31. | Trumbull Center | 5.3% | 4.7%(+0.600)#31 | 3.9%(+1.40)#3,201 |
| 32. | Ridgefield | 5.4% | 4.7%(+0.700)#32 | 3.9%(+1.50)#3,255 |
| 33. | Shelton | 5.6% | 4.7%(+0.900)#33 | 3.9%(+1.70)#3,340 |
| 34. | Branford Center | 5.7% | 4.7%(+1.00)#34 | 3.9%(+1.80)#3,419 |
| 35. | New Haven | 5.8% | 4.7%(+1.10)#35 | 3.9%(+1.90)#3,440 |
| 36. | Norwalk | 5.9% | 4.7%(+1.20)#36 | 3.9%(+2.00)#3,495 |
| 37. | Orange | 5.9% | 4.7%(+1.20)#37 | 3.9%(+2.00)#3,507 |
| 38. | Winsted | 5.9% | 4.7%(+1.20)#38 | 3.9%(+2.00)#3,513 |
| 39. | Willimantic | 6.0% | 4.7%(+1.30)#39 | 3.9%(+2.10)#3,560 |
| 40. | Pemberwick | 6.0% | 4.7%(+1.30)#40 | 3.9%(+2.10)#3,576 |
| 41. | Byram | 6.1% | 4.7%(+1.40)#41 | 3.9%(+2.20)#3,624 |
| 42. | East Hampton | 6.2% | 4.7%(+1.50)#42 | 3.9%(+2.30)#3,678 |
| 43. | Bantam Borough | 6.4% | 4.7%(+1.70)#43 | 3.9%(+2.50)#3,806 |
| 44. | Bridgeport | 6.5% | 4.7%(+1.80)#44 | 3.9%(+2.60)#3,810 |
| 45. | Stamford | 6.5% | 4.7%(+1.80)#45 | 3.9%(+2.60)#3,811 |
| 46. | East Haven | 6.6% | 4.7%(+1.90)#46 | 3.9%(+2.70)#3,871 |
| 47. | Conning Towers Nautilus Park | 6.6% | 4.7%(+1.90)#47 | 3.9%(+2.70)#3,886 |
| 48. | Cos Cob | 6.6% | 4.7%(+1.90)#48 | 3.9%(+2.70)#3,888 |
| 49. | Stafford Springs | 6.6% | 4.7%(+1.90)#49 | 3.9%(+2.70)#3,894 |
| 50. | Riverside | 7.0% | 4.7%(+2.30)#50 | 3.9%(+3.10)#4,064 |
| 51. | Clinton | 7.2% | 4.7%(+2.50)#51 | 3.9%(+3.30)#4,160 |
| 52. | Coleytown | 7.4% | 4.7%(+2.70)#52 | 3.9%(+3.50)#4,233 |
| 53. | Sandy Hook | 7.5% | 4.7%(+2.80)#53 | 3.9%(+3.60)#4,262 |
| 54. | Manchester | 7.9% | 4.7%(+3.20)#54 | 3.9%(+4.00)#4,400 |
| 55. | New Canaan | 7.9% | 4.7%(+3.20)#55 | 3.9%(+4.00)#4,412 |
| 56. | Colchester | 8.0% | 4.7%(+3.30)#56 | 3.9%(+4.10)#4,456 |
| 57. | Lake Pocotopaug | 8.0% | 4.7%(+3.30)#57 | 3.9%(+4.10)#4,457 |
| 58. | Ball Pond | 8.3% | 4.7%(+3.60)#58 | 3.9%(+4.40)#4,555 |
| 59. | Simsbury Center | 8.4% | 4.7%(+3.70)#59 | 3.9%(+4.50)#4,599 |
| 60. | Waterbury | 8.6% | 4.7%(+3.90)#60 | 3.9%(+4.70)#4,648 |
| 61. | New Britain | 8.6% | 4.7%(+3.90)#61 | 3.9%(+4.70)#4,650 |
| 62. | Glenville | 8.8% | 4.7%(+4.10)#62 | 3.9%(+4.90)#4,723 |
| 63. | Litchfield Borough | 8.8% | 4.7%(+4.10)#63 | 3.9%(+4.90)#4,730 |
| 64. | Lordship | 8.9% | 4.7%(+4.20)#64 | 3.9%(+5.00)#4,756 |
| 65. | Northwest Harwinton | 9.2% | 4.7%(+4.50)#65 | 3.9%(+5.30)#4,863 |
| 66. | Salmon Brook | 9.9% | 4.7%(+5.20)#66 | 3.9%(+6.00)#5,070 |
| 67. | Wallingford Center | 10.0% | 4.7%(+5.30)#67 | 3.9%(+6.10)#5,090 |
| 68. | Hazardville | 10.2% | 4.7%(+5.50)#68 | 3.9%(+6.30)#5,147 |
| 69. | Middletown | 10.5% | 4.7%(+5.80)#69 | 3.9%(+6.60)#5,220 |
| 70. | Plattsville | 10.9% | 4.7%(+6.20)#70 | 3.9%(+7.00)#5,312 |
| 71. | Saugatuck | 11.1% | 4.7%(+6.40)#71 | 3.9%(+7.20)#5,350 |
| 72. | Noroton | 11.6% | 4.7%(+6.90)#72 | 3.9%(+7.70)#5,468 |
| 73. | Hartford | 12.0% | 4.7%(+7.30)#73 | 3.9%(+8.10)#5,522 |
| 74. | Westport | 14.1% | 4.7%(+9.40)#74 | 3.9%(+10.2)#5,854 |
| 75. | Greenwich | 14.2% | 4.7%(+9.50)#75 | 3.9%(+10.3)#5,856 |
| 76. | Norfolk | 14.2% | 4.7%(+9.50)#76 | 3.9%(+10.3)#5,880 |
| 77. | Stepney | 17.1% | 4.7%(+12.4)#77 | 3.9%(+13.2)#6,227 |
| 78. | Wilton Center | 22.1% | 4.7%(+17.4)#78 | 3.9%(+18.2)#6,611 |
| 79. | Darien Downtown | 23.2% | 4.7%(+18.5)#79 | 3.9%(+19.3)#6,686 |
| 80. | East | 26.1% | 4.7%(+21.4)#80 | 3.9%(+22.2)#6,824 |
| 81. | Daniels Farm | 27.7% | 4.7%(+23.0)#81 | 3.9%(+23.8)#6,874 |
| 82. | Wauregan | 29.0% | 4.7%(+24.3)#82 | 3.9%(+25.1)#6,939 |
| 83. | Jewett City Borough | 37.2% | 4.7%(+32.5)#83 | 3.9%(+33.3)#7,172 |
| 84. | Brookfield Center | 47.3% | 4.7%(+42.6)#84 | 3.9%(+43.4)#7,326 |
| 85. | Knollcrest | 52.9% | 4.7%(+48.2)#85 | 3.9%(+49.0)#7,391 |
| 86. | Bigelow Corners | 58.8% | 4.7%(+54.1)#86 | 3.9%(+54.9)#7,416 |
1
2Common Questions
What are the Top 10 Cities with the Lowest Unemployment Rate Amomg Seniors Over the Age of 65 in Connecticut?
Top 10 Cities with the Lowest Unemployment Rate Amomg Seniors Over the Age of 65 in Connecticut are:
#1
0.0%
#2
0.0%
#3
0.0%
#4
0.0%
#5
0.0%
#6
0.0%
#7
0.0%
#8
0.0%
#9
0.0%
#10
0.0%
What city has the Lowest Unemployment Rate Amomg Seniors Over the Age of 65 in Connecticut?
North Haven has the Lowest Unemployment Rate Amomg Seniors Over the Age of 65 in Connecticut with 1.3%.
What is the Unemployment Rate Amomg Seniors Over the Age of 65 in the State of Connecticut?
Unemployment Rate Amomg Seniors Over the Age of 65 in Connecticut is 4.7%.
What is the Unemployment Rate Amomg Seniors Over the Age of 65 in the United States?
Unemployment Rate Amomg Seniors Over the Age of 65 in the United States is 3.9%.