Cities with the Lowest Unemployment Rate Amomg Seniors Over the Age of 65 in Vermont

RELATED REPORTS & OPTIONS

Lowest Unemployment | Senior > 65
Population
Families and Households
Female Fertility
Female Fertility (Unmarried)
Race (Community Size)
Race (Percentage)
Ancestry (Community Size)
AfghanAfricanAlaska NativeAlaskan AthabascanAlbanianAleutAlsatianAmericanApacheArabArapahoArgentineanArmenianAssyrian / Chaldean / SyriacAustralianAustrianBahamianBangladeshiBarbadianBasqueBelgianBelizeanBermudanBhutaneseBlackfeetBolivianBrazilianBritishBritish West IndianBulgarianBurmeseCajunCambodianCanadianCape VerdeanCarpatho RusynCelticCentral AmericanCentral American IndianCherokeeCheyenneChickasawChileanChineseChippewaChoctawColombianColvilleComancheCosta RicanCreeCreekCroatianCrowCubanCypriotCzechCzechoslovakianDanishDelawareDominicanDutchDutch West IndianEastern EuropeanEcuadorianEgyptianEnglishEstonianEthiopianEuropeanFijianFilipinoFinnishFrenchFrench American IndianFrench CanadianGermanGerman RussianGhanaianGreekGuamanian / ChamorroGuatemalanGuyaneseHaitianHmongHonduranHopiHoumaHungarianIcelanderIndian (Asian)IndonesianInupiatIranianIraqiIrishIroquoisIsraeliItalianJamaicanJapaneseJordanianKenyanKiowaKoreanLaotianLatvianLebaneseLiberianLithuanianLumbeeLuxembourgerMacedonianMalaysianMalteseMarshalleseMenomineeMexicanMexican American IndianMongolianMoroccanNative HawaiianNavajoNepaleseNew ZealanderNicaraguanNigerianNorthern EuropeanNorwegianOkinawanOsageOttawaPaiutePakistaniPalestinianPanamanianParaguayanPennsylvania GermanPeruvianPimaPolishPortuguesePotawatomiPuebloPuerto RicanPuget Sound SalishRomanianRussianSalvadoranSamoanScandinavianScotch-IrishScottishSeminoleSenegaleseSerbianShoshoneSierra LeoneanSiouxSlavicSlovakSloveneSomaliSouth AfricanSouth AmericanSouth American IndianSoviet UnionSpaniardSpanishSpanish AmericanSpanish American IndianSri LankanSubsaharan AfricanSudaneseSwedishSwissSyrianTaiwaneseThaiTlingit-HaidaTohono O'OdhamTonganTrinidadian and TobagonianTsimshianTurkishU.S. Virgin IslanderUgandanUkrainianUruguayanUteVenezuelanVietnameseWelshWest IndianYakamaYaquiYugoslavianYumanYup'ikZimbabwean
Ancestry (Percentage)
AfghanAfricanAlaska NativeAlaskan AthabascanAlbanianAleutAlsatianAmericanApacheArabArapahoArgentineanArmenianAssyrian / Chaldean / SyriacAustralianAustrianBahamianBangladeshiBarbadianBasqueBelgianBelizeanBermudanBhutaneseBlackfeetBolivianBrazilianBritishBritish West IndianBulgarianBurmeseCajunCambodianCanadianCape VerdeanCarpatho RusynCelticCentral AmericanCentral American IndianCherokeeCheyenneChickasawChileanChineseChippewaChoctawColombianColvilleComancheCosta RicanCreeCreekCroatianCrowCubanCypriotCzechCzechoslovakianDanishDelawareDominicanDutchDutch West IndianEastern EuropeanEcuadorianEgyptianEnglishEstonianEthiopianEuropeanFijianFilipinoFinnishFrenchFrench American IndianFrench CanadianGermanGerman RussianGhanaianGreekGuamanian / ChamorroGuatemalanGuyaneseHaitianHmongHonduranHopiHoumaHungarianIcelanderIndian (Asian)IndonesianInupiatIranianIraqiIrishIroquoisIsraeliItalianJamaicanJapaneseJordanianKenyanKiowaKoreanLaotianLatvianLebaneseLiberianLithuanianLumbeeLuxembourgerMacedonianMalaysianMalteseMarshalleseMenomineeMexicanMexican American IndianMongolianMoroccanNative HawaiianNavajoNepaleseNew ZealanderNicaraguanNigerianNorthern EuropeanNorwegianOkinawanOsageOttawaPaiutePakistaniPalestinianPanamanianParaguayanPennsylvania GermanPeruvianPimaPolishPortuguesePotawatomiPuebloPuerto RicanPuget Sound SalishRomanianRussianSalvadoranSamoanScandinavianScotch-IrishScottishSeminoleSenegaleseSerbianShoshoneSierra LeoneanSiouxSlavicSlovakSloveneSomaliSouth AfricanSouth AmericanSouth American IndianSoviet UnionSpaniardSpanishSpanish AmericanSpanish American IndianSri LankanSubsaharan AfricanSudaneseSwedishSwissSyrianTaiwaneseThaiTlingit-HaidaTohono O'OdhamTonganTrinidadian and TobagonianTsimshianTurkishU.S. Virgin IslanderUgandanUkrainianUruguayanUteVenezuelanVietnameseWelshWest IndianYakamaYaquiYugoslavianYumanYup'ikZimbabwean
Immigrant Origin (Total)
AfghanistanAfricaAlbaniaArgentinaArmeniaAsiaAustraliaAustriaAzoresBahamasBangladeshBarbadosBelarusBelgiumBelizeBoliviaBosnia and HerzegovinaBrazilBulgariaBurma / MyanmarCabo VerdeCambodiaCameroonCanadaCaribbeanCentral AmericaChileChinaColombiaCongoCosta RicaCroatiaCubaCzechoslovakiaDenmarkDominicaDominican RepublicEastern AfricaEastern AsiaEastern EuropeEcuadorEgyptEl SalvadorEnglandEritreaEthiopiaEuropeFijiFranceGermanyGhanaGreeceGrenadaGuatemalaGuyanaHaitiHondurasHong KongHungaryIndiaIndonesiaIranIraqIrelandIsraelItalyJamaicaJapanJordanKazakhstanKenyaKoreaKuwaitLaosLatin AmericaLatviaLebanonLiberiaLithuaniaMalaysiaMexicoMicronesiaMiddle AfricaMoldovaMoroccoNepalNetherlandsNicaraguaNigeriaNorth MacedoniaNorthern AfricaNorthern EuropeNorwayOceaniaPakistanPanamaPeruPhilippinesPolandPortugalRomaniaRussiaSaudi ArabiaScotlandSenegalSerbiaSierra LeoneSingaporeSomaliaSouth AfricaSouth AmericaSouth Central AsiaSouth Eastern AsiaSouthern EuropeSpainSri LankaSt. Vincent and the GrenadinesSudanSwedenSwitzerlandSyriaTaiwanThailandTrinidad and TobagoTurkeyUgandaUkraineUruguayUzbekistanVenezuelaVietnamWest IndiesWestern AfricaWestern AsiaWestern EuropeYemenZaireZimbabwe
Immigrant Origin (Percentage)
AfghanistanAfricaAlbaniaArgentinaArmeniaAsiaAustraliaAustriaAzoresBahamasBangladeshBarbadosBelarusBelgiumBelizeBoliviaBosnia and HerzegovinaBrazilBulgariaBurma / MyanmarCabo VerdeCambodiaCameroonCanadaCaribbeanCentral AmericaChileChinaColombiaCongoCosta RicaCroatiaCubaCzechoslovakiaDenmarkDominicaDominican RepublicEastern AfricaEastern AsiaEastern EuropeEcuadorEgyptEl SalvadorEnglandEritreaEthiopiaEuropeFijiFranceGermanyGhanaGreeceGrenadaGuatemalaGuyanaHaitiHondurasHong KongHungaryIndiaIndonesiaIranIraqIrelandIsraelItalyJamaicaJapanJordanKazakhstanKenyaKoreaKuwaitLaosLatin AmericaLatviaLebanonLiberiaLithuaniaMalaysiaMexicoMicronesiaMiddle AfricaMoldovaMoroccoNepalNetherlandsNicaraguaNigeriaNorth MacedoniaNorthern AfricaNorthern EuropeNorwayOceaniaPakistanPanamaPeruPhilippinesPolandPortugalRomaniaRussiaSaudi ArabiaScotlandSenegalSerbiaSierra LeoneSingaporeSomaliaSouth AfricaSouth AmericaSouth Central AsiaSouth Eastern AsiaSouthern EuropeSpainSri LankaSt. Vincent and the GrenadinesSudanSwedenSwitzerlandSyriaTaiwanThailandTrinidad and TobagoTurkeyUgandaUkraineUruguayUzbekistanVenezuelaVietnamWest IndiesWestern AfricaWestern AsiaWestern EuropeYemenZaireZimbabwe
Income
Income (Families)
Income (Households)
Poverty
Poverty (Families)
Unemployment
Employment Occupations
Employment Industries
Employer Class
Commute Time
Commute Means
School Enrollment
Education by Degree Field
Occupancy
Finances
Physical Characteristics
Vermont
Compare Cities
Comparison Subject

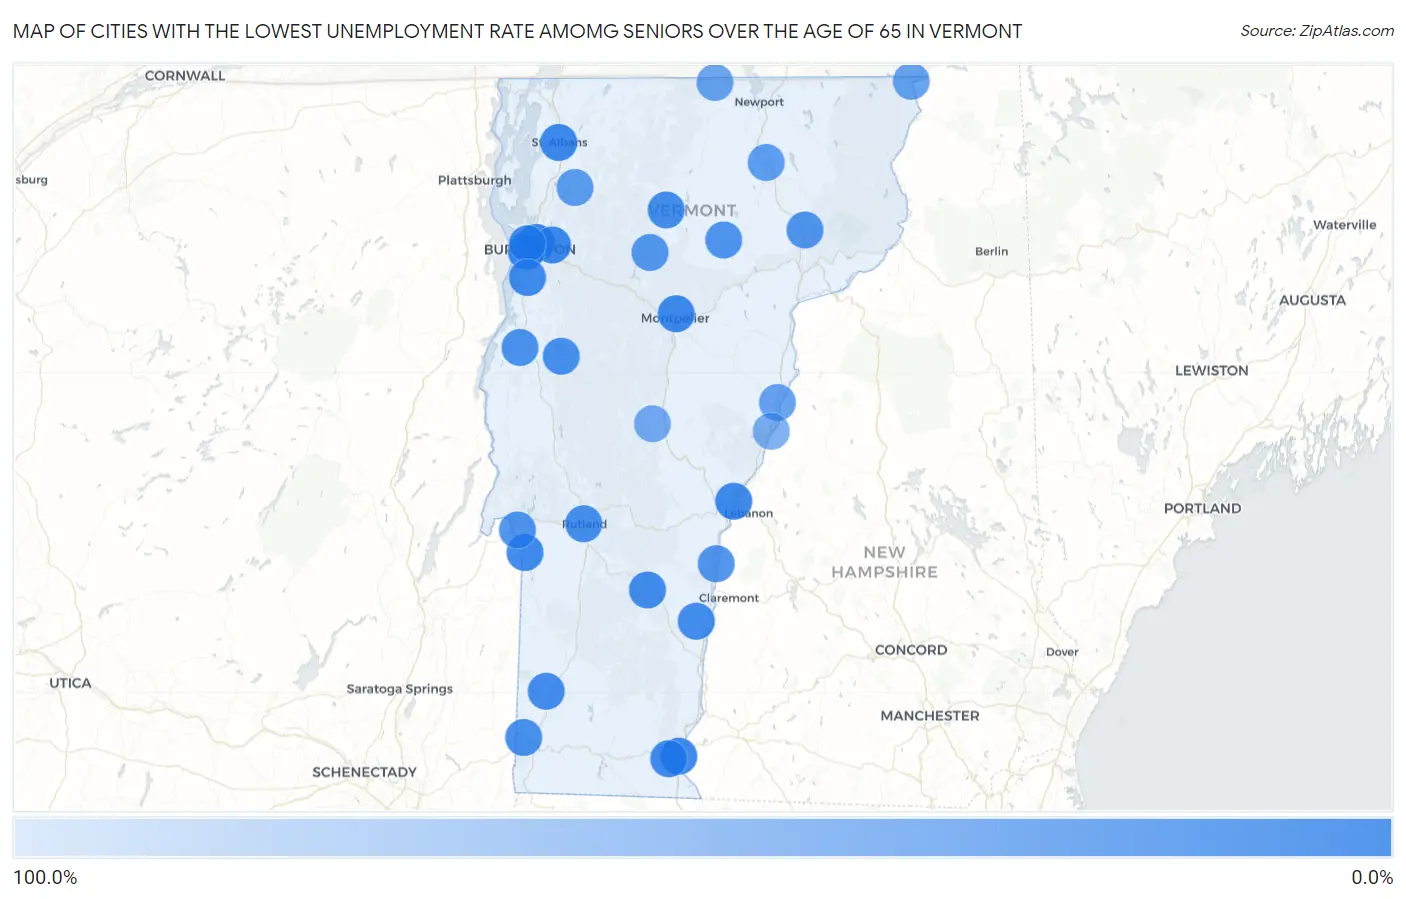
Map of Cities with the Lowest Unemployment Rate Amomg Seniors Over the Age of 65 in Vermont

100.0%
0.0%
Cities with the Lowest Unemployment Rate Amomg Seniors Over the Age of 65 in Vermont Map

Cities with the Lowest Unemployment Rate Amomg Seniors Over the Age of 65 in Vermont

City Senior Unemployment vs State vs National
1.Winooski0.40%3.1%(-2.70)#13.9%(-3.50)#42
2.Essex Junction1.4%3.1%(-1.70)#23.9%(-2.50)#419
3.South Burlington2.2%3.1%(-0.900)#33.9%(-1.70)#894
4.St Albans3.0%3.1%(-0.100)#43.9%(-0.900)#1,509
5.Montpelier3.1%3.1%(=0.000)#53.9%(-0.800)#1,586
6.Burlington3.5%3.1%(+0.400)#63.9%(-0.400)#1,874
7.Wilder4.1%3.1%(+1.000)#73.9%(+0.200)#2,374
8.Brattleboro4.5%3.1%(+1.40)#83.9%(+0.600)#2,667
9.West Brattleboro5.1%3.1%(+2.00)#93.9%(+1.20)#3,072
10.Shelburne6.0%3.1%(+2.90)#103.9%(+2.10)#3,571
11.Ludlow6.4%3.1%(+3.30)#113.9%(+2.50)#3,805
12.Poultney6.8%3.1%(+3.70)#123.9%(+2.90)#4,004
13.Hyde Park8.6%3.1%(+5.50)#133.9%(+4.70)#4,682
14.Springfield9.0%3.1%(+5.90)#143.9%(+5.10)#4,779
15.Arlington9.0%3.1%(+5.90)#153.9%(+5.10)#4,788
16.Rutland9.8%3.1%(+6.70)#163.9%(+5.90)#5,035
17.Bristol10.2%3.1%(+7.10)#173.9%(+6.30)#5,163
18.North Bennington10.4%3.1%(+7.30)#183.9%(+6.50)#5,217
19.Vergennes14.9%3.1%(+11.8)#193.9%(+11.0)#5,957
20.Wardsboro15.0%3.1%(+11.9)#203.9%(+11.1)#5,975
21.Hardwick16.6%3.1%(+13.5)#213.9%(+12.7)#6,140
22.Fair Haven17.4%3.1%(+14.3)#223.9%(+13.5)#6,255
23.Windsor18.0%3.1%(+14.9)#233.9%(+14.1)#6,307
24.Lyndonville19.4%3.1%(+16.3)#243.9%(+15.5)#6,440
25.Stowe20.5%3.1%(+17.4)#253.9%(+16.6)#6,531
26.Lunenburg24.3%3.1%(+21.2)#263.9%(+20.4)#6,729
27.Fairfax26.8%3.1%(+23.7)#273.9%(+22.9)#6,848
28.Barton28.1%3.1%(+25.0)#283.9%(+24.2)#6,892
29.Canaan33.8%3.1%(+30.7)#293.9%(+29.9)#7,112
30.Bradford35.1%3.1%(+32.0)#303.9%(+31.2)#7,136
31.North Troy37.4%3.1%(+34.3)#313.9%(+33.5)#7,177
32.Castleton Four Corners41.7%3.1%(+38.6)#323.9%(+37.8)#7,260
33.Randolph44.8%3.1%(+41.7)#333.9%(+40.9)#7,297
34.Westford46.6%3.1%(+43.5)#343.9%(+42.7)#7,316
35.Fairlee50.1%3.1%(+47.0)#353.9%(+46.2)#7,380
36.West Pawlet69.3%3.1%(+66.2)#363.9%(+65.4)#7,472
37.Townshend100.0%3.1%(+96.9)#373.9%(+96.1)#7,639

Common Questions

What are the Top 10 Cities with the Lowest Unemployment Rate Amomg Seniors Over the Age of 65 in Vermont?
Top 10 Cities with the Lowest Unemployment Rate Amomg Seniors Over the Age of 65 in Vermont are:
What city has the Lowest Unemployment Rate Amomg Seniors Over the Age of 65 in Vermont?
Winooski has the Lowest Unemployment Rate Amomg Seniors Over the Age of 65 in Vermont with 0.40%.
What is the Unemployment Rate Amomg Seniors Over the Age of 65 in the State of Vermont?
Unemployment Rate Amomg Seniors Over the Age of 65 in Vermont is 3.1%.
What is the Unemployment Rate Amomg Seniors Over the Age of 65 in the United States?
Unemployment Rate Amomg Seniors Over the Age of 65 in the United States is 3.9%.