Anacortes, WA Map & Demographics
Anacortes Map
Anacortes Overview
$49,833
PER CAPITA INCOME
$108,321
AVG FAMILY INCOME
$86,911
AVG HOUSEHOLD INCOME
44.3%
WAGE / INCOME GAP [ % ]
55.7¢/ $1
WAGE / INCOME GAP [ $ ]
$11,462
FAMILY INCOME DEFICIT
0.44
INEQUALITY / GINI INDEX
17,667
TOTAL POPULATION
8,680
MALE POPULATION
8,987
FEMALE POPULATION
96.58
MALES / 100 FEMALES
103.54
FEMALES / 100 MALES
48.7
MEDIAN AGE
2.8
AVG FAMILY SIZE
2.2
AVG HOUSEHOLD SIZE
7,943
LABOR FORCE [ PEOPLE ]
53.2%
PERCENT IN LABOR FORCE
4.2%
UNEMPLOYMENT RATE
Anacortes Zip Codes
Anacortes Area Codes
Income in Anacortes
Income Overview in Anacortes
Per Capita Income in Anacortes is $49,833, while median incomes of families and households are $108,321 and $86,911 respectively.
| Characteristic | Number | Measure |
| Per Capita Income | 17,667 | $49,833 |
| Median Family Income | 4,896 | $108,321 |
| Mean Family Income | 4,896 | $130,171 |
| Median Household Income | 7,799 | $86,911 |
| Mean Household Income | 7,799 | $109,851 |
| Income Deficit | 4,896 | $11,462 |
| Wage / Income Gap (%) | 17,667 | 44.32% |
| Wage / Income Gap ($) | 17,667 | 55.68¢ per $1 |
| Gini / Inequality Index | 17,667 | 0.44 |
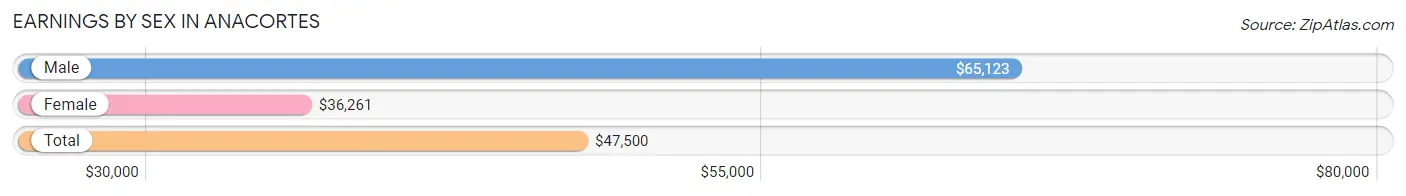
Earnings by Sex in Anacortes
Average Earnings in Anacortes are $47,500, $65,123 for men and $36,261 for women, a difference of 44.3%.
| Sex | Number | Average Earnings |
| Male | 4,617 (54.5%) | $65,123 |
| Female | 3,857 (45.5%) | $36,261 |
| Total | 8,474 (100.0%) | $47,500 |
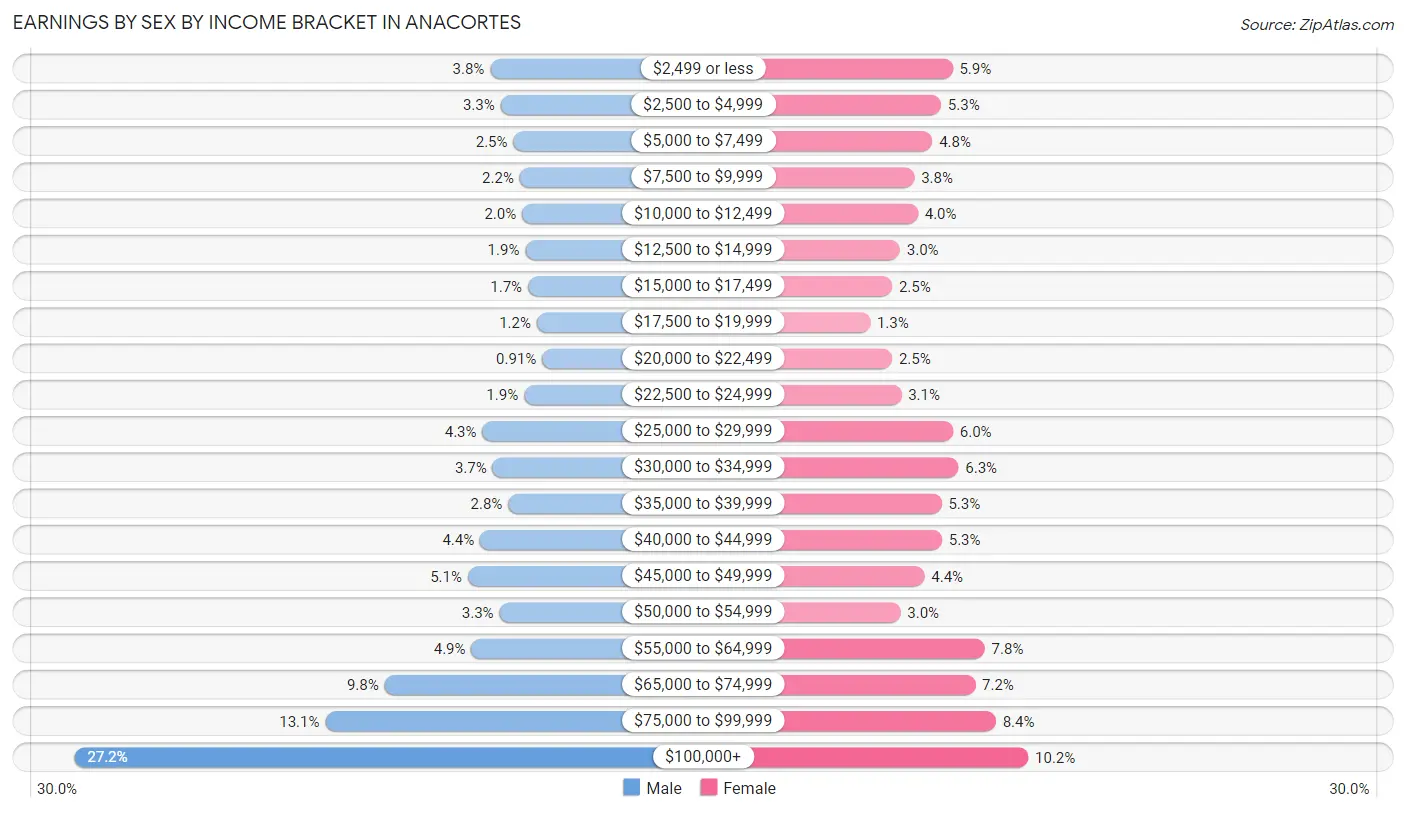
Earnings by Sex by Income Bracket in Anacortes
The most common earnings brackets in Anacortes are $100,000+ for men (1,256 | 27.2%) and $100,000+ for women (393 | 10.2%).
| Income | Male | Female |
| $2,499 or less | 177 (3.8%) | 229 (5.9%) |
| $2,500 to $4,999 | 150 (3.3%) | 204 (5.3%) |
| $5,000 to $7,499 | 117 (2.5%) | 185 (4.8%) |
| $7,500 to $9,999 | 100 (2.2%) | 146 (3.8%) |
| $10,000 to $12,499 | 94 (2.0%) | 154 (4.0%) |
| $12,500 to $14,999 | 86 (1.9%) | 115 (3.0%) |
| $15,000 to $17,499 | 79 (1.7%) | 98 (2.5%) |
| $17,500 to $19,999 | 56 (1.2%) | 50 (1.3%) |
| $20,000 to $22,499 | 42 (0.9%) | 98 (2.5%) |
| $22,500 to $24,999 | 89 (1.9%) | 118 (3.1%) |
| $25,000 to $29,999 | 197 (4.3%) | 230 (6.0%) |
| $30,000 to $34,999 | 171 (3.7%) | 242 (6.3%) |
| $35,000 to $39,999 | 130 (2.8%) | 205 (5.3%) |
| $40,000 to $44,999 | 203 (4.4%) | 206 (5.3%) |
| $45,000 to $49,999 | 235 (5.1%) | 168 (4.4%) |
| $50,000 to $54,999 | 153 (3.3%) | 116 (3.0%) |
| $55,000 to $64,999 | 226 (4.9%) | 299 (7.7%) |
| $65,000 to $74,999 | 451 (9.8%) | 278 (7.2%) |
| $75,000 to $99,999 | 605 (13.1%) | 323 (8.4%) |
| $100,000+ | 1,256 (27.2%) | 393 (10.2%) |
| Total | 4,617 (100.0%) | 3,857 (100.0%) |
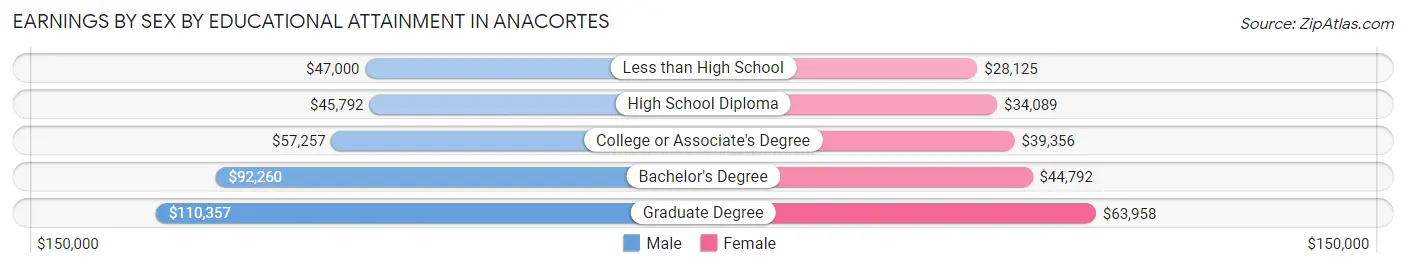
Earnings by Sex by Educational Attainment in Anacortes
Average earnings in Anacortes are $70,744 for men and $40,504 for women, a difference of 42.7%. Men with an educational attainment of graduate degree enjoy the highest average annual earnings of $110,357, while those with high school diploma education earn the least with $45,792. Women with an educational attainment of graduate degree earn the most with the average annual earnings of $63,958, while those with less than high school education have the smallest earnings of $28,125.
| Educational Attainment | Male Income | Female Income |
| Less than High School | $47,000 | $28,125 |
| High School Diploma | $45,792 | $34,089 |
| College or Associate's Degree | $57,257 | $39,356 |
| Bachelor's Degree | $92,260 | $44,792 |
| Graduate Degree | $110,357 | $63,958 |
| Total | $70,744 | $40,504 |
Family Income in Anacortes
Family Income Brackets in Anacortes
According to the Anacortes family income data, there are 1,165 families falling into the $100,000 to $149,999 income range, which is the most common income bracket and makes up 23.8% of all families. Conversely, the $10,000 to $14,999 income bracket is the least frequent group with only 64 families (1.3%) belonging to this category.
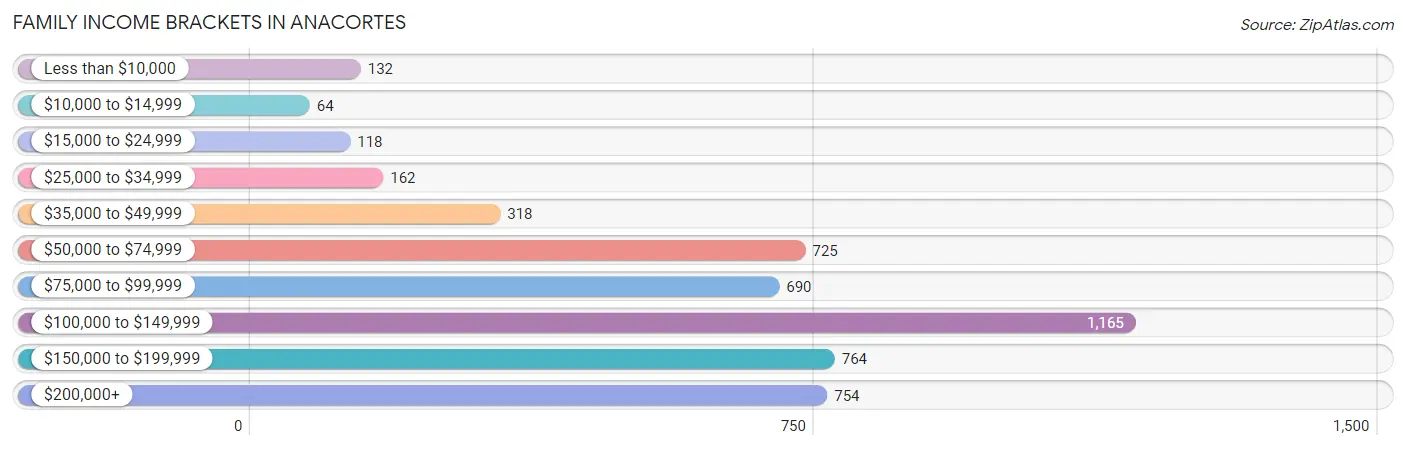
| Income Bracket | # Families | % Families |
| Less than $10,000 | 132 | 2.7% |
| $10,000 to $14,999 | 64 | 1.3% |
| $15,000 to $24,999 | 118 | 2.4% |
| $25,000 to $34,999 | 162 | 3.3% |
| $35,000 to $49,999 | 318 | 6.5% |
| $50,000 to $74,999 | 725 | 14.8% |
| $75,000 to $99,999 | 690 | 14.1% |
| $100,000 to $149,999 | 1,165 | 23.8% |
| $150,000 to $199,999 | 764 | 15.6% |
| $200,000+ | 754 | 15.4% |
Family Income by Famaliy Size in Anacortes
5-person families (309 | 6.3%) account for the highest median family income in Anacortes with $142,344 per family, while 2-person families (2,876 | 58.7%) have the highest median income of $48,005 per family member.
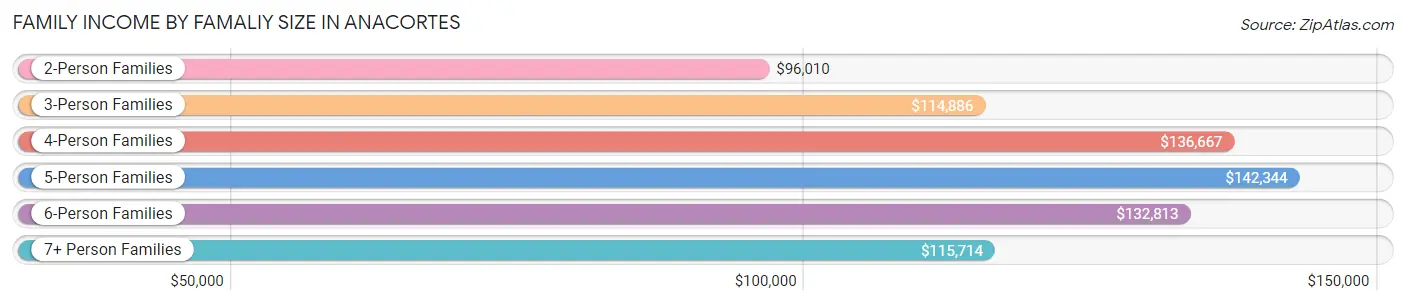
| Income Bracket | # Families | Median Income |
| 2-Person Families | 2,876 (58.7%) | $96,010 |
| 3-Person Families | 899 (18.4%) | $114,886 |
| 4-Person Families | 660 (13.5%) | $136,667 |
| 5-Person Families | 309 (6.3%) | $142,344 |
| 6-Person Families | 86 (1.8%) | $132,813 |
| 7+ Person Families | 66 (1.3%) | $115,714 |
| Total | 4,896 (100.0%) | $108,321 |
Family Income by Number of Earners in Anacortes
The median family income in Anacortes is $108,321, with families comprising 3+ earners (387) having the highest median family income of $174,375, while families with no earners (1,386) have the lowest median family income of $81,452, accounting for 7.9% and 28.3% of families, respectively.
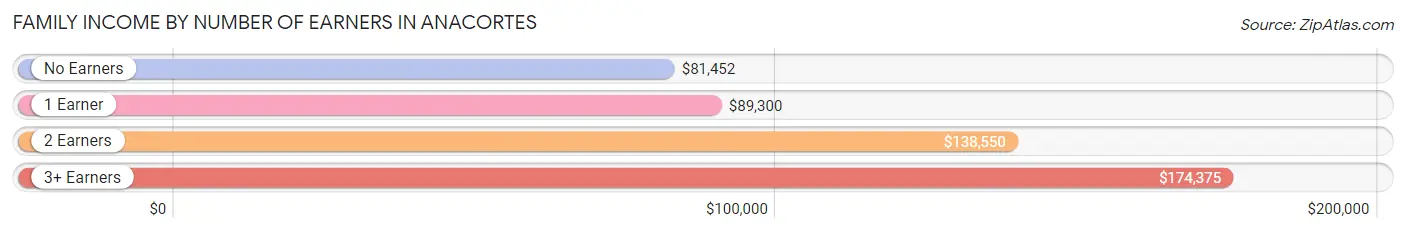
| Number of Earners | # Families | Median Income |
| No Earners | 1,386 (28.3%) | $81,452 |
| 1 Earner | 1,456 (29.7%) | $89,300 |
| 2 Earners | 1,667 (34.1%) | $138,550 |
| 3+ Earners | 387 (7.9%) | $174,375 |
| Total | 4,896 (100.0%) | $108,321 |
Household Income in Anacortes
Household Income Brackets in Anacortes
With 1,513 households falling in the category, the $100,000 to $149,999 income range is the most frequent in Anacortes, accounting for 19.4% of all households. In contrast, only 296 households (3.8%) fall into the $10,000 to $14,999 income bracket, making it the least populous group.
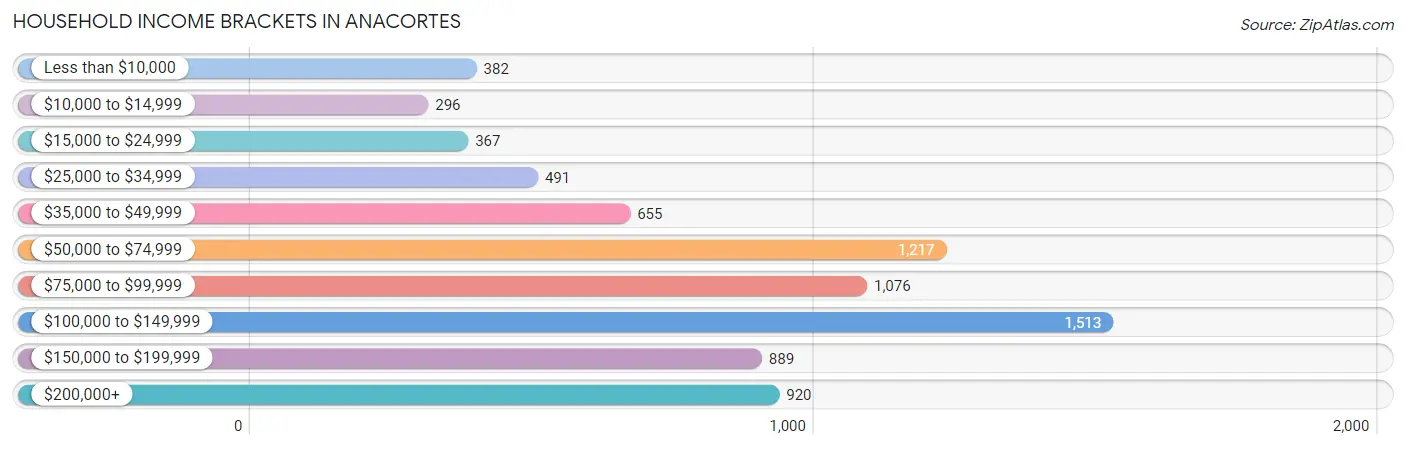
| Income Bracket | # Households | % Households |
| Less than $10,000 | 382 | 4.9% |
| $10,000 to $14,999 | 296 | 3.8% |
| $15,000 to $24,999 | 367 | 4.7% |
| $25,000 to $34,999 | 491 | 6.3% |
| $35,000 to $49,999 | 655 | 8.4% |
| $50,000 to $74,999 | 1,217 | 15.6% |
| $75,000 to $99,999 | 1,076 | 13.8% |
| $100,000 to $149,999 | 1,513 | 19.4% |
| $150,000 to $199,999 | 889 | 11.4% |
| $200,000+ | 920 | 11.8% |
Household Income by Householder Age in Anacortes
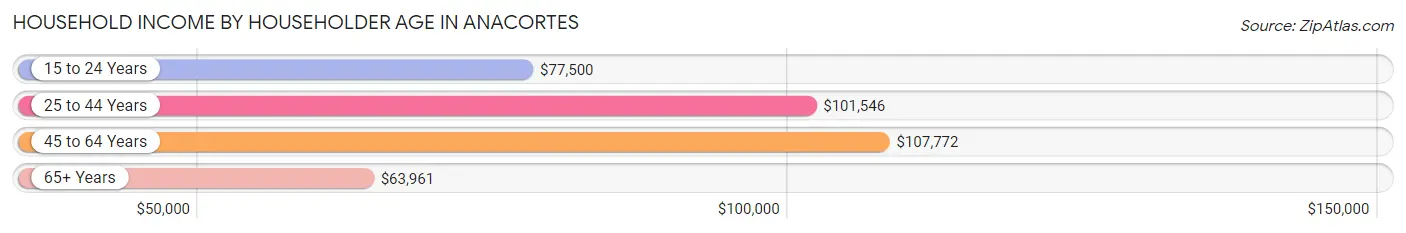
The median household income in Anacortes is $86,911, with the highest median household income of $107,772 found in the 45 to 64 years age bracket for the primary householder. A total of 2,479 households (31.8%) fall into this category. Meanwhile, the 65+ years age bracket for the primary householder has the lowest median household income of $63,961, with 3,281 households (42.1%) in this group.
| Income Bracket | # Households | Median Income |
| 15 to 24 Years | 170 (2.2%) | $77,500 |
| 25 to 44 Years | 1,869 (24.0%) | $101,546 |
| 45 to 64 Years | 2,479 (31.8%) | $107,772 |
| 65+ Years | 3,281 (42.1%) | $63,961 |
| Total | 7,799 (100.0%) | $86,911 |
Poverty in Anacortes
Income Below Poverty by Sex and Age in Anacortes
With 7.5% poverty level for males and 9.4% for females among the residents of Anacortes, 5 year old males and 25 to 34 year old females are the most vulnerable to poverty, with 29 males (20.9%) and 141 females (17.0%) in their respective age groups living below the poverty level.
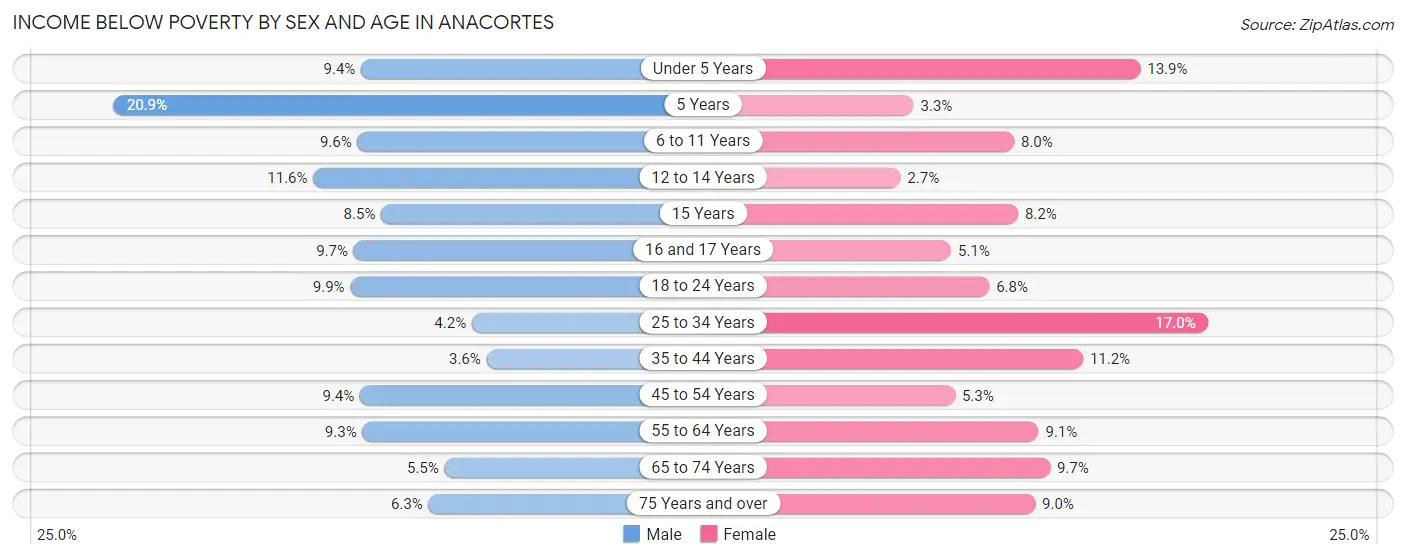
| Age Bracket | Male | Female |
| Under 5 Years | 32 (9.4%) | 50 (13.9%) |
| 5 Years | 29 (20.9%) | 3 (3.3%) |
| 6 to 11 Years | 55 (9.6%) | 39 (8.0%) |
| 12 to 14 Years | 29 (11.6%) | 7 (2.7%) |
| 15 Years | 6 (8.5%) | 9 (8.2%) |
| 16 and 17 Years | 21 (9.7%) | 11 (5.1%) |
| 18 to 24 Years | 58 (9.9%) | 32 (6.8%) |
| 25 to 34 Years | 41 (4.2%) | 141 (17.0%) |
| 35 to 44 Years | 36 (3.6%) | 109 (11.2%) |
| 45 to 54 Years | 100 (9.4%) | 50 (5.2%) |
| 55 to 64 Years | 99 (9.3%) | 120 (9.1%) |
| 65 to 74 Years | 71 (5.5%) | 161 (9.7%) |
| 75 Years and over | 64 (6.2%) | 105 (9.0%) |
| Total | 641 (7.5%) | 837 (9.4%) |
Income Above Poverty by Sex and Age in Anacortes
According to the poverty statistics in Anacortes, males aged 35 to 44 years and females aged 12 to 14 years are the age groups that are most secure financially, with 96.4% of males and 97.3% of females in these age groups living above the poverty line.
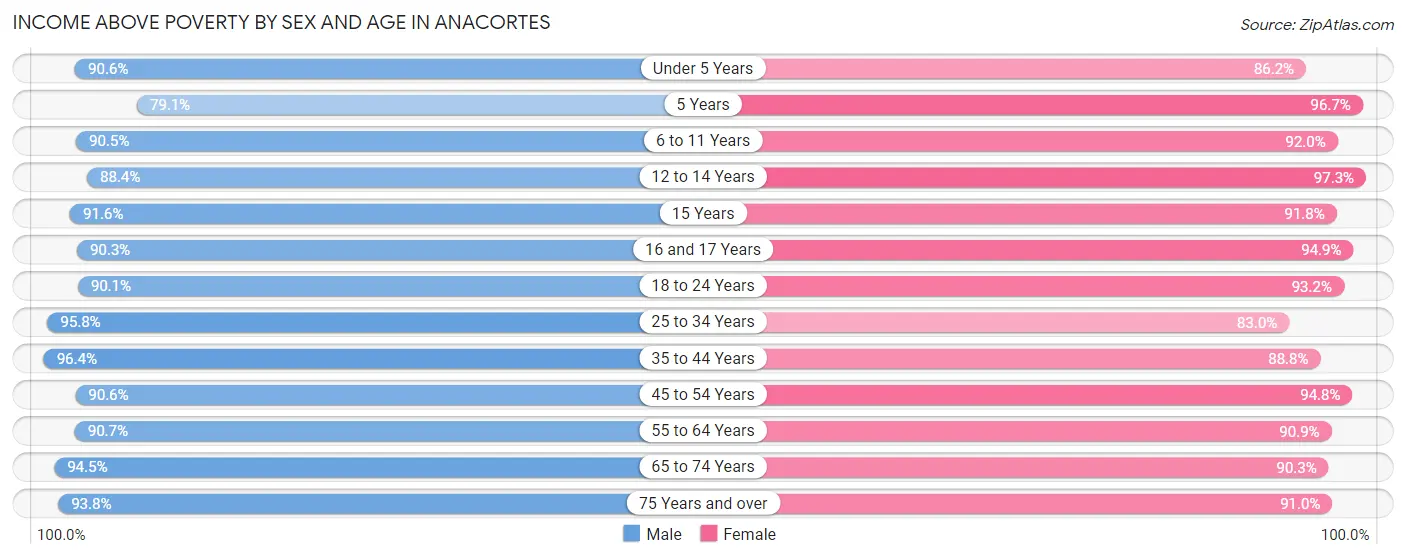
| Age Bracket | Male | Female |
| Under 5 Years | 309 (90.6%) | 311 (86.2%) |
| 5 Years | 110 (79.1%) | 87 (96.7%) |
| 6 to 11 Years | 521 (90.4%) | 449 (92.0%) |
| 12 to 14 Years | 221 (88.4%) | 250 (97.3%) |
| 15 Years | 65 (91.5%) | 101 (91.8%) |
| 16 and 17 Years | 195 (90.3%) | 206 (94.9%) |
| 18 to 24 Years | 529 (90.1%) | 436 (93.2%) |
| 25 to 34 Years | 927 (95.8%) | 690 (83.0%) |
| 35 to 44 Years | 976 (96.4%) | 865 (88.8%) |
| 45 to 54 Years | 961 (90.6%) | 903 (94.8%) |
| 55 to 64 Years | 963 (90.7%) | 1,194 (90.9%) |
| 65 to 74 Years | 1,218 (94.5%) | 1,506 (90.3%) |
| 75 Years and over | 960 (93.8%) | 1,065 (91.0%) |
| Total | 7,955 (92.5%) | 8,063 (90.6%) |
Income Below Poverty Among Married-Couple Families in Anacortes
The poverty statistics for married-couple families in Anacortes show that 2.8% or 116 of the total 4,098 families live below the poverty line. Families with 1 or 2 children have the highest poverty rate of 3.5%, comprising of 37 families. On the other hand, families with 5 or more children have the lowest poverty rate of 0.0%, which includes 0 families.
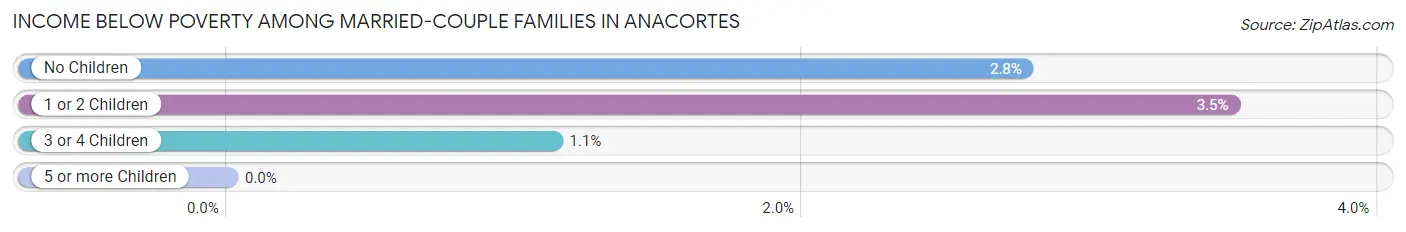
| Children | Above Poverty | Below Poverty |
| No Children | 2,666 (97.2%) | 76 (2.8%) |
| 1 or 2 Children | 1,023 (96.5%) | 37 (3.5%) |
| 3 or 4 Children | 263 (98.9%) | 3 (1.1%) |
| 5 or more Children | 30 (100.0%) | 0 (0.0%) |
| Total | 3,982 (97.2%) | 116 (2.8%) |
Income Below Poverty Among Single-Parent Households in Anacortes
According to the poverty data in Anacortes, 9.2% or 19 single-father households and 24.5% or 145 single-mother households are living below the poverty line. Among single-father households, those with 3 or 4 children have the highest poverty rate, with 5 households (38.5%) experiencing poverty. Likewise, among single-mother households, those with 3 or 4 children have the highest poverty rate, with 13 households (37.1%) falling below the poverty line.
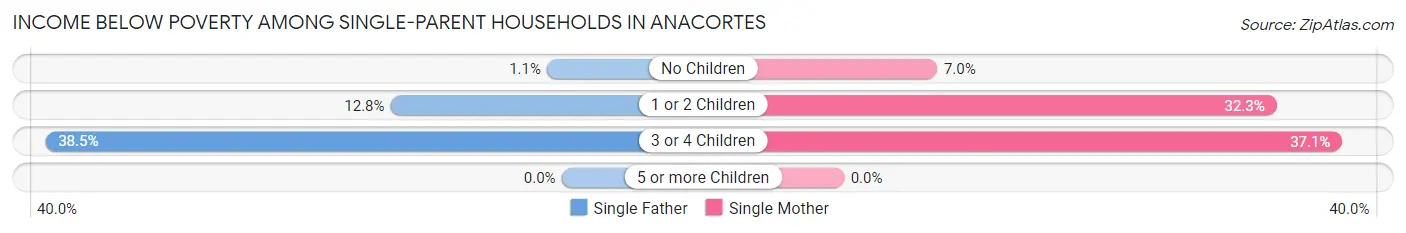
| Children | Single Father | Single Mother |
| No Children | 1 (1.1%) | 13 (7.0%) |
| 1 or 2 Children | 13 (12.8%) | 119 (32.3%) |
| 3 or 4 Children | 5 (38.5%) | 13 (37.1%) |
| 5 or more Children | 0 (0.0%) | 0 (0.0%) |
| Total | 19 (9.2%) | 145 (24.5%) |
Income Below Poverty Among Married-Couple vs Single-Parent Households in Anacortes
The poverty data for Anacortes shows that 116 of the married-couple family households (2.8%) and 164 of the single-parent households (20.5%) are living below the poverty level. Within the married-couple family households, those with 1 or 2 children have the highest poverty rate, with 37 households (3.5%) falling below the poverty line. Among the single-parent households, those with 3 or 4 children have the highest poverty rate, with 18 household (37.5%) living below poverty.
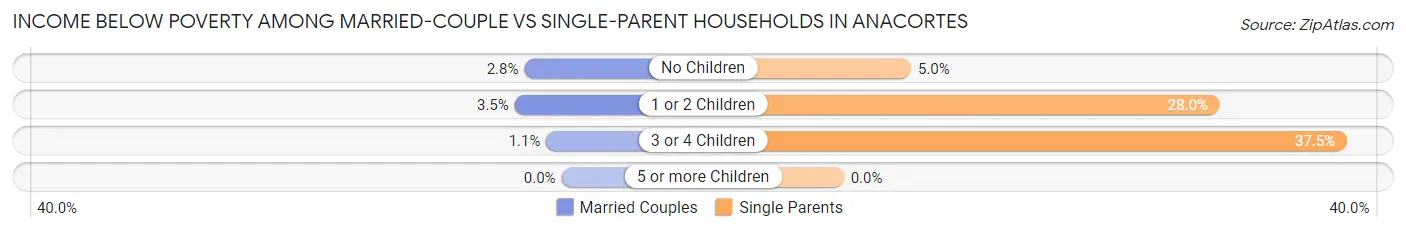
| Children | Married-Couple Families | Single-Parent Households |
| No Children | 76 (2.8%) | 14 (5.0%) |
| 1 or 2 Children | 37 (3.5%) | 132 (28.0%) |
| 3 or 4 Children | 3 (1.1%) | 18 (37.5%) |
| 5 or more Children | 0 (0.0%) | 0 (0.0%) |
| Total | 116 (2.8%) | 164 (20.5%) |
Race in Anacortes
The most populous races in Anacortes are White / Caucasian (15,615 | 88.4%), Hispanic or Latino (1,188 | 6.7%), and Two or more Races (1,153 | 6.5%).
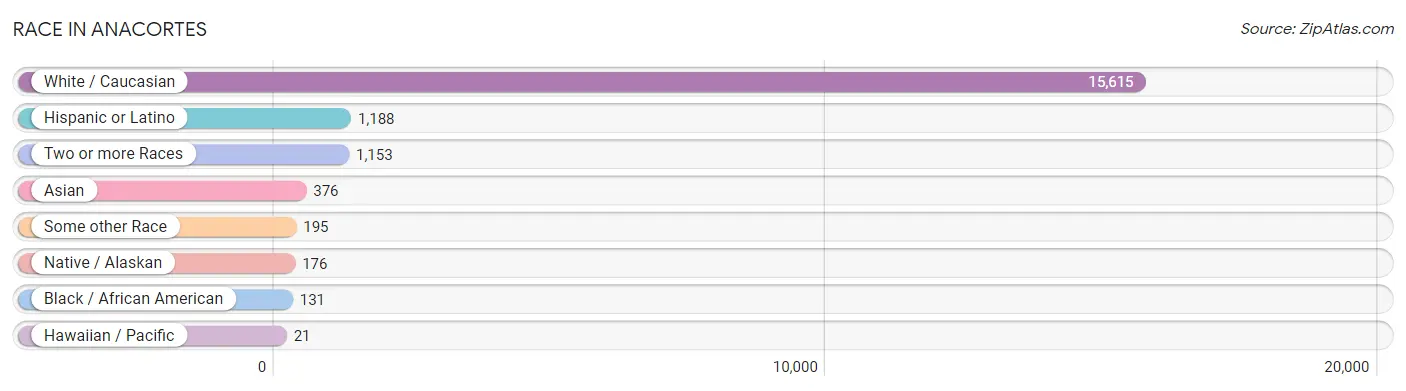
| Race | # Population | % Population |
| Asian | 376 | 2.1% |
| Black / African American | 131 | 0.7% |
| Hawaiian / Pacific | 21 | 0.1% |
| Hispanic or Latino | 1,188 | 6.7% |
| Native / Alaskan | 176 | 1.0% |
| White / Caucasian | 15,615 | 88.4% |
| Two or more Races | 1,153 | 6.5% |
| Some other Race | 195 | 1.1% |
| Total | 17,667 | 100.0% |
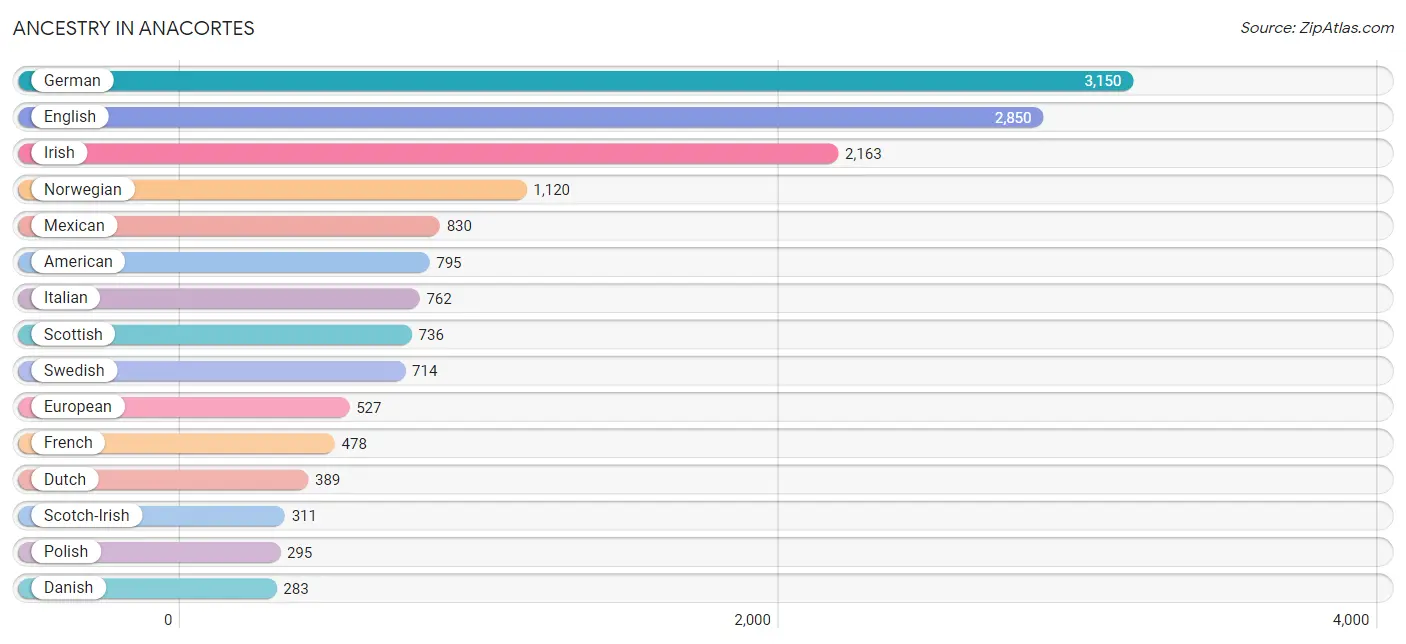
Ancestry in Anacortes
The most populous ancestries reported in Anacortes are German (3,150 | 17.8%), English (2,850 | 16.1%), Irish (2,163 | 12.2%), Norwegian (1,120 | 6.3%), and Mexican (830 | 4.7%), together accounting for 57.2% of all Anacortes residents.
| Ancestry | # Population | % Population |
| African | 6 | 0.0% |
| Alaska Native | 11 | 0.1% |
| Alaskan Athabascan | 2 | 0.0% |
| Albanian | 3 | 0.0% |
| Aleut | 19 | 0.1% |
| American | 795 | 4.5% |
| Arab | 21 | 0.1% |
| Argentinean | 8 | 0.1% |
| Armenian | 6 | 0.0% |
| Assyrian / Chaldean / Syriac | 7 | 0.0% |
| Australian | 12 | 0.1% |
| Austrian | 49 | 0.3% |
| Basque | 59 | 0.3% |
| Belgian | 40 | 0.2% |
| Bhutanese | 124 | 0.7% |
| Blackfeet | 13 | 0.1% |
| British | 218 | 1.2% |
| Bulgarian | 12 | 0.1% |
| Burmese | 85 | 0.5% |
| Canadian | 98 | 0.5% |
| Celtic | 16 | 0.1% |
| Central American | 74 | 0.4% |
| Cherokee | 76 | 0.4% |
| Cheyenne | 5 | 0.0% |
| Chickasaw | 8 | 0.1% |
| Chilean | 3 | 0.0% |
| Chippewa | 6 | 0.0% |
| Choctaw | 6 | 0.0% |
| Colombian | 4 | 0.0% |
| Colville | 19 | 0.1% |
| Cree | 4 | 0.0% |
| Creek | 4 | 0.0% |
| Croatian | 163 | 0.9% |
| Crow | 4 | 0.0% |
| Cuban | 90 | 0.5% |
| Czech | 84 | 0.5% |
| Czechoslovakian | 25 | 0.1% |
| Danish | 283 | 1.6% |
| Dominican | 1 | 0.0% |
| Dutch | 389 | 2.2% |
| Eastern European | 53 | 0.3% |
| Ecuadorian | 13 | 0.1% |
| English | 2,850 | 16.1% |
| Estonian | 5 | 0.0% |
| European | 527 | 3.0% |
| Fijian | 8 | 0.1% |
| Filipino | 10 | 0.1% |
| Finnish | 119 | 0.7% |
| French | 478 | 2.7% |
| French Canadian | 106 | 0.6% |
| German | 3,150 | 17.8% |
| Ghanaian | 2 | 0.0% |
| Greek | 59 | 0.3% |
| Guamanian / Chamorro | 5 | 0.0% |
| Guatemalan | 7 | 0.0% |
| Haitian | 1 | 0.0% |
| Honduran | 10 | 0.1% |
| Hungarian | 48 | 0.3% |
| Icelander | 34 | 0.2% |
| Indian (Asian) | 170 | 1.0% |
| Inupiat | 4 | 0.0% |
| Iranian | 25 | 0.1% |
| Irish | 2,163 | 12.2% |
| Iroquois | 13 | 0.1% |
| Italian | 762 | 4.3% |
| Japanese | 5 | 0.0% |
| Kenyan | 5 | 0.0% |
| Korean | 217 | 1.2% |
| Laotian | 15 | 0.1% |
| Latvian | 6 | 0.0% |
| Lebanese | 9 | 0.1% |
| Liberian | 3 | 0.0% |
| Lithuanian | 43 | 0.2% |
| Mexican | 830 | 4.7% |
| Mexican American Indian | 12 | 0.1% |
| Native Hawaiian | 52 | 0.3% |
| Navajo | 5 | 0.0% |
| New Zealander | 4 | 0.0% |
| Nicaraguan | 41 | 0.2% |
| Northern European | 191 | 1.1% |
| Norwegian | 1,120 | 6.3% |
| Okinawan | 2 | 0.0% |
| Pakistani | 18 | 0.1% |
| Panamanian | 11 | 0.1% |
| Pennsylvania German | 5 | 0.0% |
| Peruvian | 8 | 0.1% |
| Polish | 295 | 1.7% |
| Portuguese | 36 | 0.2% |
| Potawatomi | 13 | 0.1% |
| Puerto Rican | 48 | 0.3% |
| Puget Sound Salish | 28 | 0.2% |
| Romanian | 15 | 0.1% |
| Russian | 123 | 0.7% |
| Salvadoran | 5 | 0.0% |
| Samoan | 9 | 0.1% |
| Scandinavian | 216 | 1.2% |
| Scotch-Irish | 311 | 1.8% |
| Scottish | 736 | 4.2% |
| Serbian | 9 | 0.1% |
| Shoshone | 6 | 0.0% |
| Sioux | 6 | 0.0% |
| Slavic | 8 | 0.1% |
| Slovak | 27 | 0.2% |
| Slovene | 4 | 0.0% |
| South African | 7 | 0.0% |
| South American | 40 | 0.2% |
| Spaniard | 38 | 0.2% |
| Spanish | 38 | 0.2% |
| Sri Lankan | 26 | 0.2% |
| Subsaharan African | 25 | 0.1% |
| Swedish | 714 | 4.0% |
| Swiss | 112 | 0.6% |
| Syrian | 5 | 0.0% |
| Thai | 30 | 0.2% |
| Tlingit-Haida | 15 | 0.1% |
| Tsimshian | 8 | 0.1% |
| Turkish | 1 | 0.0% |
| Ukrainian | 25 | 0.1% |
| Venezuelan | 4 | 0.0% |
| Welsh | 217 | 1.2% |
| Yakama | 2 | 0.0% |
| Yaqui | 13 | 0.1% |
| Yugoslavian | 4 | 0.0% | View All 123 Rows |
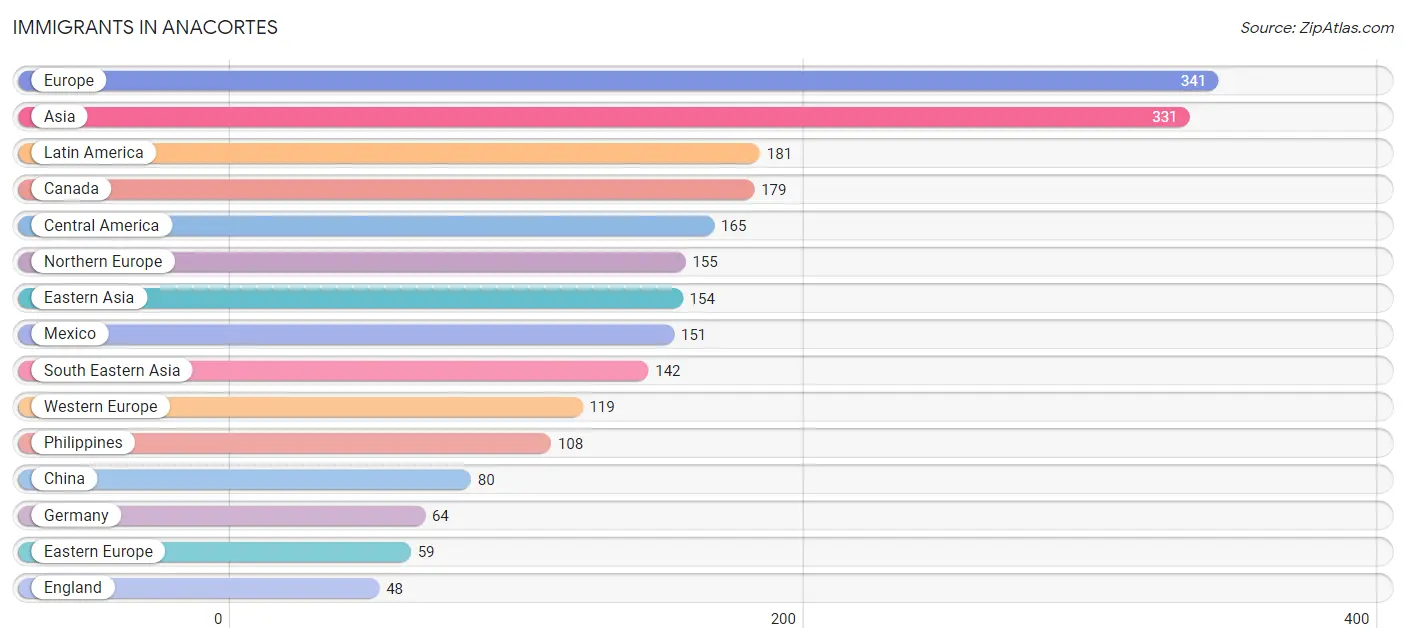
Immigrants in Anacortes
The most numerous immigrant groups reported in Anacortes came from Europe (341 | 1.9%), Asia (331 | 1.9%), Latin America (181 | 1.0%), Canada (179 | 1.0%), and Central America (165 | 0.9%), together accounting for 6.8% of all Anacortes residents.
| Immigration Origin | # Population | % Population |
| Africa | 23 | 0.1% |
| Argentina | 8 | 0.1% |
| Asia | 331 | 1.9% |
| Australia | 32 | 0.2% |
| Austria | 2 | 0.0% |
| Belarus | 8 | 0.1% |
| Belgium | 8 | 0.1% |
| Bulgaria | 3 | 0.0% |
| Canada | 179 | 1.0% |
| Caribbean | 4 | 0.0% |
| Central America | 165 | 0.9% |
| China | 80 | 0.4% |
| Cuba | 4 | 0.0% |
| Czechoslovakia | 6 | 0.0% |
| Denmark | 5 | 0.0% |
| Eastern Africa | 8 | 0.1% |
| Eastern Asia | 154 | 0.9% |
| Eastern Europe | 59 | 0.3% |
| El Salvador | 5 | 0.0% |
| England | 48 | 0.3% |
| Europe | 341 | 1.9% |
| France | 5 | 0.0% |
| Germany | 64 | 0.4% |
| Ghana | 2 | 0.0% |
| Greece | 3 | 0.0% |
| Guatemala | 7 | 0.0% |
| Honduras | 2 | 0.0% |
| Hong Kong | 35 | 0.2% |
| India | 19 | 0.1% |
| Iran | 10 | 0.1% |
| Ireland | 15 | 0.1% |
| Israel | 2 | 0.0% |
| Italy | 3 | 0.0% |
| Japan | 35 | 0.2% |
| Kenya | 8 | 0.1% |
| Korea | 39 | 0.2% |
| Latin America | 181 | 1.0% |
| Lebanon | 2 | 0.0% |
| Malaysia | 9 | 0.1% |
| Mexico | 151 | 0.9% |
| Morocco | 2 | 0.0% |
| Netherlands | 27 | 0.2% |
| Northern Africa | 2 | 0.0% |
| Northern Europe | 155 | 0.9% |
| Norway | 1 | 0.0% |
| Oceania | 38 | 0.2% |
| Philippines | 108 | 0.6% |
| Poland | 3 | 0.0% |
| Romania | 3 | 0.0% |
| Russia | 28 | 0.2% |
| Saudi Arabia | 2 | 0.0% |
| Scotland | 23 | 0.1% |
| Singapore | 2 | 0.0% |
| South Africa | 11 | 0.1% |
| South America | 12 | 0.1% |
| South Central Asia | 29 | 0.2% |
| South Eastern Asia | 142 | 0.8% |
| Southern Europe | 8 | 0.1% |
| Spain | 2 | 0.0% |
| Sweden | 7 | 0.0% |
| Switzerland | 13 | 0.1% |
| Taiwan | 14 | 0.1% |
| Thailand | 7 | 0.0% |
| Ukraine | 4 | 0.0% |
| Venezuela | 4 | 0.0% |
| Vietnam | 16 | 0.1% |
| Western Africa | 2 | 0.0% |
| Western Asia | 6 | 0.0% |
| Western Europe | 119 | 0.7% | View All 69 Rows |
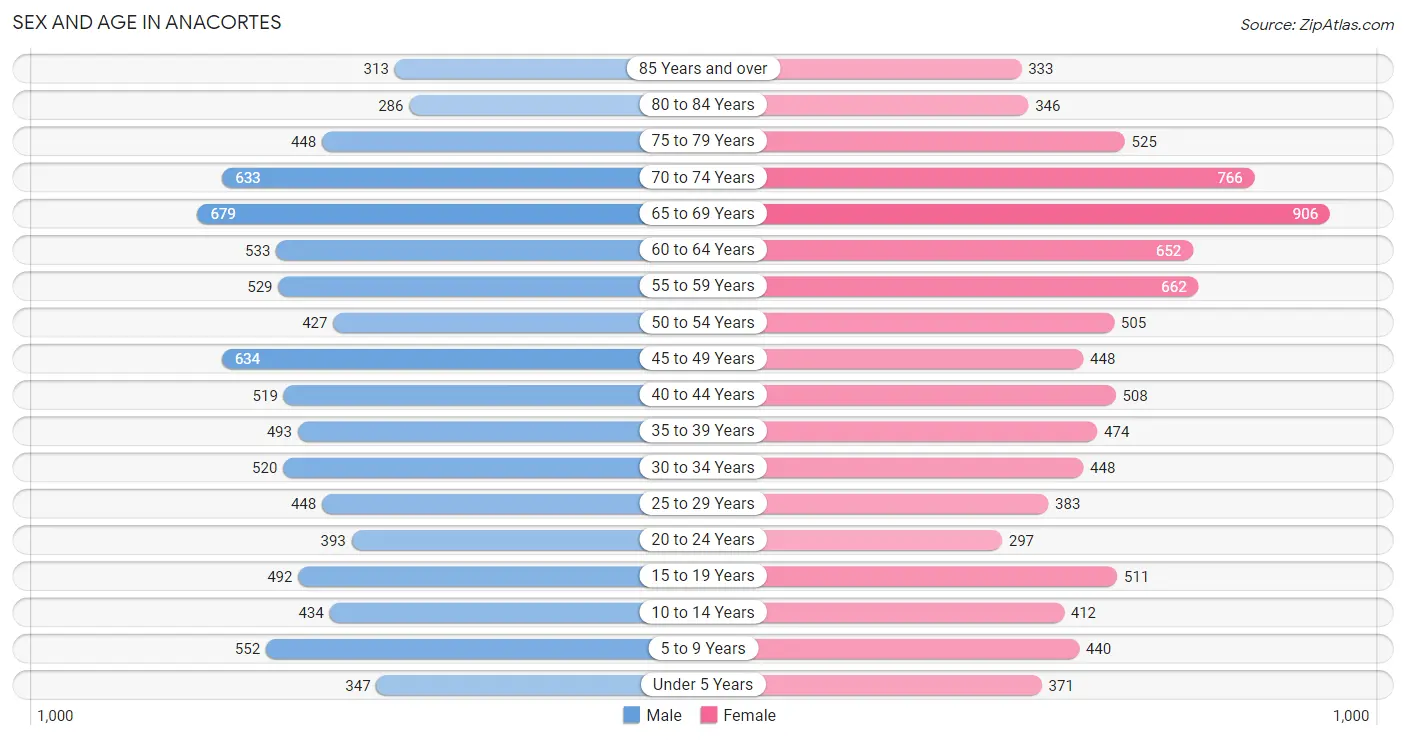
Sex and Age in Anacortes
Sex and Age in Anacortes
The most populous age groups in Anacortes are 65 to 69 Years (679 | 7.8%) for men and 65 to 69 Years (906 | 10.1%) for women.
| Age Bracket | Male | Female |
| Under 5 Years | 347 (4.0%) | 371 (4.1%) |
| 5 to 9 Years | 552 (6.4%) | 440 (4.9%) |
| 10 to 14 Years | 434 (5.0%) | 412 (4.6%) |
| 15 to 19 Years | 492 (5.7%) | 511 (5.7%) |
| 20 to 24 Years | 393 (4.5%) | 297 (3.3%) |
| 25 to 29 Years | 448 (5.2%) | 383 (4.3%) |
| 30 to 34 Years | 520 (6.0%) | 448 (5.0%) |
| 35 to 39 Years | 493 (5.7%) | 474 (5.3%) |
| 40 to 44 Years | 519 (6.0%) | 508 (5.7%) |
| 45 to 49 Years | 634 (7.3%) | 448 (5.0%) |
| 50 to 54 Years | 427 (4.9%) | 505 (5.6%) |
| 55 to 59 Years | 529 (6.1%) | 662 (7.4%) |
| 60 to 64 Years | 533 (6.1%) | 652 (7.2%) |
| 65 to 69 Years | 679 (7.8%) | 906 (10.1%) |
| 70 to 74 Years | 633 (7.3%) | 766 (8.5%) |
| 75 to 79 Years | 448 (5.2%) | 525 (5.8%) |
| 80 to 84 Years | 286 (3.3%) | 346 (3.8%) |
| 85 Years and over | 313 (3.6%) | 333 (3.7%) |
| Total | 8,680 (100.0%) | 8,987 (100.0%) |
Families and Households in Anacortes
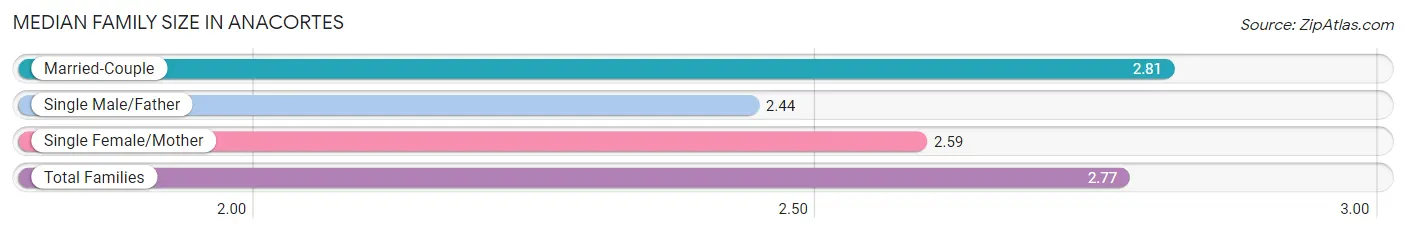
Median Family Size in Anacortes
The median family size in Anacortes is 2.77 persons per family, with married-couple families (4,098 | 83.7%) accounting for the largest median family size of 2.81 persons per family. On the other hand, single male/father families (207 | 4.2%) represent the smallest median family size with 2.44 persons per family.
| Family Type | # Families | Family Size |
| Married-Couple | 4,098 (83.7%) | 2.81 |
| Single Male/Father | 207 (4.2%) | 2.44 |
| Single Female/Mother | 591 (12.1%) | 2.59 |
| Total Families | 4,896 (100.0%) | 2.77 |
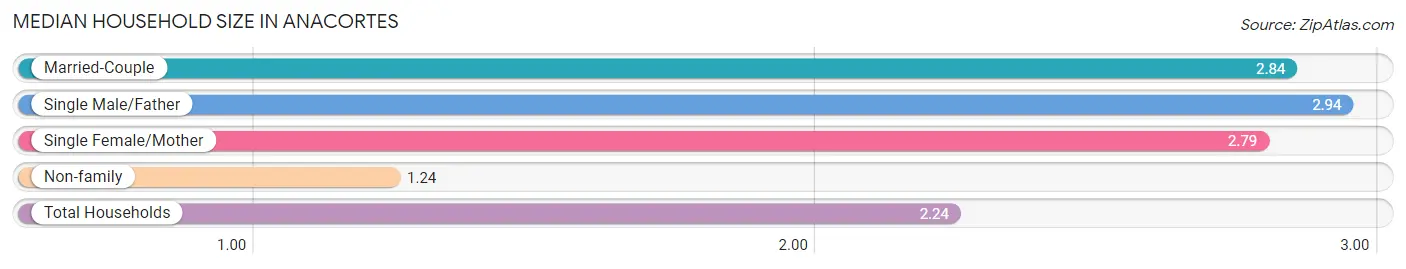
Median Household Size in Anacortes
The median household size in Anacortes is 2.24 persons per household, with single male/father households (207 | 2.6%) accounting for the largest median household size of 2.94 persons per household. non-family households (2,903 | 37.2%) represent the smallest median household size with 1.24 persons per household.
| Household Type | # Households | Household Size |
| Married-Couple | 4,098 (52.5%) | 2.84 |
| Single Male/Father | 207 (2.6%) | 2.94 |
| Single Female/Mother | 591 (7.6%) | 2.79 |
| Non-family | 2,903 (37.2%) | 1.24 |
| Total Households | 7,799 (100.0%) | 2.24 |
Household Size by Marriage Status in Anacortes
Out of a total of 7,799 households in Anacortes, 4,896 (62.8%) are family households, while 2,903 (37.2%) are nonfamily households. The most numerous type of family households are 2-person households, comprising 2,732, and the most common type of nonfamily households are 1-person households, comprising 2,350.
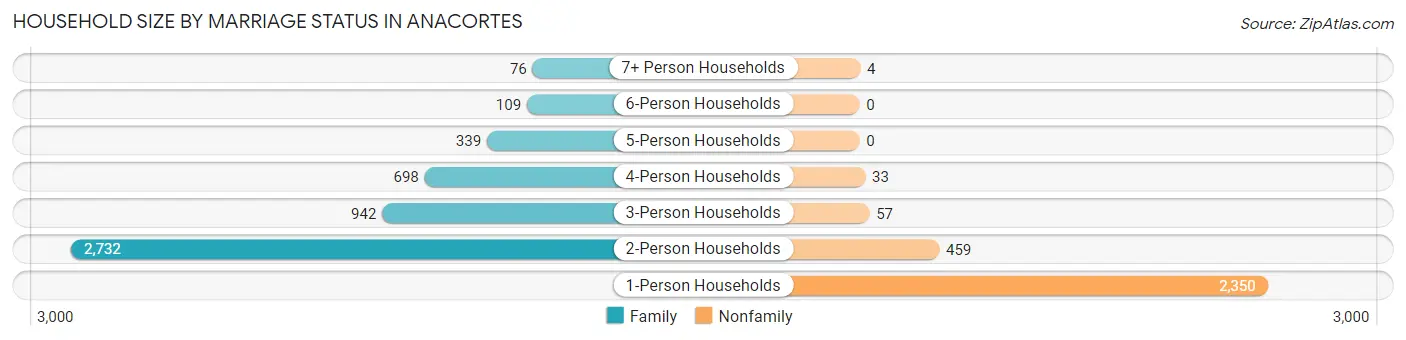
| Household Size | Family Households | Nonfamily Households |
| 1-Person Households | - | 2,350 (30.1%) |
| 2-Person Households | 2,732 (35.0%) | 459 (5.9%) |
| 3-Person Households | 942 (12.1%) | 57 (0.7%) |
| 4-Person Households | 698 (8.9%) | 33 (0.4%) |
| 5-Person Households | 339 (4.3%) | 0 (0.0%) |
| 6-Person Households | 109 (1.4%) | 0 (0.0%) |
| 7+ Person Households | 76 (1.0%) | 4 (0.1%) |
| Total | 4,896 (62.8%) | 2,903 (37.2%) |
Female Fertility in Anacortes
Fertility by Age in Anacortes
Average fertility rate in Anacortes is 44.0 births per 1,000 women. Women in the age bracket of 20 to 34 years have the highest fertility rate with 102.0 births per 1,000 women. Women in the age bracket of 20 to 34 years acount for 82.1% of all women with births.
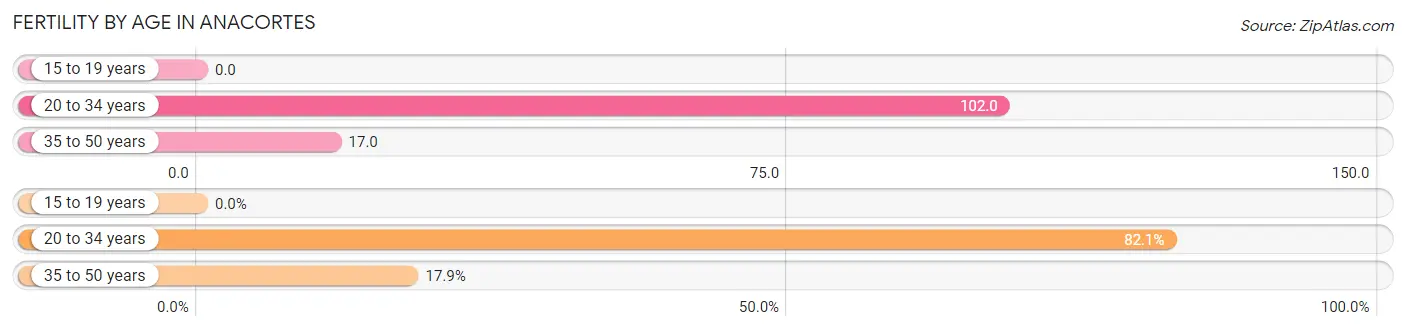
| Age Bracket | Women with Births | Births / 1,000 Women |
| 15 to 19 years | 0 (0.0%) | 0.0 |
| 20 to 34 years | 115 (82.1%) | 102.0 |
| 35 to 50 years | 25 (17.9%) | 17.0 |
| Total | 140 (100.0%) | 44.0 |
Fertility by Age by Marriage Status in Anacortes
84.3% of women with births (140) in Anacortes are married. The highest percentage of unmarried women with births falls into 35 to 50 years age bracket with 32.0% of them unmarried at the time of birth, while the lowest percentage of unmarried women with births belong to 20 to 34 years age bracket with 12.2% of them unmarried.
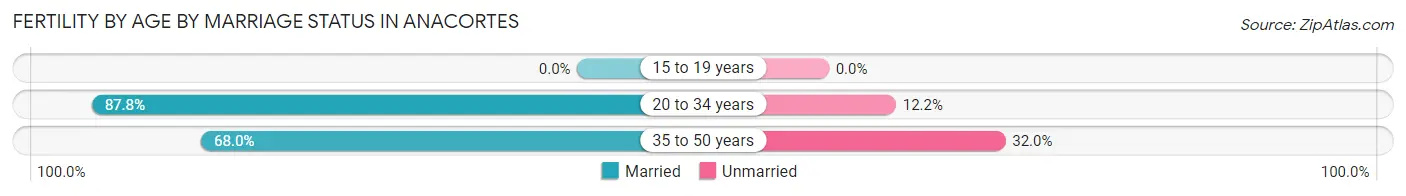
| Age Bracket | Married | Unmarried |
| 15 to 19 years | 0 (0.0%) | 0 (0.0%) |
| 20 to 34 years | 101 (87.8%) | 14 (12.2%) |
| 35 to 50 years | 17 (68.0%) | 8 (32.0%) |
| Total | 118 (84.3%) | 22 (15.7%) |
Fertility by Education in Anacortes
Average fertility rate in Anacortes is 44.0 births per 1,000 women. Women with the education attainment of bachelor's degree have the highest fertility rate of 66.0 births per 1,000 women, while women with the education attainment of less than high school have the lowest fertility at 14.0 births per 1,000 women. Women with the education attainment of bachelor's degree represent 35.7% of all women with births.
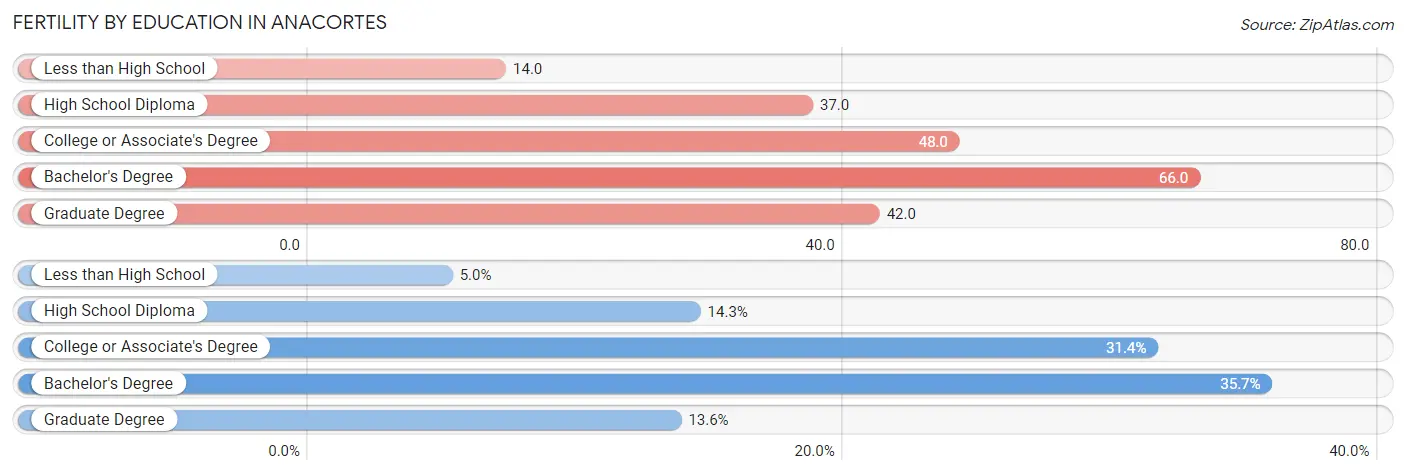
| Educational Attainment | Women with Births | Births / 1,000 Women |
| Less than High School | 7 (5.0%) | 14.0 |
| High School Diploma | 20 (14.3%) | 37.0 |
| College or Associate's Degree | 44 (31.4%) | 48.0 |
| Bachelor's Degree | 50 (35.7%) | 66.0 |
| Graduate Degree | 19 (13.6%) | 42.0 |
| Total | 140 (100.0%) | 44.0 |
Fertility by Education by Marriage Status in Anacortes
15.7% of women with births in Anacortes are unmarried. Women with the educational attainment of bachelor's degree are most likely to be married with 100.0% of them married at childbirth, while women with the educational attainment of less than high school are least likely to be married with 71.4% of them unmarried at childbirth.
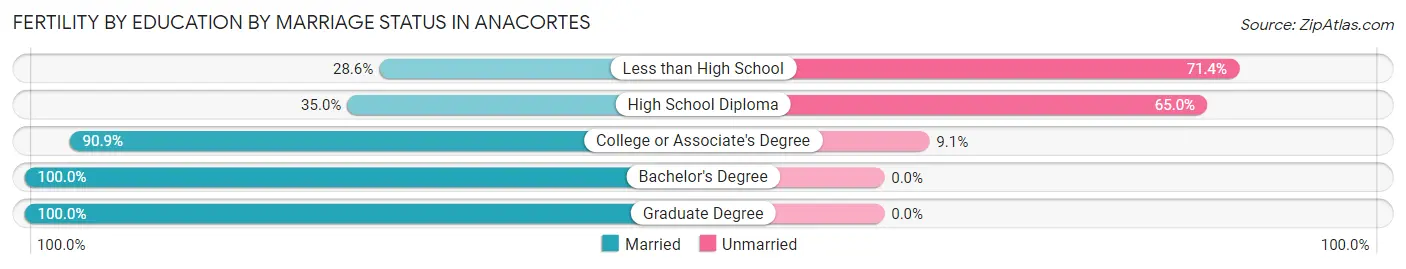
| Educational Attainment | Married | Unmarried |
| Less than High School | 2 (28.6%) | 5 (71.4%) |
| High School Diploma | 7 (35.0%) | 13 (65.0%) |
| College or Associate's Degree | 40 (90.9%) | 4 (9.1%) |
| Bachelor's Degree | 50 (100.0%) | 0 (0.0%) |
| Graduate Degree | 19 (100.0%) | 0 (0.0%) |
| Total | 118 (84.3%) | 22 (15.7%) |
Employment Characteristics in Anacortes
Employment by Class of Employer in Anacortes
Among the 7,487 employed individuals in Anacortes, private company employees (4,272 | 57.1%), local government employees (815 | 10.9%), and federal government employees (707 | 9.4%) make up the most common classes of employment.
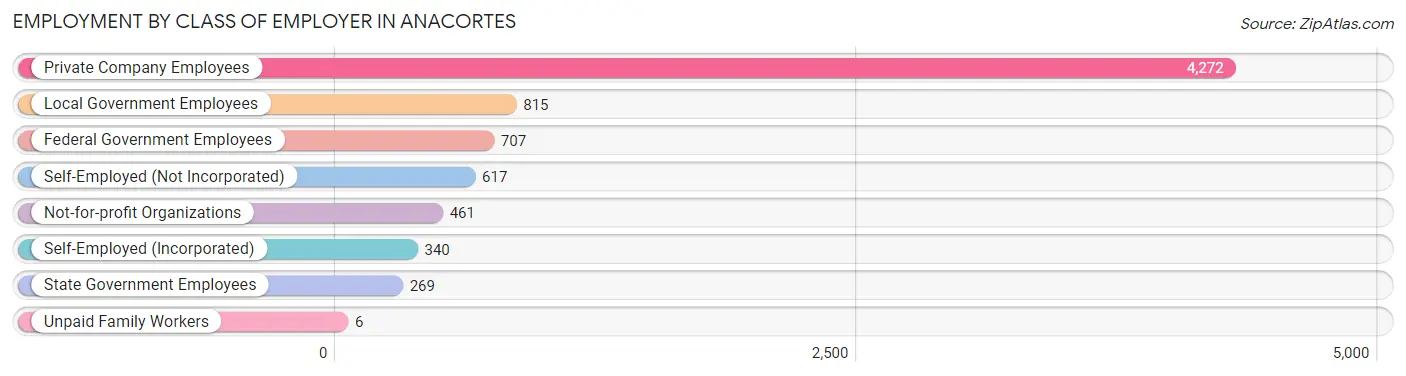
| Employer Class | # Employees | % Employees |
| Private Company Employees | 4,272 | 57.1% |
| Self-Employed (Incorporated) | 340 | 4.5% |
| Self-Employed (Not Incorporated) | 617 | 8.2% |
| Not-for-profit Organizations | 461 | 6.2% |
| Local Government Employees | 815 | 10.9% |
| State Government Employees | 269 | 3.6% |
| Federal Government Employees | 707 | 9.4% |
| Unpaid Family Workers | 6 | 0.1% |
| Total | 7,487 | 100.0% |
Employment Status by Age in Anacortes
According to the labor force statistics for Anacortes, out of the total population over 16 years of age (14,930), 53.2% or 7,943 individuals are in the labor force, with 4.2% or 334 of them unemployed. The age group with the highest labor force participation rate is 20 to 24 years, with 88.0% or 607 individuals in the labor force. Within the labor force, the 16 to 19 years age range has the highest percentage of unemployed individuals, with 17.8% or 61 of them being unemployed.
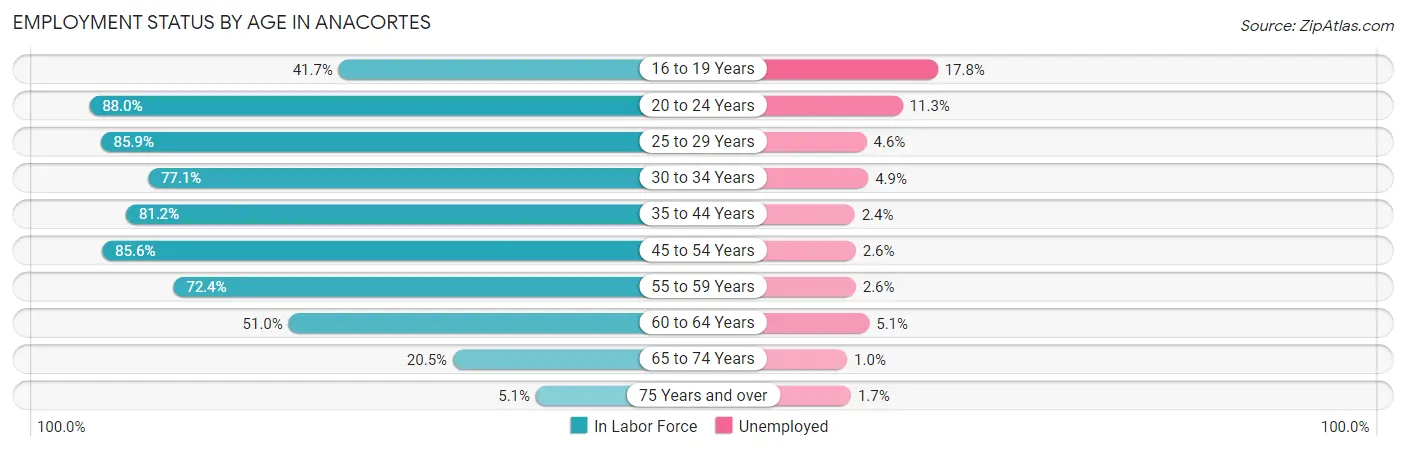
| Age Bracket | In Labor Force | Unemployed |
| 16 to 19 Years | 343 (41.7%) | 61 (17.8%) |
| 20 to 24 Years | 607 (88.0%) | 69 (11.3%) |
| 25 to 29 Years | 714 (85.9%) | 33 (4.6%) |
| 30 to 34 Years | 746 (77.1%) | 37 (4.9%) |
| 35 to 44 Years | 1,619 (81.2%) | 39 (2.4%) |
| 45 to 54 Years | 1,724 (85.6%) | 45 (2.6%) |
| 55 to 59 Years | 862 (72.4%) | 22 (2.6%) |
| 60 to 64 Years | 604 (51.0%) | 31 (5.1%) |
| 65 to 74 Years | 612 (20.5%) | 6 (1.0%) |
| 75 Years and over | 115 (5.1%) | 2 (1.7%) |
| Total | 7,943 (53.2%) | 334 (4.2%) |
Employment Status by Educational Attainment in Anacortes
According to labor force statistics for Anacortes, 76.6% of individuals (6,268) out of the total population between 25 and 64 years of age (8,183) are in the labor force, with 3.2% or 201 of them being unemployed. The group with the highest labor force participation rate are those with the educational attainment of bachelor's degree or higher, with 80.7% or 2,938 individuals in the labor force. Within the labor force, individuals with less than high school education have the highest percentage of unemployment, with 8.2% or 21 of them being unemployed.
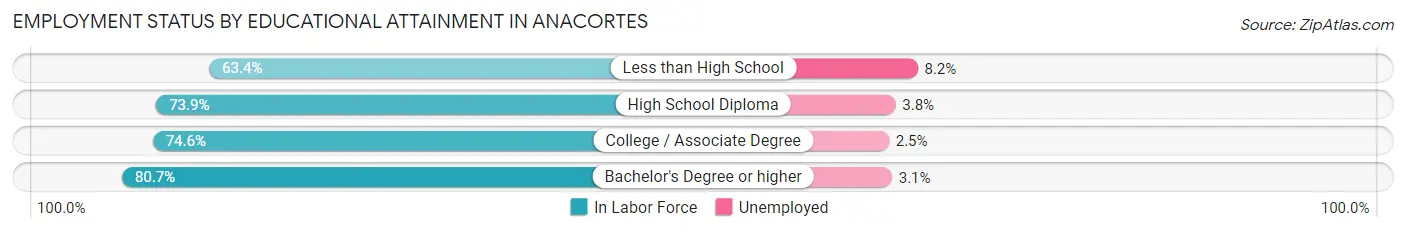
| Educational Attainment | In Labor Force | Unemployed |
| Less than High School | 255 (63.4%) | 33 (8.2%) |
| High School Diploma | 1,075 (73.9%) | 55 (3.8%) |
| College / Associate Degree | 2,004 (74.6%) | 67 (2.5%) |
| Bachelor's Degree or higher | 2,938 (80.7%) | 113 (3.1%) |
| Total | 6,268 (76.6%) | 262 (3.2%) |
Employment Occupations by Sex in Anacortes
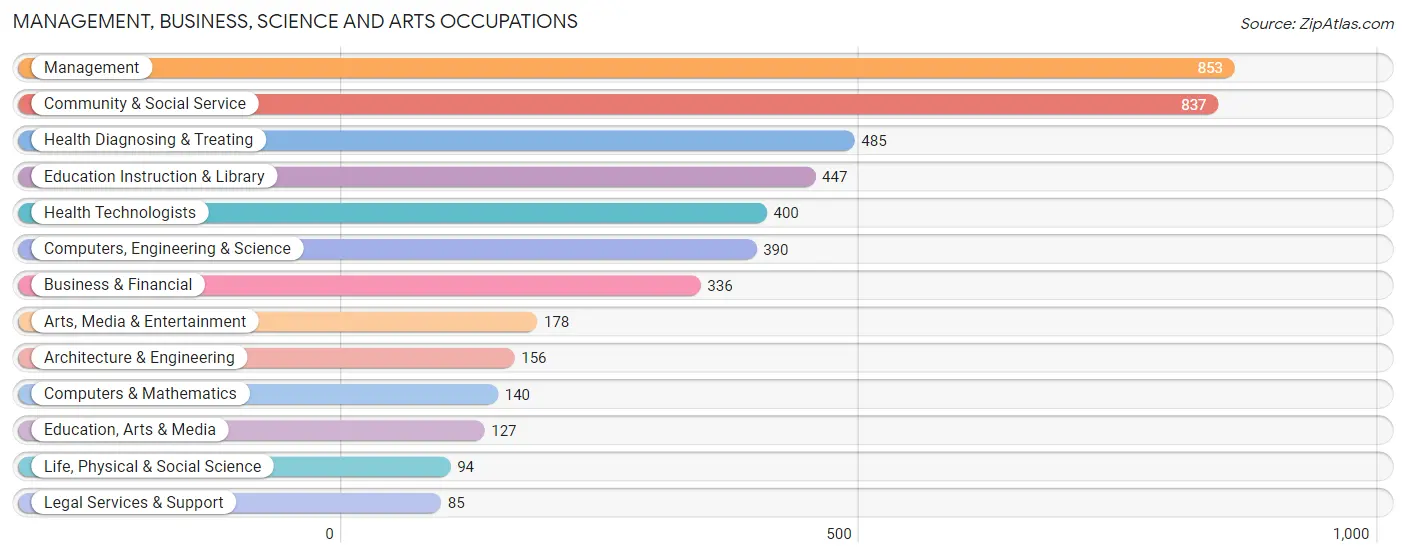
Management, Business, Science and Arts Occupations
The most common Management, Business, Science and Arts occupations in Anacortes are Management (853 | 12.0%), Community & Social Service (837 | 11.8%), Health Diagnosing & Treating (485 | 6.8%), Education Instruction & Library (447 | 6.3%), and Health Technologists (400 | 5.6%).
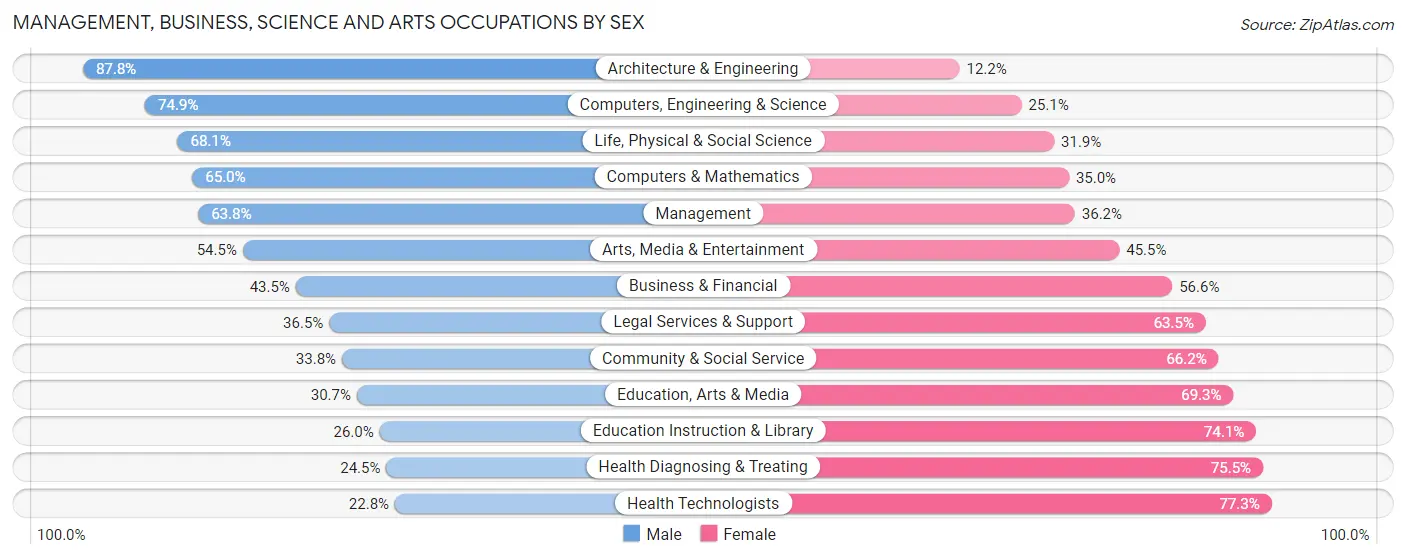
Management, Business, Science and Arts Occupations by Sex
Within the Management, Business, Science and Arts occupations in Anacortes, the most male-oriented occupations are Architecture & Engineering (87.8%), Computers, Engineering & Science (74.9%), and Life, Physical & Social Science (68.1%), while the most female-oriented occupations are Health Technologists (77.2%), Health Diagnosing & Treating (75.5%), and Education Instruction & Library (74.1%).
| Occupation | Male | Female |
| Management | 544 (63.8%) | 309 (36.2%) |
| Business & Financial | 146 (43.4%) | 190 (56.6%) |
| Computers, Engineering & Science | 292 (74.9%) | 98 (25.1%) |
| Computers & Mathematics | 91 (65.0%) | 49 (35.0%) |
| Architecture & Engineering | 137 (87.8%) | 19 (12.2%) |
| Life, Physical & Social Science | 64 (68.1%) | 30 (31.9%) |
| Community & Social Service | 283 (33.8%) | 554 (66.2%) |
| Education, Arts & Media | 39 (30.7%) | 88 (69.3%) |
| Legal Services & Support | 31 (36.5%) | 54 (63.5%) |
| Education Instruction & Library | 116 (26.0%) | 331 (74.1%) |
| Arts, Media & Entertainment | 97 (54.5%) | 81 (45.5%) |
| Health Diagnosing & Treating | 119 (24.5%) | 366 (75.5%) |
| Health Technologists | 91 (22.8%) | 309 (77.2%) |
| Total (Category) | 1,384 (47.7%) | 1,517 (52.3%) |
| Total (Overall) | 3,799 (53.4%) | 3,319 (46.6%) |
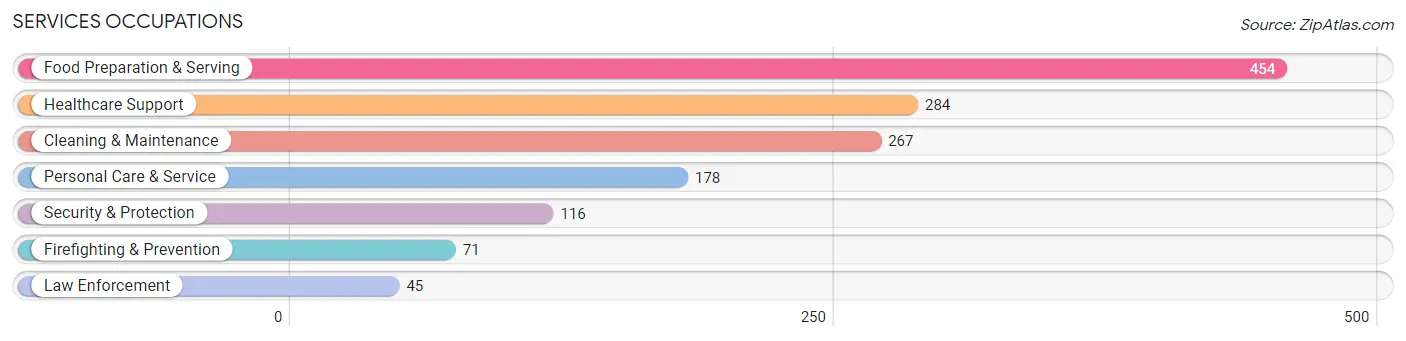
Services Occupations
The most common Services occupations in Anacortes are Food Preparation & Serving (454 | 6.4%), Healthcare Support (284 | 4.0%), Cleaning & Maintenance (267 | 3.7%), Personal Care & Service (178 | 2.5%), and Security & Protection (116 | 1.6%).
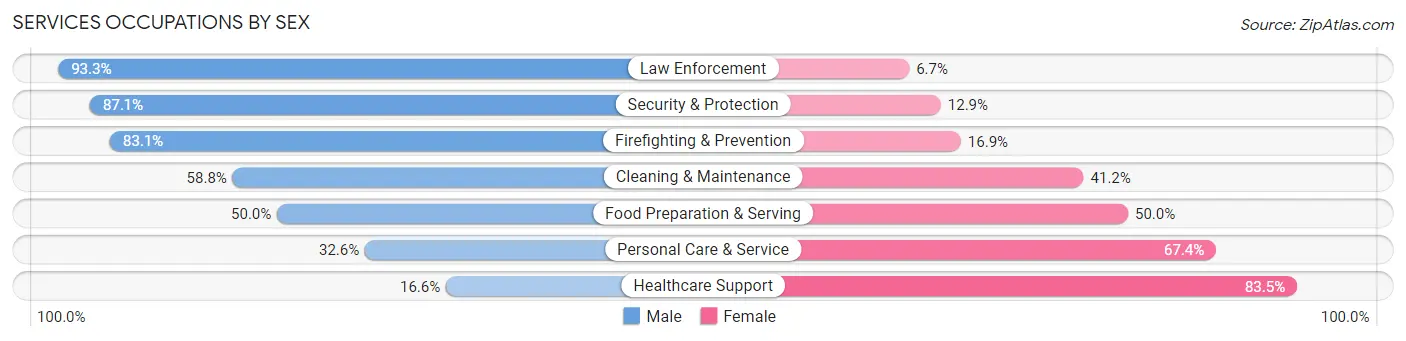
Services Occupations by Sex
Within the Services occupations in Anacortes, the most male-oriented occupations are Law Enforcement (93.3%), Security & Protection (87.1%), and Firefighting & Prevention (83.1%), while the most female-oriented occupations are Healthcare Support (83.5%), Personal Care & Service (67.4%), and Food Preparation & Serving (50.0%).
| Occupation | Male | Female |
| Healthcare Support | 47 (16.6%) | 237 (83.5%) |
| Security & Protection | 101 (87.1%) | 15 (12.9%) |
| Firefighting & Prevention | 59 (83.1%) | 12 (16.9%) |
| Law Enforcement | 42 (93.3%) | 3 (6.7%) |
| Food Preparation & Serving | 227 (50.0%) | 227 (50.0%) |
| Cleaning & Maintenance | 157 (58.8%) | 110 (41.2%) |
| Personal Care & Service | 58 (32.6%) | 120 (67.4%) |
| Total (Category) | 590 (45.4%) | 709 (54.6%) |
| Total (Overall) | 3,799 (53.4%) | 3,319 (46.6%) |
Sales and Office Occupations
The most common Sales and Office occupations in Anacortes are Office & Administration (675 | 9.5%), and Sales & Related (633 | 8.9%).
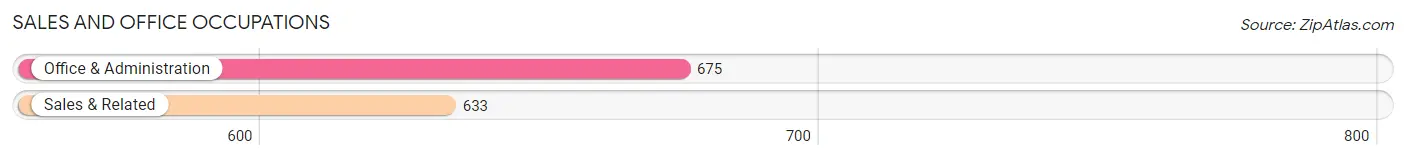
Sales and Office Occupations by Sex
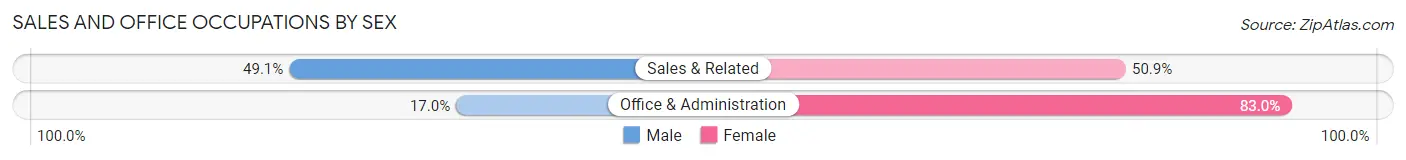
| Occupation | Male | Female |
| Sales & Related | 311 (49.1%) | 322 (50.9%) |
| Office & Administration | 115 (17.0%) | 560 (83.0%) |
| Total (Category) | 426 (32.6%) | 882 (67.4%) |
| Total (Overall) | 3,799 (53.4%) | 3,319 (46.6%) |
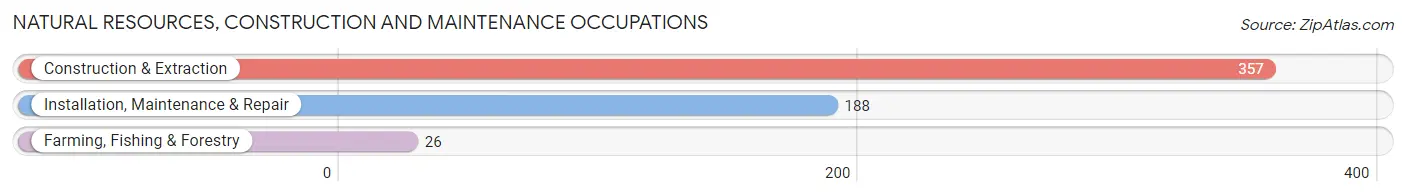
Natural Resources, Construction and Maintenance Occupations
The most common Natural Resources, Construction and Maintenance occupations in Anacortes are Construction & Extraction (357 | 5.0%), Installation, Maintenance & Repair (188 | 2.6%), and Farming, Fishing & Forestry (26 | 0.4%).
Natural Resources, Construction and Maintenance Occupations by Sex
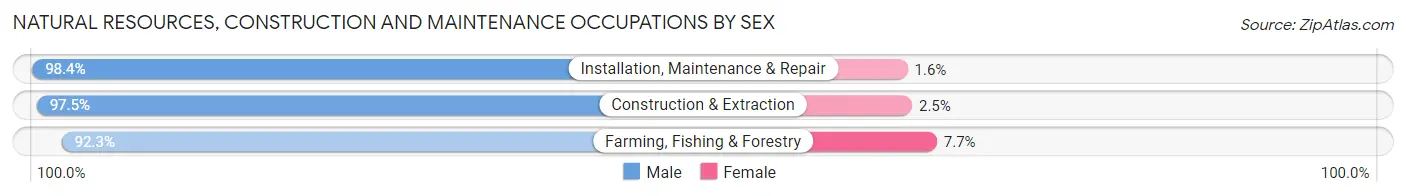
| Occupation | Male | Female |
| Farming, Fishing & Forestry | 24 (92.3%) | 2 (7.7%) |
| Construction & Extraction | 348 (97.5%) | 9 (2.5%) |
| Installation, Maintenance & Repair | 185 (98.4%) | 3 (1.6%) |
| Total (Category) | 557 (97.6%) | 14 (2.5%) |
| Total (Overall) | 3,799 (53.4%) | 3,319 (46.6%) |
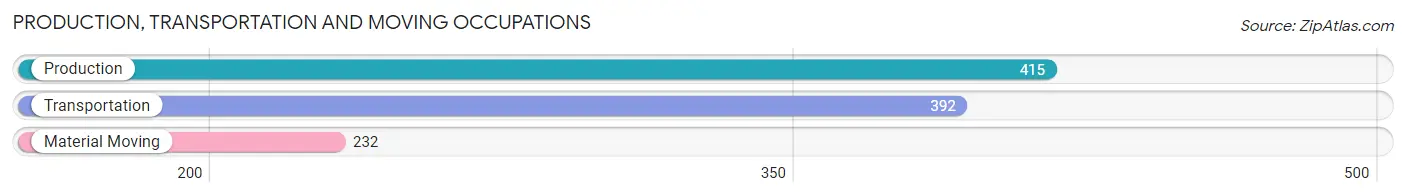
Production, Transportation and Moving Occupations
The most common Production, Transportation and Moving occupations in Anacortes are Production (415 | 5.8%), Transportation (392 | 5.5%), and Material Moving (232 | 3.3%).
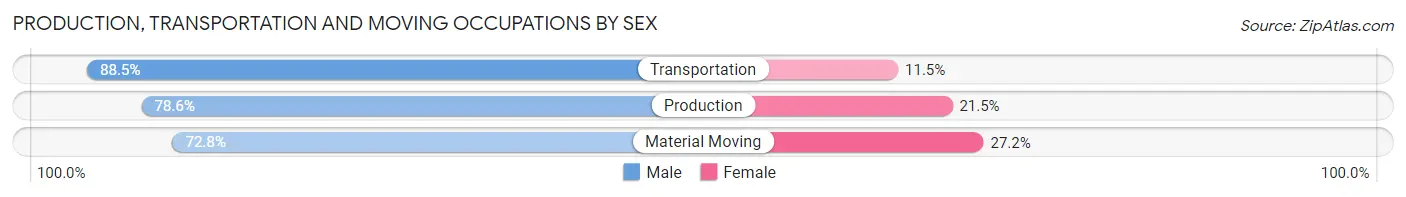
Production, Transportation and Moving Occupations by Sex
| Occupation | Male | Female |
| Production | 326 (78.5%) | 89 (21.4%) |
| Transportation | 347 (88.5%) | 45 (11.5%) |
| Material Moving | 169 (72.8%) | 63 (27.2%) |
| Total (Category) | 842 (81.0%) | 197 (19.0%) |
| Total (Overall) | 3,799 (53.4%) | 3,319 (46.6%) |
Employment Industries by Sex in Anacortes
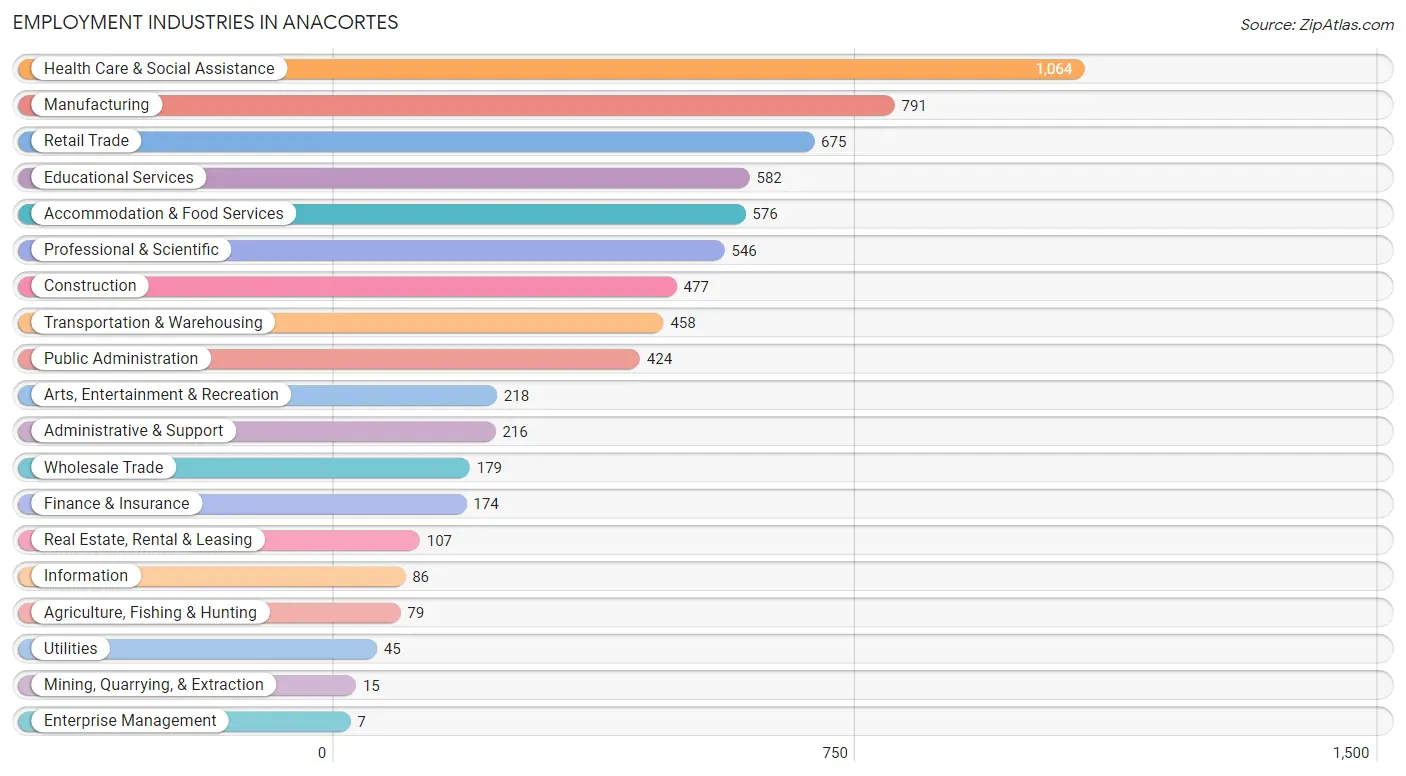
Employment Industries in Anacortes
The major employment industries in Anacortes include Health Care & Social Assistance (1,064 | 14.9%), Manufacturing (791 | 11.1%), Retail Trade (675 | 9.5%), Educational Services (582 | 8.2%), and Accommodation & Food Services (576 | 8.1%).
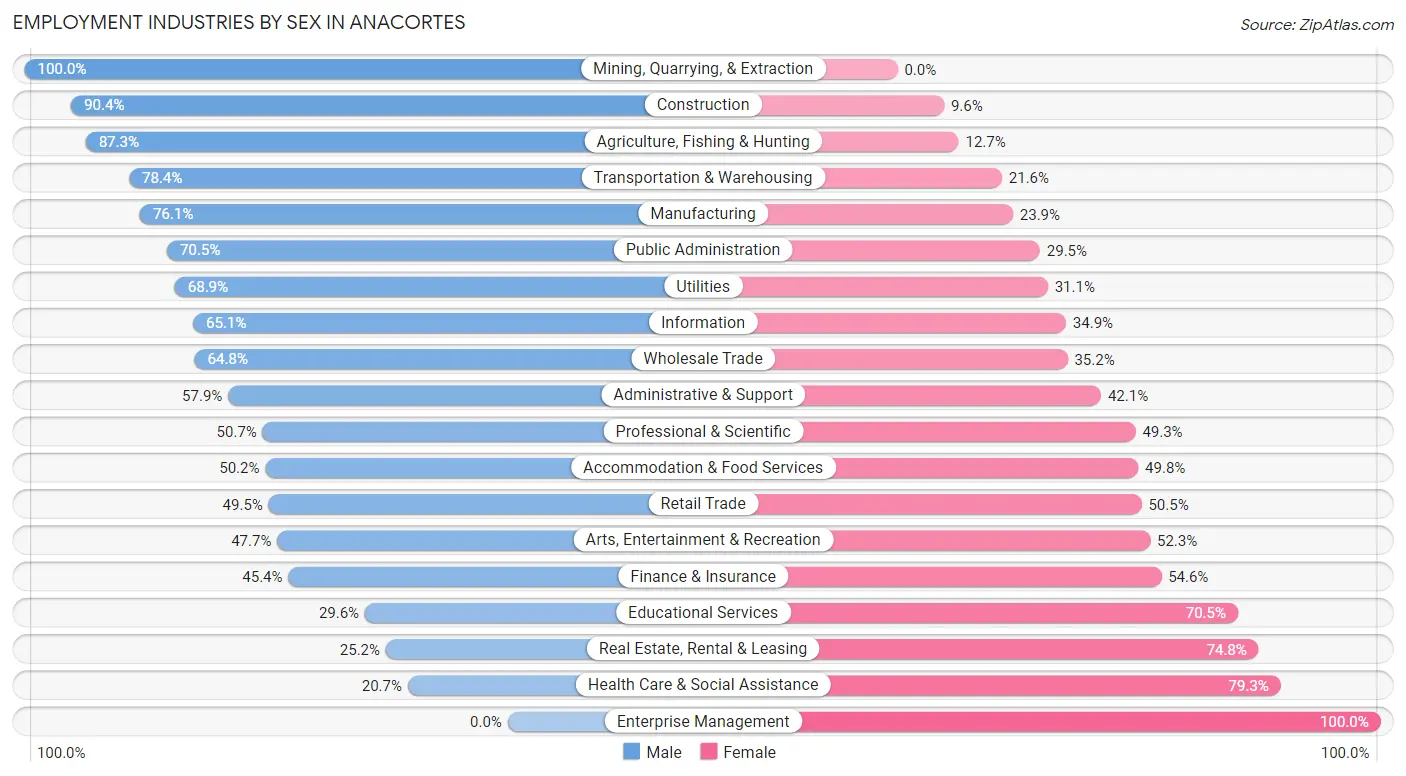
Employment Industries by Sex in Anacortes
The Anacortes industries that see more men than women are Mining, Quarrying, & Extraction (100.0%), Construction (90.4%), and Agriculture, Fishing & Hunting (87.3%), whereas the industries that tend to have a higher number of women are Enterprise Management (100.0%), Health Care & Social Assistance (79.3%), and Real Estate, Rental & Leasing (74.8%).
| Industry | Male | Female |
| Agriculture, Fishing & Hunting | 69 (87.3%) | 10 (12.7%) |
| Mining, Quarrying, & Extraction | 15 (100.0%) | 0 (0.0%) |
| Construction | 431 (90.4%) | 46 (9.6%) |
| Manufacturing | 602 (76.1%) | 189 (23.9%) |
| Wholesale Trade | 116 (64.8%) | 63 (35.2%) |
| Retail Trade | 334 (49.5%) | 341 (50.5%) |
| Transportation & Warehousing | 359 (78.4%) | 99 (21.6%) |
| Utilities | 31 (68.9%) | 14 (31.1%) |
| Information | 56 (65.1%) | 30 (34.9%) |
| Finance & Insurance | 79 (45.4%) | 95 (54.6%) |
| Real Estate, Rental & Leasing | 27 (25.2%) | 80 (74.8%) |
| Professional & Scientific | 277 (50.7%) | 269 (49.3%) |
| Enterprise Management | 0 (0.0%) | 7 (100.0%) |
| Administrative & Support | 125 (57.9%) | 91 (42.1%) |
| Educational Services | 172 (29.5%) | 410 (70.5%) |
| Health Care & Social Assistance | 220 (20.7%) | 844 (79.3%) |
| Arts, Entertainment & Recreation | 104 (47.7%) | 114 (52.3%) |
| Accommodation & Food Services | 289 (50.2%) | 287 (49.8%) |
| Public Administration | 299 (70.5%) | 125 (29.5%) |
| Total | 3,799 (53.4%) | 3,319 (46.6%) |
Education in Anacortes
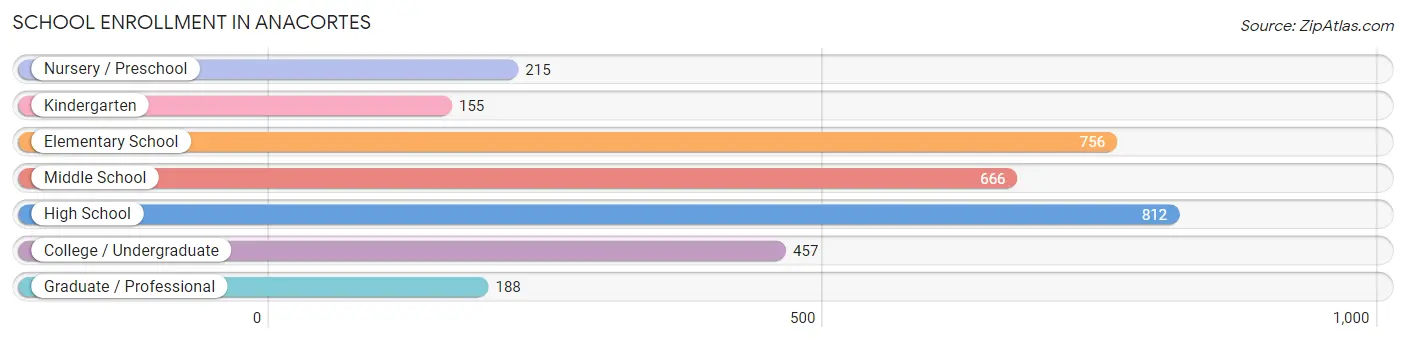
School Enrollment in Anacortes
The most common levels of schooling among the 3,249 students in Anacortes are high school (812 | 25.0%), elementary school (756 | 23.3%), and middle school (666 | 20.5%).
| School Level | # Students | % Students |
| Nursery / Preschool | 215 | 6.6% |
| Kindergarten | 155 | 4.8% |
| Elementary School | 756 | 23.3% |
| Middle School | 666 | 20.5% |
| High School | 812 | 25.0% |
| College / Undergraduate | 457 | 14.1% |
| Graduate / Professional | 188 | 5.8% |
| Total | 3,249 | 100.0% |
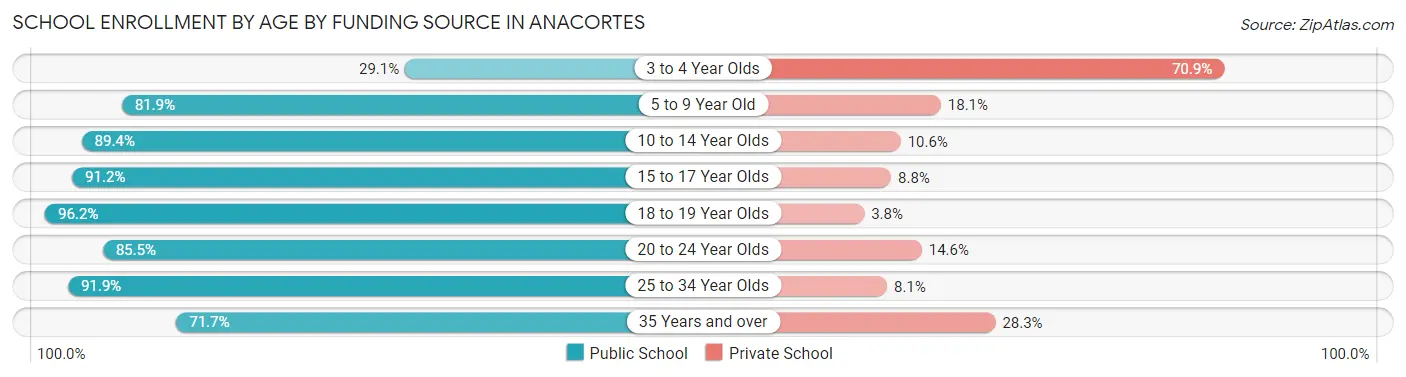
School Enrollment by Age by Funding Source in Anacortes
Out of a total of 3,249 students who are enrolled in schools in Anacortes, 510 (15.7%) attend a private institution, while the remaining 2,739 (84.3%) are enrolled in public schools. The age group of 3 to 4 year olds has the highest likelihood of being enrolled in private schools, with 90 (70.9% in the age bracket) enrolled. Conversely, the age group of 18 to 19 year olds has the lowest likelihood of being enrolled in a private school, with 252 (96.2% in the age bracket) attending a public institution.
| Age Bracket | Public School | Private School |
| 3 to 4 Year Olds | 37 (29.1%) | 90 (70.9%) |
| 5 to 9 Year Old | 751 (81.9%) | 166 (18.1%) |
| 10 to 14 Year Olds | 724 (89.4%) | 86 (10.6%) |
| 15 to 17 Year Olds | 526 (91.2%) | 51 (8.8%) |
| 18 to 19 Year Olds | 252 (96.2%) | 10 (3.8%) |
| 20 to 24 Year Olds | 188 (85.5%) | 32 (14.5%) |
| 25 to 34 Year Olds | 91 (91.9%) | 8 (8.1%) |
| 35 Years and over | 170 (71.7%) | 67 (28.3%) |
| Total | 2,739 (84.3%) | 510 (15.7%) |
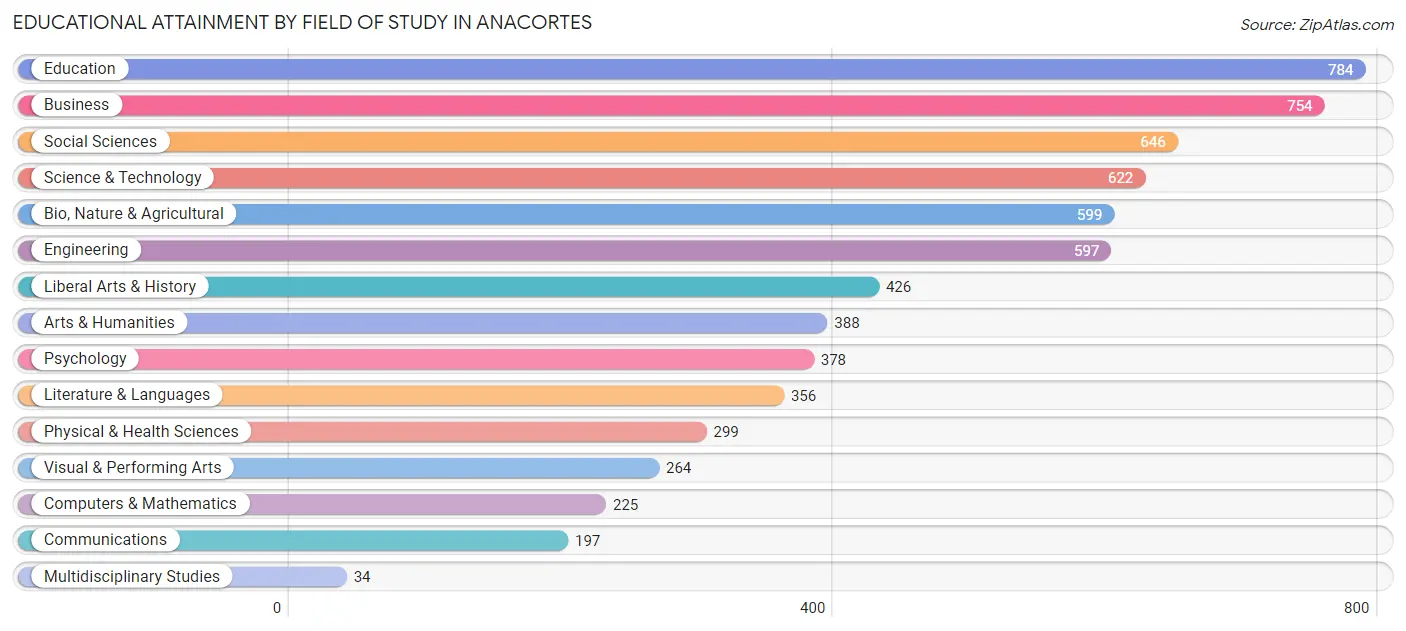
Educational Attainment by Field of Study in Anacortes
Education (784 | 11.9%), business (754 | 11.5%), social sciences (646 | 9.8%), science & technology (622 | 9.5%), and bio, nature & agricultural (599 | 9.1%) are the most common fields of study among 6,569 individuals in Anacortes who have obtained a bachelor's degree or higher.
| Field of Study | # Graduates | % Graduates |
| Computers & Mathematics | 225 | 3.4% |
| Bio, Nature & Agricultural | 599 | 9.1% |
| Physical & Health Sciences | 299 | 4.5% |
| Psychology | 378 | 5.8% |
| Social Sciences | 646 | 9.8% |
| Engineering | 597 | 9.1% |
| Multidisciplinary Studies | 34 | 0.5% |
| Science & Technology | 622 | 9.5% |
| Business | 754 | 11.5% |
| Education | 784 | 11.9% |
| Literature & Languages | 356 | 5.4% |
| Liberal Arts & History | 426 | 6.5% |
| Visual & Performing Arts | 264 | 4.0% |
| Communications | 197 | 3.0% |
| Arts & Humanities | 388 | 5.9% |
| Total | 6,569 | 100.0% |
Transportation & Commute in Anacortes
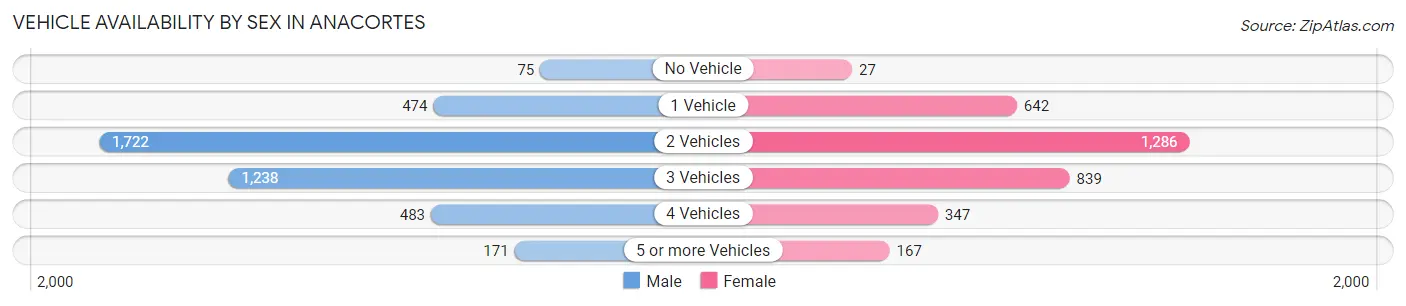
Vehicle Availability by Sex in Anacortes
The most prevalent vehicle ownership categories in Anacortes are males with 2 vehicles (1,722, accounting for 41.4%) and females with 2 vehicles (1,286, making up 52.1%).
| Vehicles Available | Male | Female |
| No Vehicle | 75 (1.8%) | 27 (0.8%) |
| 1 Vehicle | 474 (11.4%) | 642 (19.4%) |
| 2 Vehicles | 1,722 (41.4%) | 1,286 (38.9%) |
| 3 Vehicles | 1,238 (29.7%) | 839 (25.4%) |
| 4 Vehicles | 483 (11.6%) | 347 (10.5%) |
| 5 or more Vehicles | 171 (4.1%) | 167 (5.1%) |
| Total | 4,163 (100.0%) | 3,308 (100.0%) |
Commute Time in Anacortes
The most frequently occuring commute durations in Anacortes are 5 to 9 minutes (1,310 commuters, 20.2%), 10 to 14 minutes (1,073 commuters, 16.6%), and 30 to 34 minutes (873 commuters, 13.5%).
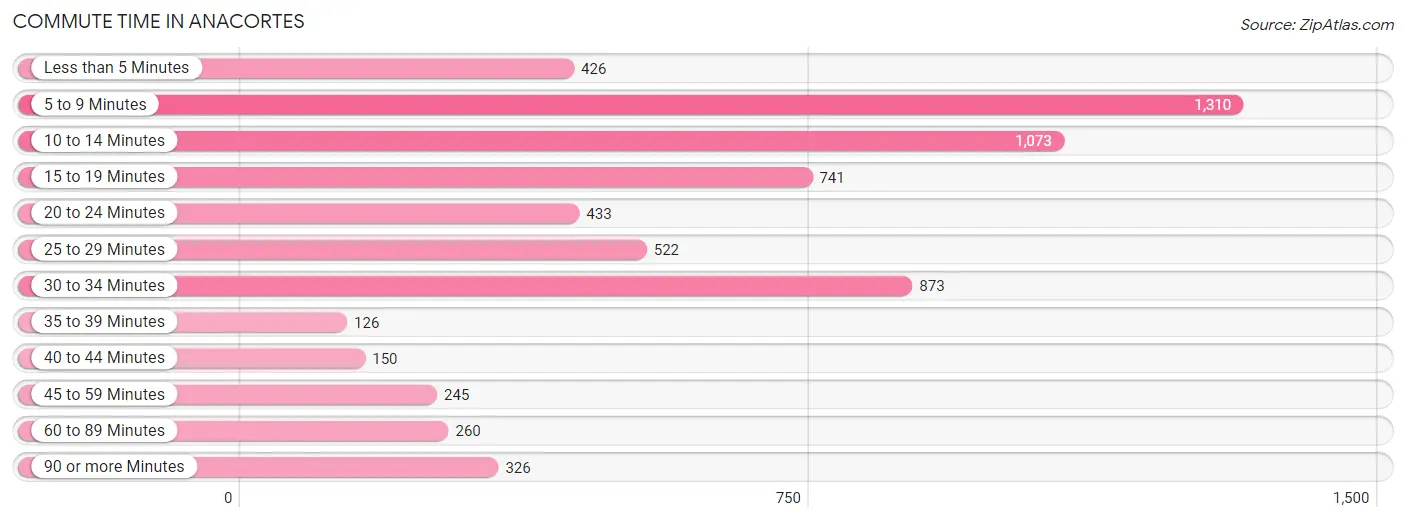
| Commute Time | # Commuters | % Commuters |
| Less than 5 Minutes | 426 | 6.6% |
| 5 to 9 Minutes | 1,310 | 20.2% |
| 10 to 14 Minutes | 1,073 | 16.6% |
| 15 to 19 Minutes | 741 | 11.4% |
| 20 to 24 Minutes | 433 | 6.7% |
| 25 to 29 Minutes | 522 | 8.1% |
| 30 to 34 Minutes | 873 | 13.5% |
| 35 to 39 Minutes | 126 | 1.9% |
| 40 to 44 Minutes | 150 | 2.3% |
| 45 to 59 Minutes | 245 | 3.8% |
| 60 to 89 Minutes | 260 | 4.0% |
| 90 or more Minutes | 326 | 5.0% |
Commute Time by Sex in Anacortes
The most common commute times in Anacortes are 30 to 34 minutes (587 commuters, 15.9%) for males and 5 to 9 minutes (747 commuters, 26.7%) for females.
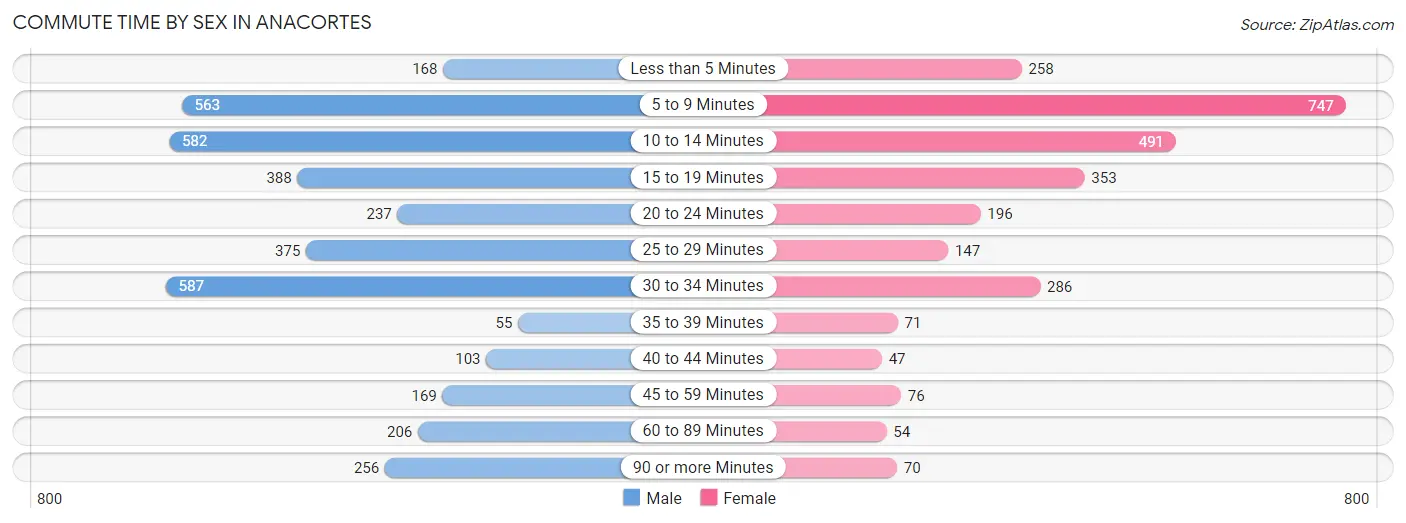
| Commute Time | Male | Female |
| Less than 5 Minutes | 168 (4.5%) | 258 (9.2%) |
| 5 to 9 Minutes | 563 (15.3%) | 747 (26.7%) |
| 10 to 14 Minutes | 582 (15.8%) | 491 (17.6%) |
| 15 to 19 Minutes | 388 (10.5%) | 353 (12.6%) |
| 20 to 24 Minutes | 237 (6.4%) | 196 (7.0%) |
| 25 to 29 Minutes | 375 (10.2%) | 147 (5.3%) |
| 30 to 34 Minutes | 587 (15.9%) | 286 (10.2%) |
| 35 to 39 Minutes | 55 (1.5%) | 71 (2.5%) |
| 40 to 44 Minutes | 103 (2.8%) | 47 (1.7%) |
| 45 to 59 Minutes | 169 (4.6%) | 76 (2.7%) |
| 60 to 89 Minutes | 206 (5.6%) | 54 (1.9%) |
| 90 or more Minutes | 256 (6.9%) | 70 (2.5%) |
Time of Departure to Work by Sex in Anacortes
The most frequent times of departure to work in Anacortes are 7:00 AM to 7:29 AM (587, 15.9%) for males and 7:30 AM to 7:59 AM (396, 14.2%) for females.
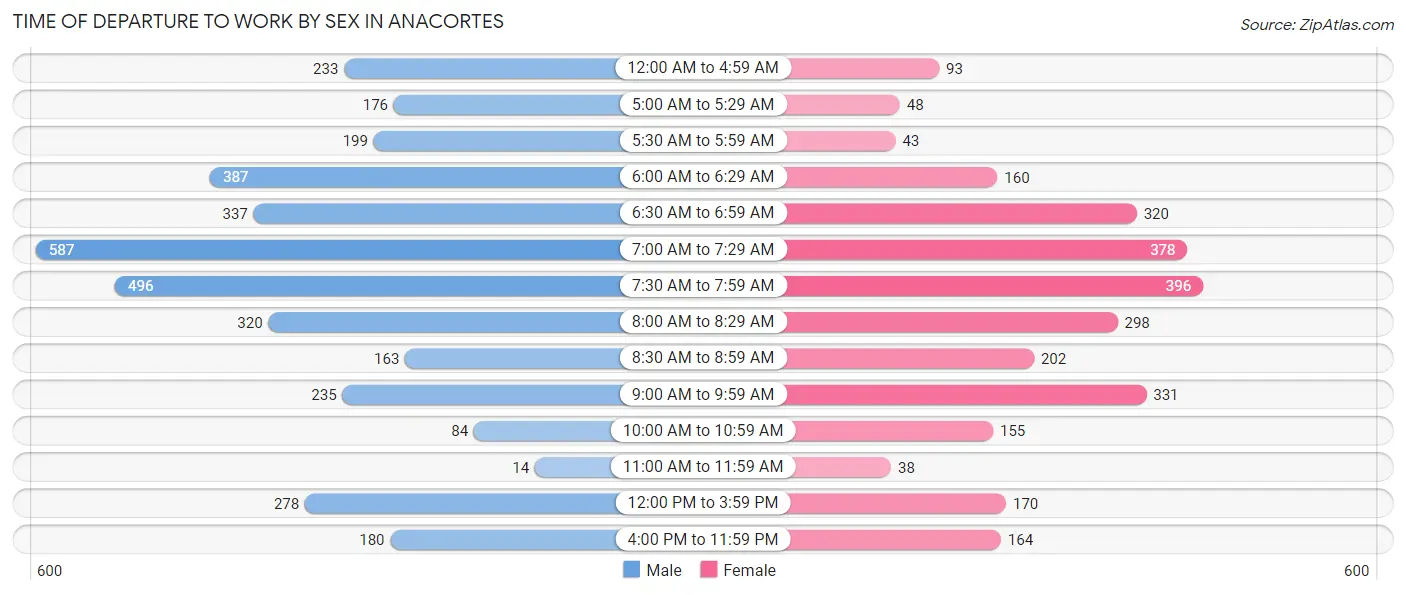
| Time of Departure | Male | Female |
| 12:00 AM to 4:59 AM | 233 (6.3%) | 93 (3.3%) |
| 5:00 AM to 5:29 AM | 176 (4.8%) | 48 (1.7%) |
| 5:30 AM to 5:59 AM | 199 (5.4%) | 43 (1.5%) |
| 6:00 AM to 6:29 AM | 387 (10.5%) | 160 (5.7%) |
| 6:30 AM to 6:59 AM | 337 (9.1%) | 320 (11.4%) |
| 7:00 AM to 7:29 AM | 587 (15.9%) | 378 (13.5%) |
| 7:30 AM to 7:59 AM | 496 (13.5%) | 396 (14.2%) |
| 8:00 AM to 8:29 AM | 320 (8.7%) | 298 (10.7%) |
| 8:30 AM to 8:59 AM | 163 (4.4%) | 202 (7.2%) |
| 9:00 AM to 9:59 AM | 235 (6.4%) | 331 (11.8%) |
| 10:00 AM to 10:59 AM | 84 (2.3%) | 155 (5.5%) |
| 11:00 AM to 11:59 AM | 14 (0.4%) | 38 (1.4%) |
| 12:00 PM to 3:59 PM | 278 (7.5%) | 170 (6.1%) |
| 4:00 PM to 11:59 PM | 180 (4.9%) | 164 (5.9%) |
| Total | 3,689 (100.0%) | 2,796 (100.0%) |
Housing Occupancy in Anacortes
Occupancy by Ownership in Anacortes
Of the total 7,799 dwellings in Anacortes, owner-occupied units account for 5,345 (68.5%), while renter-occupied units make up 2,454 (31.5%).
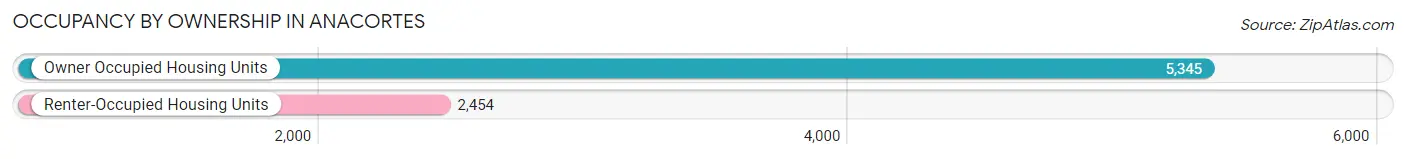
| Occupancy | # Housing Units | % Housing Units |
| Owner Occupied Housing Units | 5,345 | 68.5% |
| Renter-Occupied Housing Units | 2,454 | 31.5% |
| Total Occupied Housing Units | 7,799 | 100.0% |
Occupancy by Household Size in Anacortes
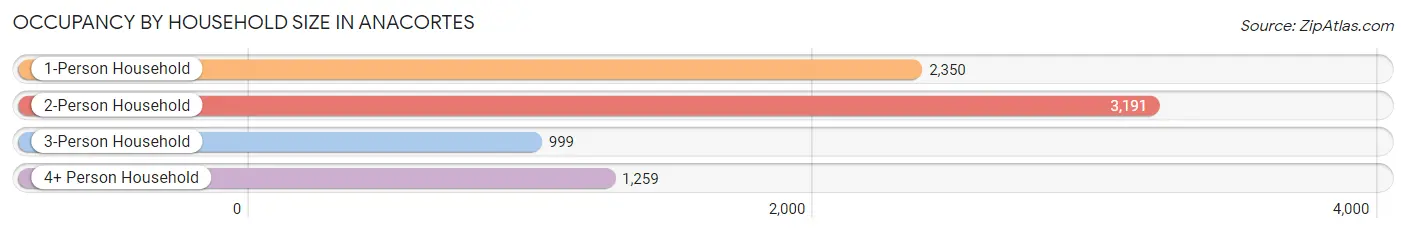
| Household Size | # Housing Units | % Housing Units |
| 1-Person Household | 2,350 | 30.1% |
| 2-Person Household | 3,191 | 40.9% |
| 3-Person Household | 999 | 12.8% |
| 4+ Person Household | 1,259 | 16.1% |
| Total Housing Units | 7,799 | 100.0% |
Occupancy by Ownership by Household Size in Anacortes
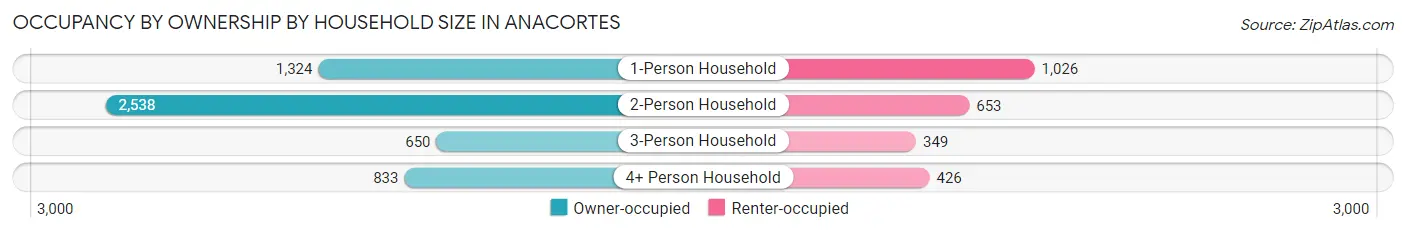
| Household Size | Owner-occupied | Renter-occupied |
| 1-Person Household | 1,324 (56.3%) | 1,026 (43.7%) |
| 2-Person Household | 2,538 (79.5%) | 653 (20.5%) |
| 3-Person Household | 650 (65.1%) | 349 (34.9%) |
| 4+ Person Household | 833 (66.2%) | 426 (33.8%) |
| Total Housing Units | 5,345 (68.5%) | 2,454 (31.5%) |
Occupancy by Educational Attainment in Anacortes
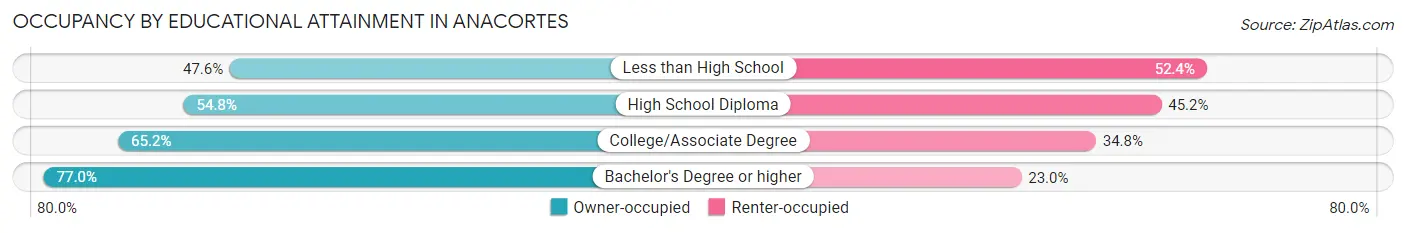
| Household Size | Owner-occupied | Renter-occupied |
| Less than High School | 137 (47.6%) | 151 (52.4%) |
| High School Diploma | 676 (54.8%) | 558 (45.2%) |
| College/Associate Degree | 1,653 (65.2%) | 884 (34.8%) |
| Bachelor's Degree or higher | 2,879 (77.0%) | 861 (23.0%) |
Occupancy by Age of Householder in Anacortes
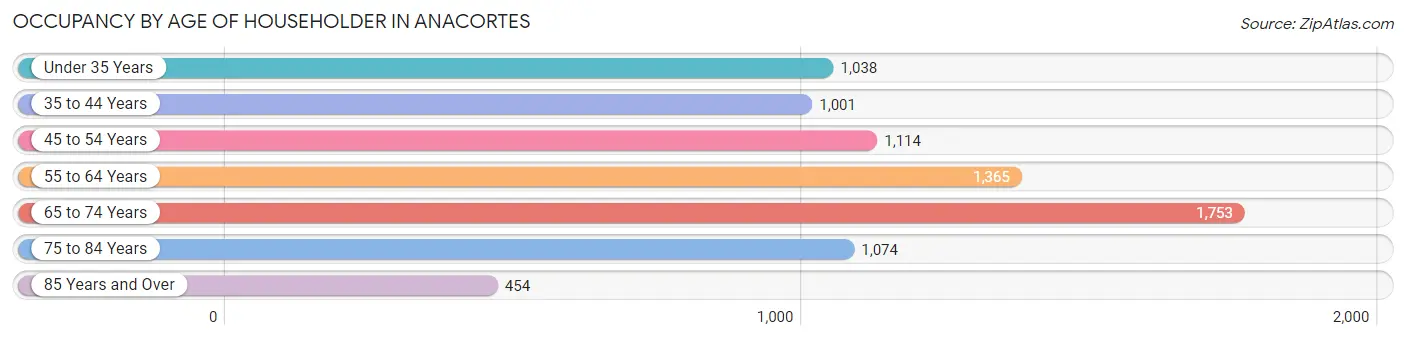
| Age Bracket | # Households | % Households |
| Under 35 Years | 1,038 | 13.3% |
| 35 to 44 Years | 1,001 | 12.8% |
| 45 to 54 Years | 1,114 | 14.3% |
| 55 to 64 Years | 1,365 | 17.5% |
| 65 to 74 Years | 1,753 | 22.5% |
| 75 to 84 Years | 1,074 | 13.8% |
| 85 Years and Over | 454 | 5.8% |
| Total | 7,799 | 100.0% |
Housing Finances in Anacortes
Median Income by Occupancy in Anacortes
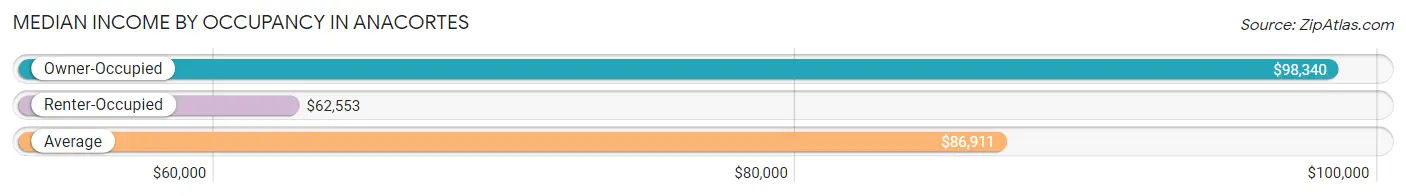
| Occupancy Type | # Households | Median Income |
| Owner-Occupied | 5,345 (68.5%) | $98,340 |
| Renter-Occupied | 2,454 (31.5%) | $62,553 |
| Average | 7,799 (100.0%) | $86,911 |
Occupancy by Householder Income Bracket in Anacortes
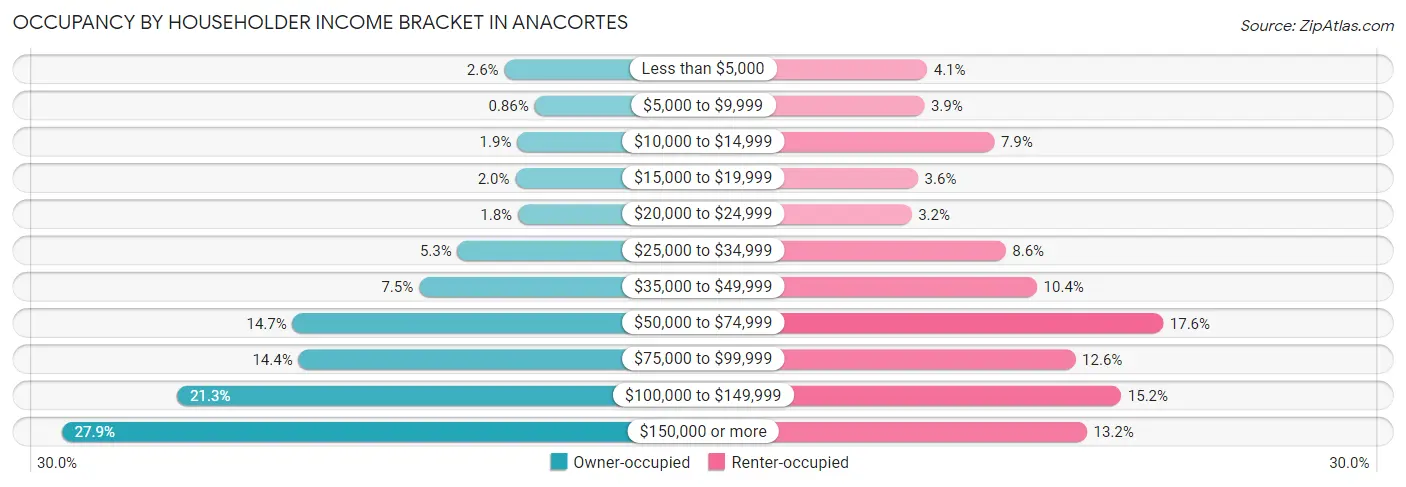
| Income Bracket | Owner-occupied | Renter-occupied |
| Less than $5,000 | 138 (2.6%) | 100 (4.1%) |
| $5,000 to $9,999 | 46 (0.9%) | 96 (3.9%) |
| $10,000 to $14,999 | 99 (1.8%) | 194 (7.9%) |
| $15,000 to $19,999 | 105 (2.0%) | 87 (3.5%) |
| $20,000 to $24,999 | 97 (1.8%) | 78 (3.2%) |
| $25,000 to $34,999 | 281 (5.3%) | 210 (8.6%) |
| $35,000 to $49,999 | 399 (7.5%) | 254 (10.3%) |
| $50,000 to $74,999 | 785 (14.7%) | 431 (17.6%) |
| $75,000 to $99,999 | 767 (14.3%) | 308 (12.6%) |
| $100,000 to $149,999 | 1,138 (21.3%) | 372 (15.2%) |
| $150,000 or more | 1,490 (27.9%) | 324 (13.2%) |
| Total | 5,345 (100.0%) | 2,454 (100.0%) |
Monthly Housing Cost Tiers in Anacortes
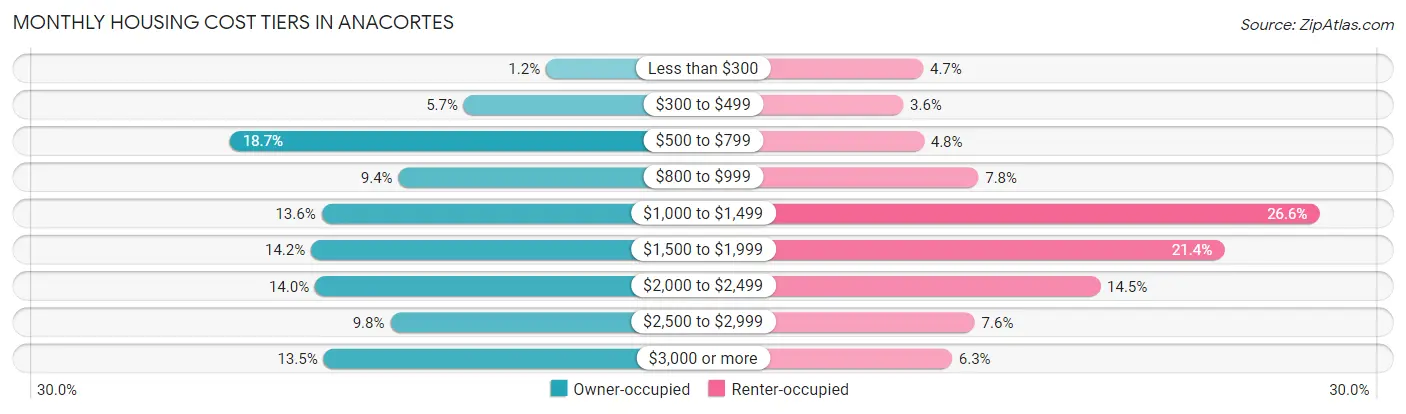
| Monthly Cost | Owner-occupied | Renter-occupied |
| Less than $300 | 64 (1.2%) | 116 (4.7%) |
| $300 to $499 | 307 (5.7%) | 89 (3.6%) |
| $500 to $799 | 998 (18.7%) | 117 (4.8%) |
| $800 to $999 | 500 (9.3%) | 191 (7.8%) |
| $1,000 to $1,499 | 727 (13.6%) | 653 (26.6%) |
| $1,500 to $1,999 | 758 (14.2%) | 524 (21.3%) |
| $2,000 to $2,499 | 746 (14.0%) | 356 (14.5%) |
| $2,500 to $2,999 | 524 (9.8%) | 186 (7.6%) |
| $3,000 or more | 721 (13.5%) | 155 (6.3%) |
| Total | 5,345 (100.0%) | 2,454 (100.0%) |
Physical Housing Characteristics in Anacortes
Housing Structures in Anacortes
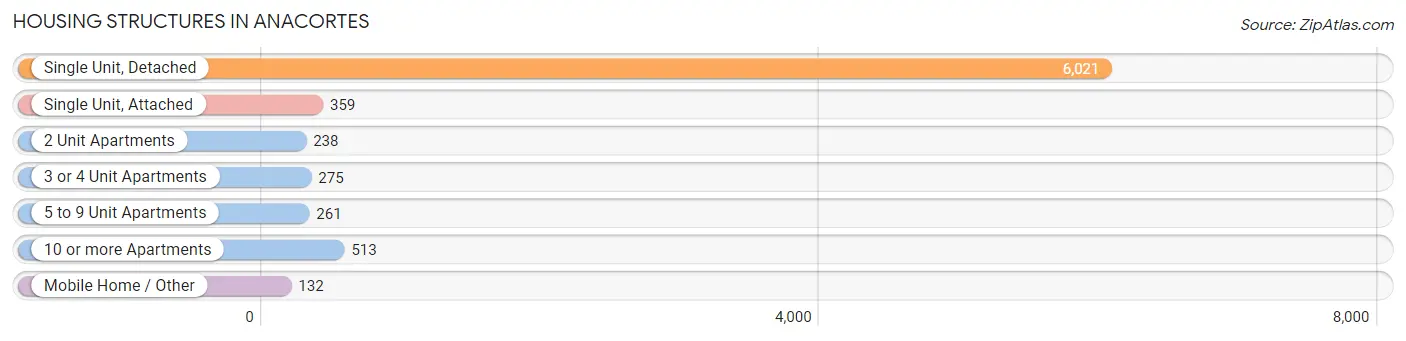
| Structure Type | # Housing Units | % Housing Units |
| Single Unit, Detached | 6,021 | 77.2% |
| Single Unit, Attached | 359 | 4.6% |
| 2 Unit Apartments | 238 | 3.0% |
| 3 or 4 Unit Apartments | 275 | 3.5% |
| 5 to 9 Unit Apartments | 261 | 3.4% |
| 10 or more Apartments | 513 | 6.6% |
| Mobile Home / Other | 132 | 1.7% |
| Total | 7,799 | 100.0% |
Housing Structures by Occupancy in Anacortes
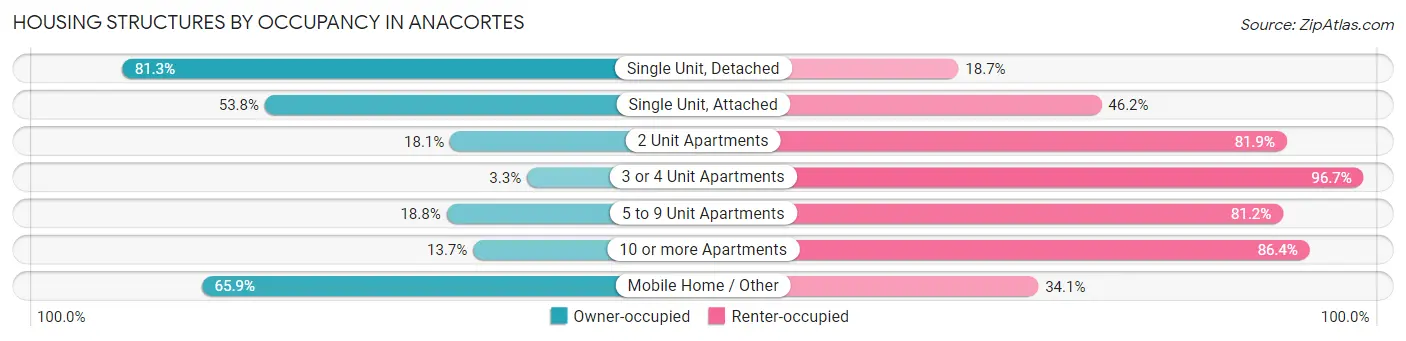
| Structure Type | Owner-occupied | Renter-occupied |
| Single Unit, Detached | 4,894 (81.3%) | 1,127 (18.7%) |
| Single Unit, Attached | 193 (53.8%) | 166 (46.2%) |
| 2 Unit Apartments | 43 (18.1%) | 195 (81.9%) |
| 3 or 4 Unit Apartments | 9 (3.3%) | 266 (96.7%) |
| 5 to 9 Unit Apartments | 49 (18.8%) | 212 (81.2%) |
| 10 or more Apartments | 70 (13.7%) | 443 (86.4%) |
| Mobile Home / Other | 87 (65.9%) | 45 (34.1%) |
| Total | 5,345 (68.5%) | 2,454 (31.5%) |
Housing Structures by Number of Rooms in Anacortes
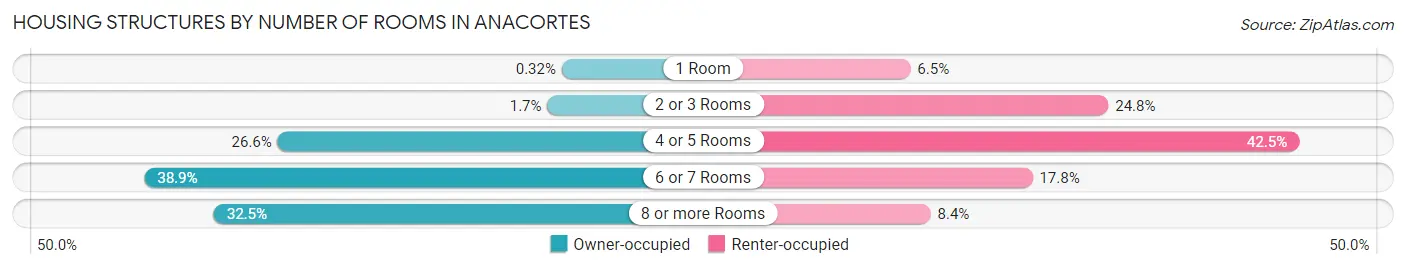
| Number of Rooms | Owner-occupied | Renter-occupied |
| 1 Room | 17 (0.3%) | 160 (6.5%) |
| 2 or 3 Rooms | 88 (1.7%) | 609 (24.8%) |
| 4 or 5 Rooms | 1,422 (26.6%) | 1,042 (42.5%) |
| 6 or 7 Rooms | 2,081 (38.9%) | 437 (17.8%) |
| 8 or more Rooms | 1,737 (32.5%) | 206 (8.4%) |
| Total | 5,345 (100.0%) | 2,454 (100.0%) |
Housing Structure by Heating Type in Anacortes
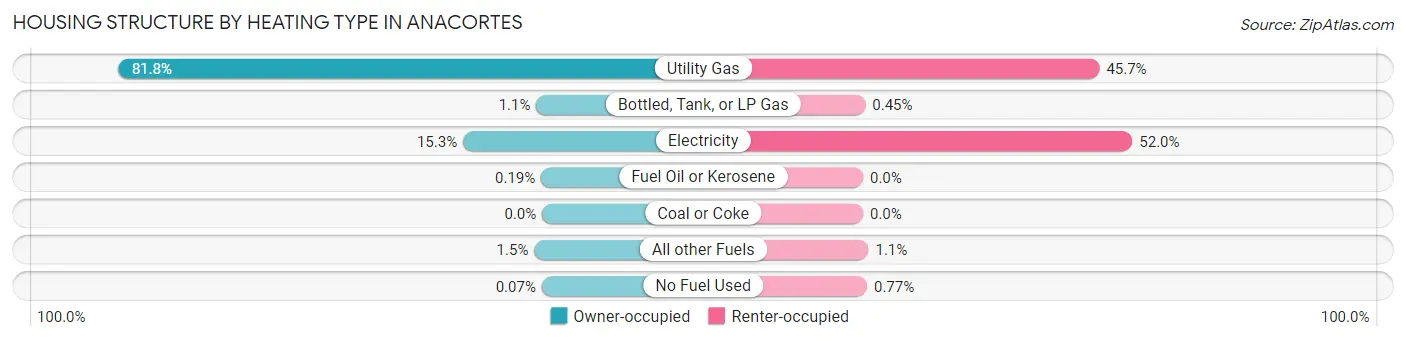
| Heating Type | Owner-occupied | Renter-occupied |
| Utility Gas | 4,373 (81.8%) | 1,121 (45.7%) |
| Bottled, Tank, or LP Gas | 60 (1.1%) | 11 (0.4%) |
| Electricity | 817 (15.3%) | 1,277 (52.0%) |
| Fuel Oil or Kerosene | 10 (0.2%) | 0 (0.0%) |
| Coal or Coke | 0 (0.0%) | 0 (0.0%) |
| All other Fuels | 81 (1.5%) | 26 (1.1%) |
| No Fuel Used | 4 (0.1%) | 19 (0.8%) |
| Total | 5,345 (100.0%) | 2,454 (100.0%) |
Household Vehicle Usage in Anacortes
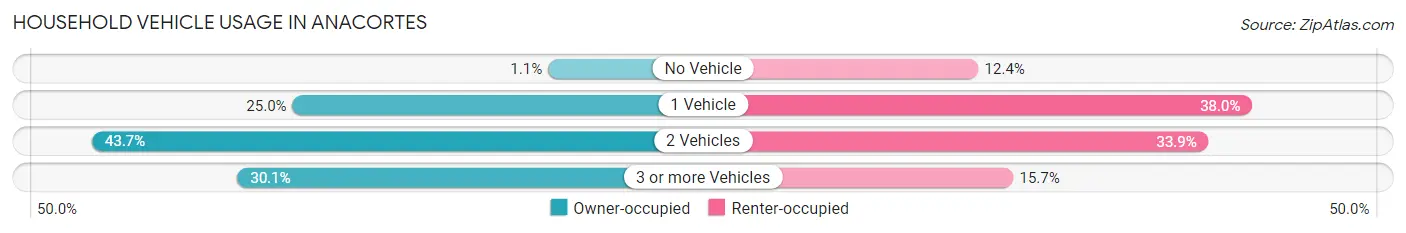
| Vehicles per Household | Owner-occupied | Renter-occupied |
| No Vehicle | 61 (1.1%) | 304 (12.4%) |
| 1 Vehicle | 1,336 (25.0%) | 933 (38.0%) |
| 2 Vehicles | 2,337 (43.7%) | 833 (33.9%) |
| 3 or more Vehicles | 1,611 (30.1%) | 384 (15.7%) |
| Total | 5,345 (100.0%) | 2,454 (100.0%) |
Real Estate & Mortgages in Anacortes
Real Estate and Mortgage Overview in Anacortes
| Characteristic | Without Mortgage | With Mortgage |
| Housing Units | 2,126 | 3,219 |
| Median Property Value | $599,300 | $585,400 |
| Median Household Income | $79,231 | $1,120 |
| Monthly Housing Costs | $719 | $708 |
| Real Estate Taxes | $4,376 | $17 |
Property Value by Mortgage Status in Anacortes
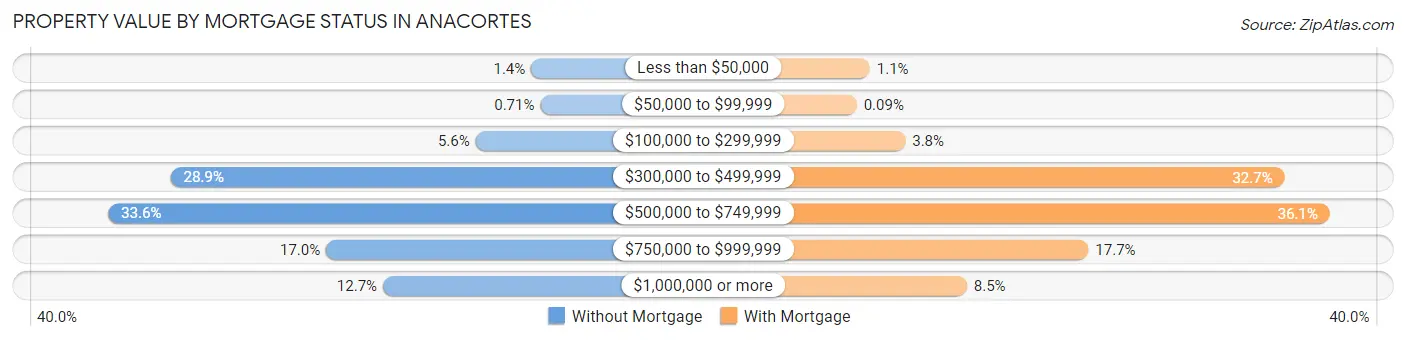
| Property Value | Without Mortgage | With Mortgage |
| Less than $50,000 | 30 (1.4%) | 35 (1.1%) |
| $50,000 to $99,999 | 15 (0.7%) | 3 (0.1%) |
| $100,000 to $299,999 | 120 (5.6%) | 122 (3.8%) |
| $300,000 to $499,999 | 614 (28.9%) | 1,052 (32.7%) |
| $500,000 to $749,999 | 715 (33.6%) | 1,163 (36.1%) |
| $750,000 to $999,999 | 362 (17.0%) | 571 (17.7%) |
| $1,000,000 or more | 270 (12.7%) | 273 (8.5%) |
| Total | 2,126 (100.0%) | 3,219 (100.0%) |
Household Income by Mortgage Status in Anacortes
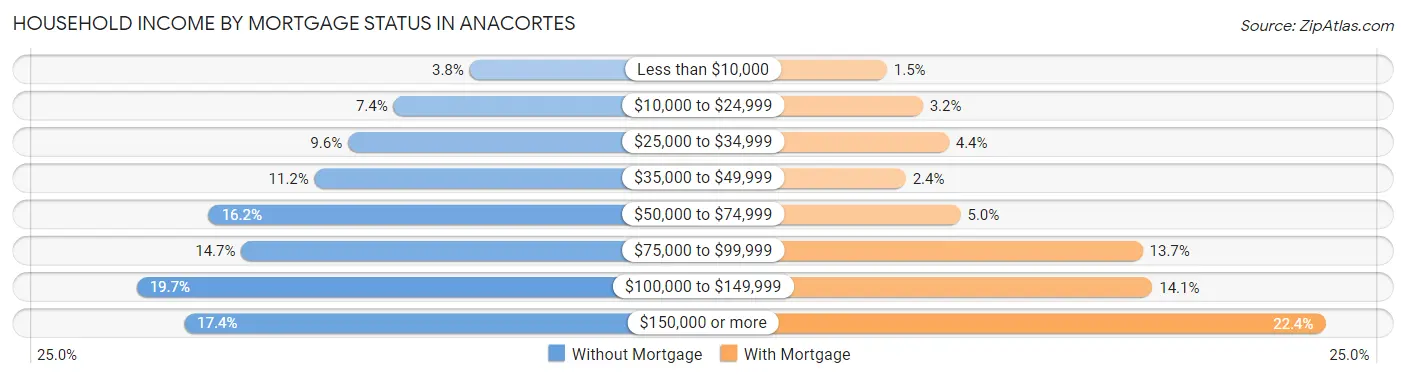
| Household Income | Without Mortgage | With Mortgage |
| Less than $10,000 | 81 (3.8%) | 48 (1.5%) |
| $10,000 to $24,999 | 158 (7.4%) | 103 (3.2%) |
| $25,000 to $34,999 | 204 (9.6%) | 143 (4.4%) |
| $35,000 to $49,999 | 238 (11.2%) | 77 (2.4%) |
| $50,000 to $74,999 | 345 (16.2%) | 161 (5.0%) |
| $75,000 to $99,999 | 312 (14.7%) | 440 (13.7%) |
| $100,000 to $149,999 | 418 (19.7%) | 455 (14.1%) |
| $150,000 or more | 370 (17.4%) | 720 (22.4%) |
| Total | 2,126 (100.0%) | 3,219 (100.0%) |
Property Value to Household Income Ratio in Anacortes
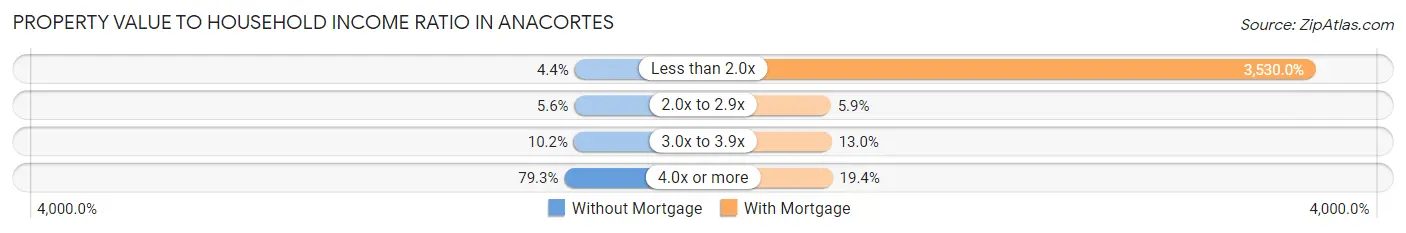
| Value-to-Income Ratio | Without Mortgage | With Mortgage |
| Less than 2.0x | 94 (4.4%) | 113,631 (3,530.0%) |
| 2.0x to 2.9x | 118 (5.6%) | 189 (5.9%) |
| 3.0x to 3.9x | 217 (10.2%) | 418 (13.0%) |
| 4.0x or more | 1,686 (79.3%) | 623 (19.4%) |
| Total | 2,126 (100.0%) | 3,219 (100.0%) |
Real Estate Taxes by Mortgage Status in Anacortes
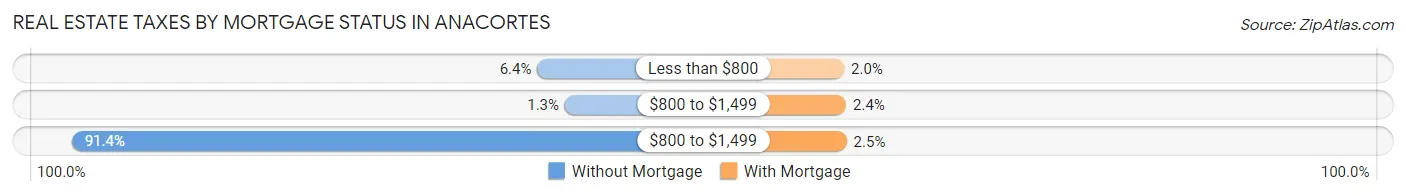
| Property Taxes | Without Mortgage | With Mortgage |
| Less than $800 | 135 (6.4%) | 65 (2.0%) |
| $800 to $1,499 | 28 (1.3%) | 77 (2.4%) |
| $800 to $1,499 | 1,943 (91.4%) | 80 (2.5%) |
| Total | 2,126 (100.0%) | 3,219 (100.0%) |
Health & Disability in Anacortes
Health Insurance Coverage by Age in Anacortes
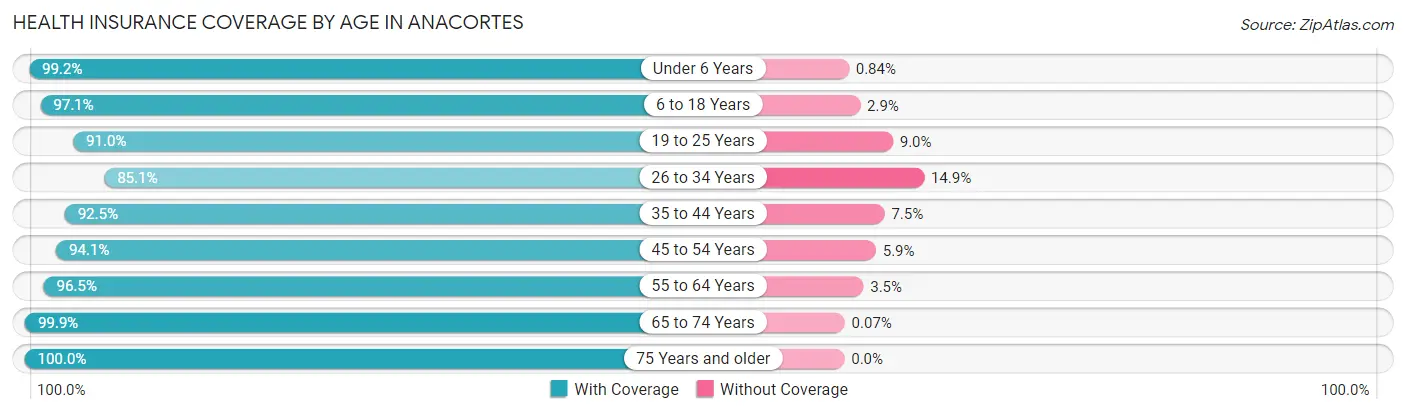
| Age Bracket | With Coverage | Without Coverage |
| Under 6 Years | 939 (99.2%) | 8 (0.8%) |
| 6 to 18 Years | 2,375 (97.1%) | 72 (2.9%) |
| 19 to 25 Years | 755 (91.0%) | 75 (9.0%) |
| 26 to 34 Years | 1,232 (85.1%) | 215 (14.9%) |
| 35 to 44 Years | 1,729 (92.5%) | 140 (7.5%) |
| 45 to 54 Years | 1,876 (94.1%) | 117 (5.9%) |
| 55 to 64 Years | 2,292 (96.5%) | 84 (3.5%) |
| 65 to 74 Years | 2,954 (99.9%) | 2 (0.1%) |
| 75 Years and older | 2,194 (100.0%) | 0 (0.0%) |
| Total | 16,346 (95.8%) | 713 (4.2%) |
Health Insurance Coverage by Citizenship Status in Anacortes
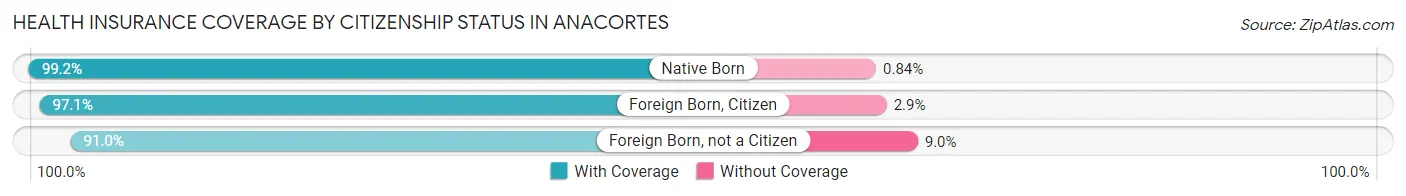
| Citizenship Status | With Coverage | Without Coverage |
| Native Born | 939 (99.2%) | 8 (0.8%) |
| Foreign Born, Citizen | 2,375 (97.1%) | 72 (2.9%) |
| Foreign Born, not a Citizen | 755 (91.0%) | 75 (9.0%) |
Health Insurance Coverage by Household Income in Anacortes
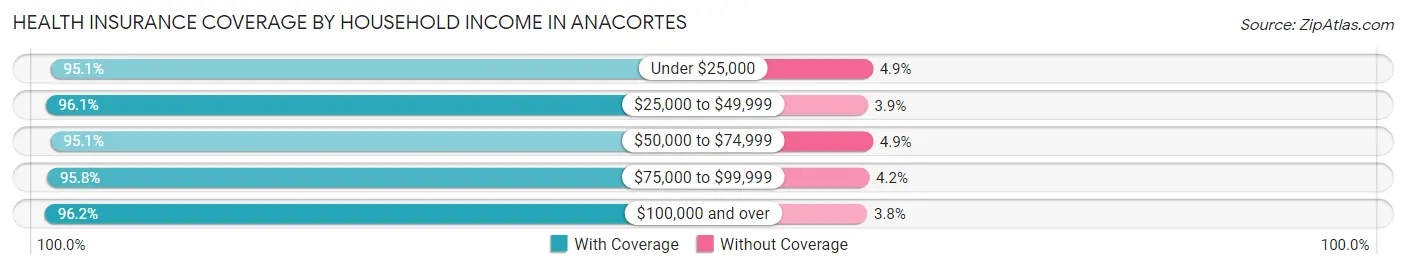
| Household Income | With Coverage | Without Coverage |
| Under $25,000 | 1,410 (95.1%) | 72 (4.9%) |
| $25,000 to $49,999 | 1,784 (96.1%) | 72 (3.9%) |
| $50,000 to $74,999 | 2,318 (95.1%) | 119 (4.9%) |
| $75,000 to $99,999 | 2,241 (95.8%) | 98 (4.2%) |
| $100,000 and over | 8,528 (96.2%) | 336 (3.8%) |
Public vs Private Health Insurance Coverage by Age in Anacortes
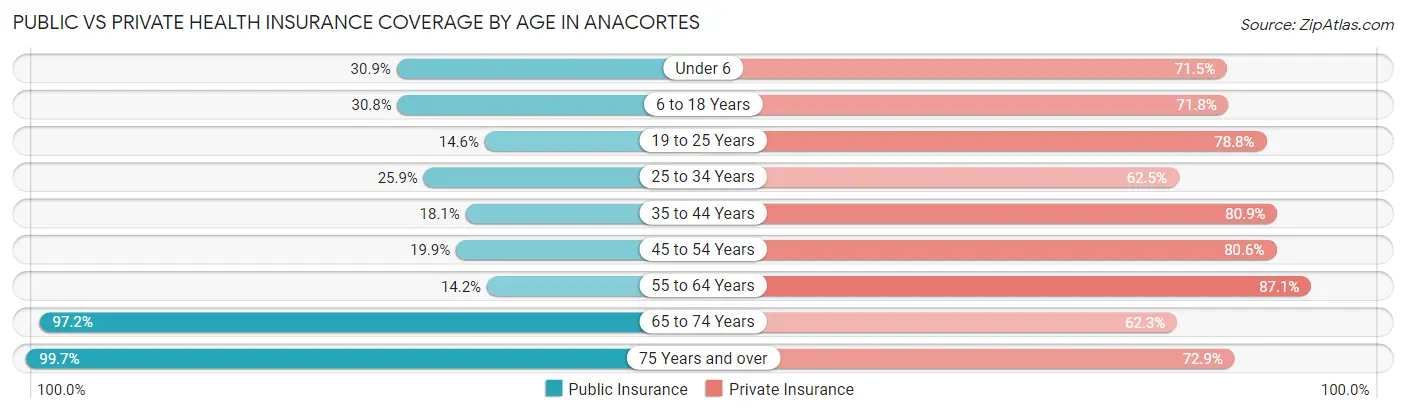
| Age Bracket | Public Insurance | Private Insurance |
| Under 6 | 293 (30.9%) | 677 (71.5%) |
| 6 to 18 Years | 753 (30.8%) | 1,757 (71.8%) |
| 19 to 25 Years | 121 (14.6%) | 654 (78.8%) |
| 25 to 34 Years | 375 (25.9%) | 905 (62.5%) |
| 35 to 44 Years | 339 (18.1%) | 1,511 (80.8%) |
| 45 to 54 Years | 397 (19.9%) | 1,607 (80.6%) |
| 55 to 64 Years | 337 (14.2%) | 2,070 (87.1%) |
| 65 to 74 Years | 2,874 (97.2%) | 1,840 (62.3%) |
| 75 Years and over | 2,187 (99.7%) | 1,600 (72.9%) |
| Total | 7,676 (45.0%) | 12,621 (74.0%) |
Disability Status by Sex by Age in Anacortes
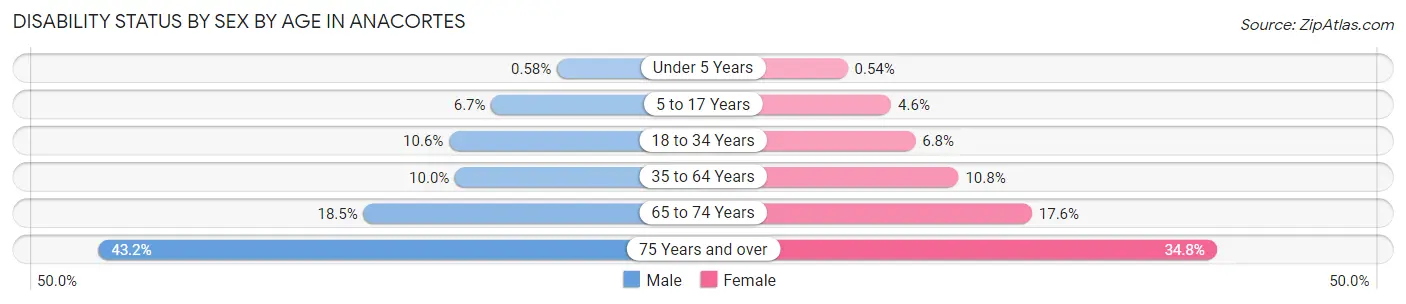
| Age Bracket | Male | Female |
| Under 5 Years | 2 (0.6%) | 2 (0.5%) |
| 5 to 17 Years | 85 (6.7%) | 54 (4.6%) |
| 18 to 34 Years | 133 (10.6%) | 85 (6.8%) |
| 35 to 64 Years | 301 (10.0%) | 351 (10.8%) |
| 65 to 74 Years | 239 (18.5%) | 294 (17.6%) |
| 75 Years and over | 442 (43.2%) | 407 (34.8%) |
Disability Class by Sex by Age in Anacortes
Disability Class: Hearing Difficulty
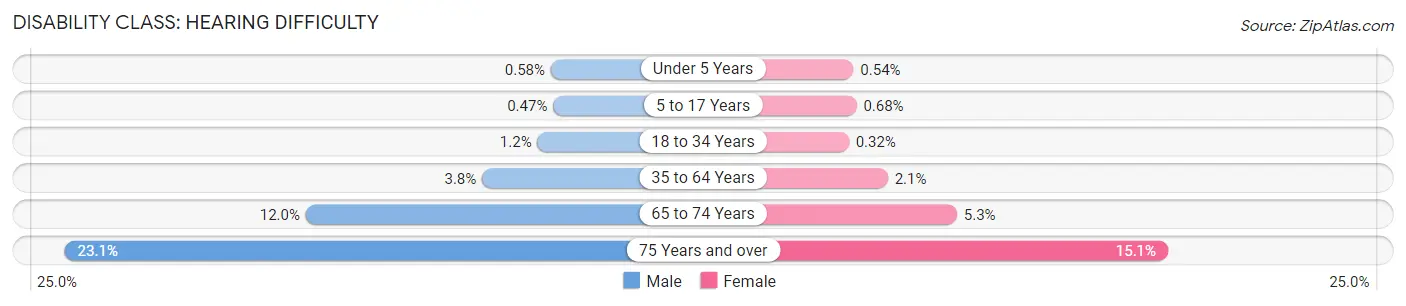
| Age Bracket | Male | Female |
| Under 5 Years | 2 (0.6%) | 2 (0.5%) |
| 5 to 17 Years | 6 (0.5%) | 8 (0.7%) |
| 18 to 34 Years | 15 (1.2%) | 4 (0.3%) |
| 35 to 64 Years | 113 (3.8%) | 69 (2.1%) |
| 65 to 74 Years | 154 (11.9%) | 89 (5.3%) |
| 75 Years and over | 237 (23.1%) | 177 (15.1%) |
Disability Class: Vision Difficulty
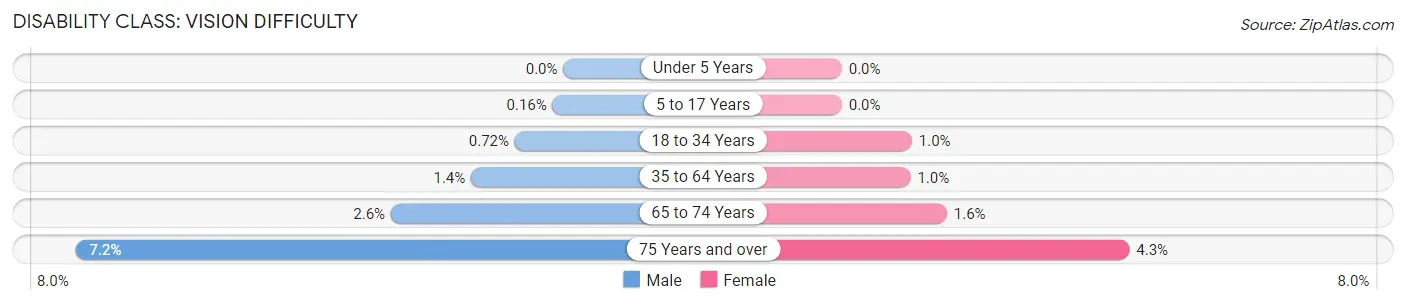
| Age Bracket | Male | Female |
| Under 5 Years | 0 (0.0%) | 0 (0.0%) |
| 5 to 17 Years | 2 (0.2%) | 0 (0.0%) |
| 18 to 34 Years | 9 (0.7%) | 13 (1.0%) |
| 35 to 64 Years | 41 (1.4%) | 33 (1.0%) |
| 65 to 74 Years | 33 (2.6%) | 26 (1.6%) |
| 75 Years and over | 74 (7.2%) | 50 (4.3%) |
Disability Class: Cognitive Difficulty
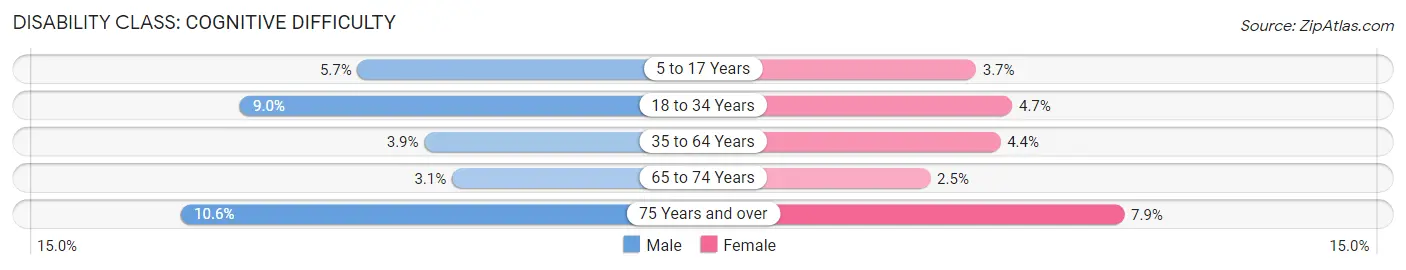
| Age Bracket | Male | Female |
| 5 to 17 Years | 73 (5.7%) | 44 (3.7%) |
| 18 to 34 Years | 113 (9.0%) | 59 (4.7%) |
| 35 to 64 Years | 116 (3.9%) | 143 (4.4%) |
| 65 to 74 Years | 40 (3.1%) | 41 (2.5%) |
| 75 Years and over | 109 (10.6%) | 92 (7.9%) |
Disability Class: Ambulatory Difficulty
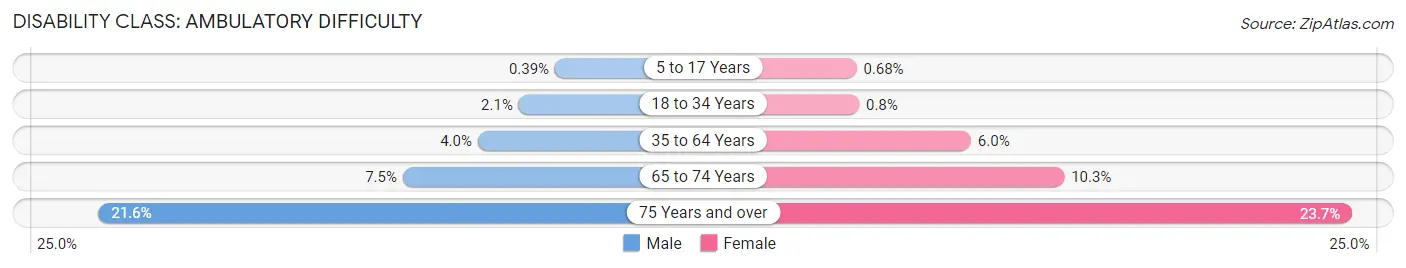
| Age Bracket | Male | Female |
| 5 to 17 Years | 5 (0.4%) | 8 (0.7%) |
| 18 to 34 Years | 26 (2.1%) | 10 (0.8%) |
| 35 to 64 Years | 119 (4.0%) | 194 (6.0%) |
| 65 to 74 Years | 96 (7.4%) | 172 (10.3%) |
| 75 Years and over | 221 (21.6%) | 277 (23.7%) |
Disability Class: Self-Care Difficulty
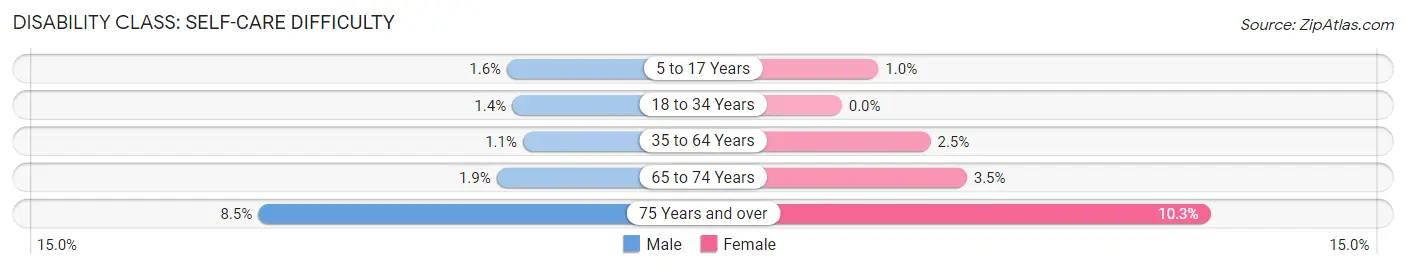
| Age Bracket | Male | Female |
| 5 to 17 Years | 20 (1.6%) | 12 (1.0%) |
| 18 to 34 Years | 18 (1.4%) | 0 (0.0%) |
| 35 to 64 Years | 34 (1.1%) | 80 (2.5%) |
| 65 to 74 Years | 24 (1.9%) | 58 (3.5%) |
| 75 Years and over | 87 (8.5%) | 120 (10.3%) |
Technology Access in Anacortes
Computing Device Access in Anacortes
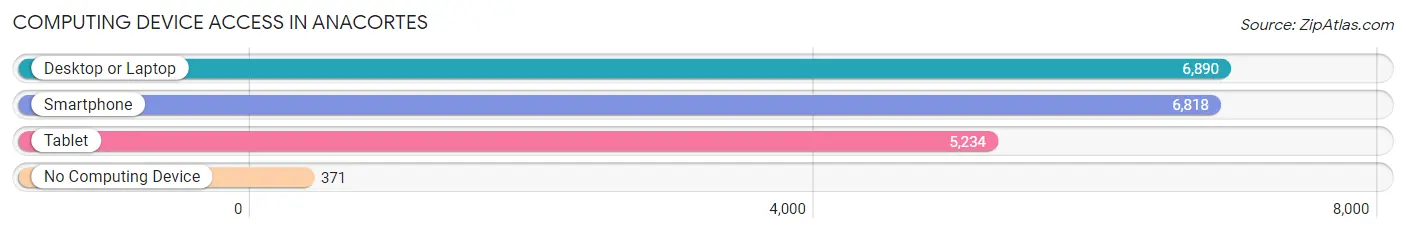
| Device Type | # Households | % Households |
| Desktop or Laptop | 6,890 | 88.3% |
| Smartphone | 6,818 | 87.4% |
| Tablet | 5,234 | 67.1% |
| No Computing Device | 371 | 4.8% |
| Total | 7,799 | 100.0% |
Internet Access in Anacortes
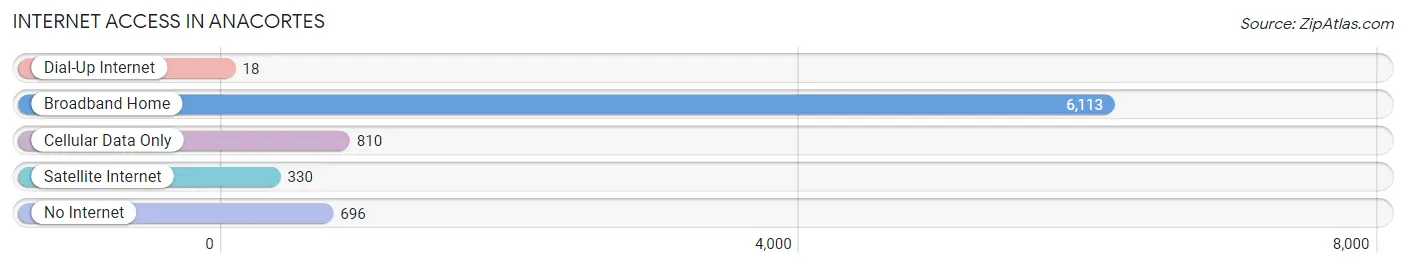
| Internet Type | # Households | % Households |
| Dial-Up Internet | 18 | 0.2% |
| Broadband Home | 6,113 | 78.4% |
| Cellular Data Only | 810 | 10.4% |
| Satellite Internet | 330 | 4.2% |
| No Internet | 696 | 8.9% |
| Total | 7,799 | 100.0% |
Anacortes Summary
Anacortes is a city located in Skagit County, Washington, United States. It is situated on Fidalgo Island, which is part of the San Juan Islands archipelago. The city is known for its picturesque views of the San Juan Islands, the Cascade Mountains, and the Strait of Juan de Fuca. As of the 2010 census, the population of Anacortes was 15,778.
History
The area that is now Anacortes was first inhabited by the Samish people, who lived in the area for thousands of years before the arrival of European settlers. The first European settlers arrived in the area in the late 1800s, and the city was officially incorporated in 1891. The city was named after Anna Curtis, the daughter of the first postmaster.
The city quickly grew in the early 1900s, and by the 1920s it had become a major port for the logging industry. The city was also home to a large fishing fleet, and it was a popular destination for tourists.
In the 1950s, the city began to diversify its economy, and it became a major center for the manufacturing of paper products. The city also became a popular destination for retirees, and it has continued to grow in population since then.
Geography
Anacortes is located on Fidalgo Island, which is part of the San Juan Islands archipelago. The city is situated on the eastern shore of the island, and it is bordered by the Strait of Juan de Fuca to the north and the Skagit Bay to the south. The city is surrounded by the Cascade Mountains to the east and the Olympic Mountains to the west.
The city has a total area of 8.7 square miles, of which 8.3 square miles is land and 0.4 square miles is water. The city has a mild climate, with warm summers and mild winters.
Economy
Anacortes is a major center for the manufacturing of paper products, and it is home to several large paper mills. The city is also home to a large fishing fleet, and it is a popular destination for tourists.
The city is home to several large employers, including the Anacortes School District, the Anacortes Public Library, and the Anacortes Community Hospital. The city is also home to several retail stores, restaurants, and other businesses.
Demographics
As of the 2010 census, the population of Anacortes was 15,778. The racial makeup of the city was 87.3% White, 0.7% African American, 1.2% Native American, 2.2% Asian, 0.2% Pacific Islander, 5.2% from other races, and 3.4% from two or more races. Hispanic or Latino of any race were 11.2% of the population.
The median household income in Anacortes was $50,945, and the median family income was $60,945. The per capita income for the city was $27,845. About 8.3% of families and 11.2% of the population were below the poverty line, including 15.2% of those under age 18 and 6.2% of those age 65 or over.
Common Questions
What is Per Capita Income in Anacortes?
Per Capita income in Anacortes is $49,833.
What is the Median Family Income in Anacortes?
Median Family Income in Anacortes is $108,321.
What is the Median Household income in Anacortes?
Median Household Income in Anacortes is $86,911.
What is Income or Wage Gap in Anacortes?
Income or Wage Gap in Anacortes is 44.3%.
Women in Anacortes earn 55.7 cents for every dollar earned by a man.
What is Family Income Deficit in Anacortes?
Family Income Deficit in Anacortes is $11,462.
Families that are below poverty line in Anacortes earn $11,462 less on average than the poverty threshold level.
What is Inequality or Gini Index in Anacortes?
Inequality or Gini Index in Anacortes is 0.44.
What is the Total Population of Anacortes?
Total Population of Anacortes is 17,667.
What is the Total Male Population of Anacortes?
Total Male Population of Anacortes is 8,680.
What is the Total Female Population of Anacortes?
Total Female Population of Anacortes is 8,987.
What is the Ratio of Males per 100 Females in Anacortes?
There are 96.58 Males per 100 Females in Anacortes.
What is the Ratio of Females per 100 Males in Anacortes?
There are 103.54 Females per 100 Males in Anacortes.
What is the Median Population Age in Anacortes?
Median Population Age in Anacortes is 48.7 Years.
What is the Average Family Size in Anacortes
Average Family Size in Anacortes is 2.8 People.
What is the Average Household Size in Anacortes
Average Household Size in Anacortes is 2.2 People.
How Large is the Labor Force in Anacortes?
There are 7,943 People in the Labor Forcein in Anacortes.
What is the Percentage of People in the Labor Force in Anacortes?
53.2% of People are in the Labor Force in Anacortes.
What is the Unemployment Rate in Anacortes?
Unemployment Rate in Anacortes is 4.2%.