Cities with the Lowest Unemployment Rate Amomg Seniors Over the Age of 65 in Maryland
RELATED REPORTS & OPTIONS
Lowest Unemployment | Senior > 65
Maryland
Compare Cities
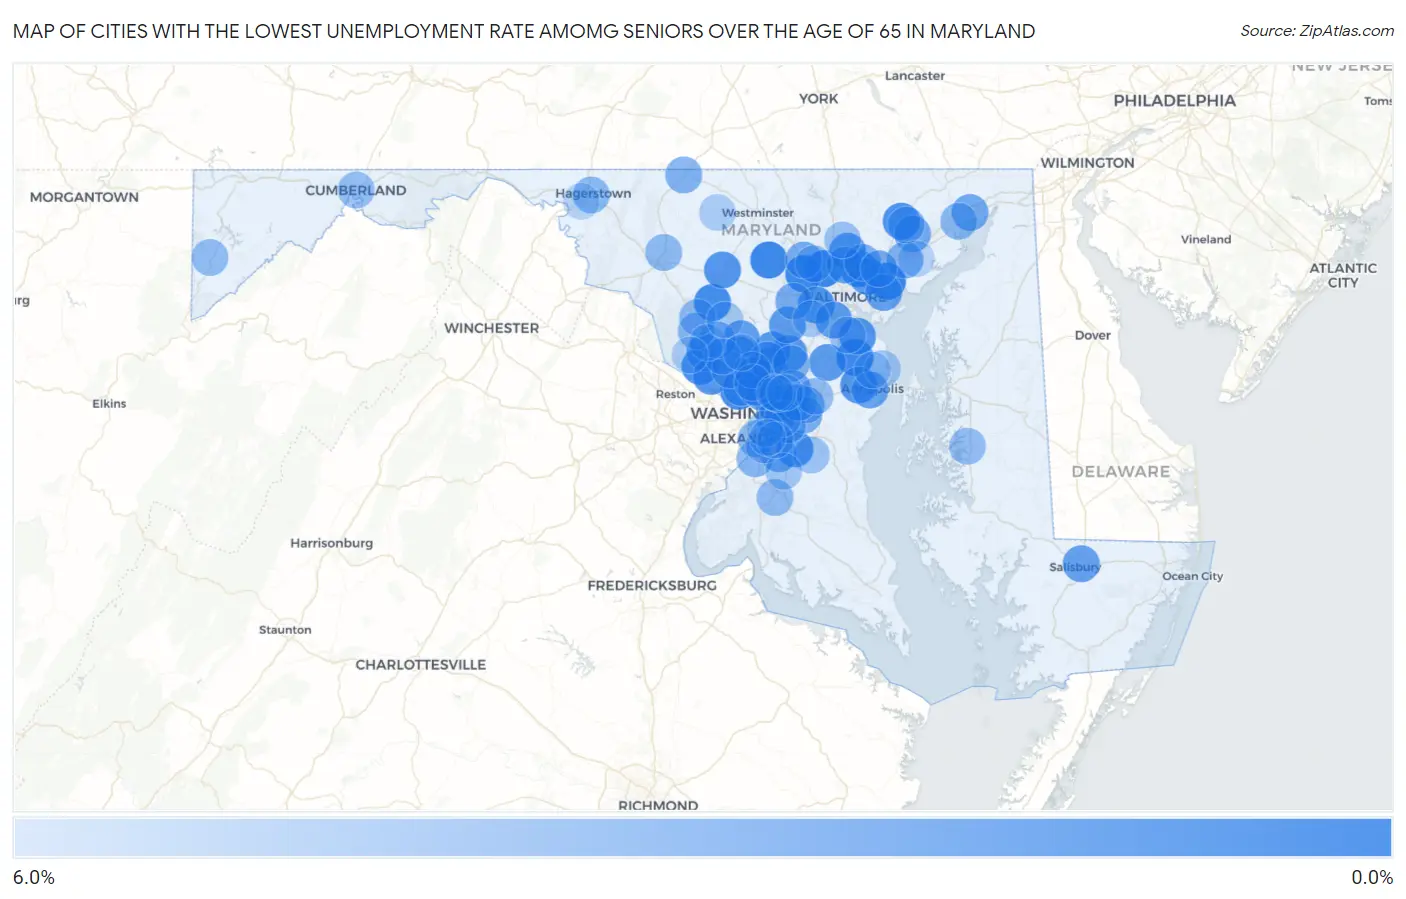
Map of Cities with the Lowest Unemployment Rate Amomg Seniors Over the Age of 65 in Maryland
6.0%
0.0%
Cities with the Lowest Unemployment Rate Amomg Seniors Over the Age of 65 in Maryland
| City | Senior Unemployment | vs State | vs National | |
| 1. | Middle River | 0.10% | 3.6%(-3.50)#1 | 3.9%(-3.80)#3 |
| 2. | Pikesville | 0.20% | 3.6%(-3.40)#2 | 3.9%(-3.70)#8 |
| 3. | Severna Park | 0.40% | 3.6%(-3.20)#3 | 3.9%(-3.50)#33 |
| 4. | Randallstown | 0.40% | 3.6%(-3.20)#4 | 3.9%(-3.50)#35 |
| 5. | Eldersburg | 0.40% | 3.6%(-3.20)#5 | 3.9%(-3.50)#37 |
| 6. | Parkville | 0.50% | 3.6%(-3.10)#6 | 3.9%(-3.40)#59 |
| 7. | Damascus | 0.60% | 3.6%(-3.00)#7 | 3.9%(-3.30)#93 |
| 8. | Chevy Chase Village | 0.70% | 3.6%(-2.90)#8 | 3.9%(-3.20)#130 |
| 9. | Bel Air North | 1.0% | 3.6%(-2.60)#9 | 3.9%(-2.90)#206 |
| 10. | Travilah | 1.0% | 3.6%(-2.60)#10 | 3.9%(-2.90)#223 |
| 11. | Catonsville | 1.1% | 3.6%(-2.50)#11 | 3.9%(-2.80)#245 |
| 12. | Calverton | 1.1% | 3.6%(-2.50)#12 | 3.9%(-2.80)#264 |
| 13. | Rosaryville | 1.1% | 3.6%(-2.50)#13 | 3.9%(-2.80)#272 |
| 14. | Glenarden | 1.1% | 3.6%(-2.50)#14 | 3.9%(-2.80)#279 |
| 15. | Aspen Hill | 1.2% | 3.6%(-2.40)#15 | 3.9%(-2.70)#284 |
| 16. | North Potomac | 1.2% | 3.6%(-2.40)#16 | 3.9%(-2.70)#300 |
| 17. | Pasadena | 1.3% | 3.6%(-2.30)#17 | 3.9%(-2.60)#349 |
| 18. | Parole | 1.3% | 3.6%(-2.30)#18 | 3.9%(-2.60)#366 |
| 19. | Mount Airy | 1.3% | 3.6%(-2.30)#19 | 3.9%(-2.60)#378 |
| 20. | Potomac | 1.4% | 3.6%(-2.20)#20 | 3.9%(-2.50)#392 |
| 21. | Laurel | 1.4% | 3.6%(-2.20)#21 | 3.9%(-2.50)#398 |
| 22. | Flower Hill | 1.4% | 3.6%(-2.20)#22 | 3.9%(-2.50)#413 |
| 23. | Burtonsville | 1.4% | 3.6%(-2.20)#23 | 3.9%(-2.50)#420 |
| 24. | Odenton | 1.6% | 3.6%(-2.00)#24 | 3.9%(-2.30)#495 |
| 25. | Linthicum | 1.6% | 3.6%(-2.00)#25 | 3.9%(-2.30)#529 |
| 26. | Columbia | 1.7% | 3.6%(-1.90)#26 | 3.9%(-2.20)#549 |
| 27. | Timonium | 1.7% | 3.6%(-1.90)#27 | 3.9%(-2.20)#586 |
| 28. | Four Corners | 1.7% | 3.6%(-1.90)#28 | 3.9%(-2.20)#592 |
| 29. | Olney | 1.8% | 3.6%(-1.80)#29 | 3.9%(-2.10)#624 |
| 30. | Overlea | 1.8% | 3.6%(-1.80)#30 | 3.9%(-2.10)#648 |
| 31. | Essex | 1.9% | 3.6%(-1.70)#31 | 3.9%(-2.00)#682 |
| 32. | Martin S Additions | 1.9% | 3.6%(-1.70)#32 | 3.9%(-2.00)#728 |
| 33. | Salisbury | 2.0% | 3.6%(-1.60)#33 | 3.9%(-1.90)#746 |
| 34. | Hyattsville | 2.0% | 3.6%(-1.60)#34 | 3.9%(-1.90)#759 |
| 35. | Seabrook | 2.0% | 3.6%(-1.60)#35 | 3.9%(-1.90)#762 |
| 36. | Towson | 2.1% | 3.6%(-1.50)#36 | 3.9%(-1.80)#803 |
| 37. | Chillum | 2.1% | 3.6%(-1.50)#37 | 3.9%(-1.80)#807 |
| 38. | Cheverly | 2.1% | 3.6%(-1.50)#38 | 3.9%(-1.80)#842 |
| 39. | Abingdon | 2.1% | 3.6%(-1.50)#39 | 3.9%(-1.80)#848 |
| 40. | Annapolis | 2.2% | 3.6%(-1.40)#40 | 3.9%(-1.70)#879 |
| 41. | Coral Hills | 2.2% | 3.6%(-1.40)#41 | 3.9%(-1.70)#908 |
| 42. | Honeygo | 2.3% | 3.6%(-1.30)#42 | 3.9%(-1.60)#975 |
| 43. | Bel Air South | 2.5% | 3.6%(-1.10)#43 | 3.9%(-1.40)#1,089 |
| 44. | Perryville | 2.5% | 3.6%(-1.10)#44 | 3.9%(-1.40)#1,139 |
| 45. | Clinton | 2.6% | 3.6%(-1.00)#45 | 3.9%(-1.30)#1,171 |
| 46. | Ellicott City | 2.7% | 3.6%(-0.900)#46 | 3.9%(-1.20)#1,228 |
| 47. | North Bethesda | 2.7% | 3.6%(-0.900)#47 | 3.9%(-1.20)#1,233 |
| 48. | Takoma Park | 2.7% | 3.6%(-0.900)#48 | 3.9%(-1.20)#1,255 |
| 49. | Owings Mills | 2.8% | 3.6%(-0.800)#49 | 3.9%(-1.10)#1,313 |
| 50. | Carney | 2.8% | 3.6%(-0.800)#50 | 3.9%(-1.10)#1,317 |
| 51. | Fairland | 2.8% | 3.6%(-0.800)#51 | 3.9%(-1.10)#1,321 |
| 52. | Kettering | 2.8% | 3.6%(-0.800)#52 | 3.9%(-1.10)#1,335 |
| 53. | Joppatowne | 2.8% | 3.6%(-0.800)#53 | 3.9%(-1.10)#1,336 |
| 54. | White Marsh | 2.8% | 3.6%(-0.800)#54 | 3.9%(-1.10)#1,341 |
| 55. | Woodmore | 2.9% | 3.6%(-0.700)#55 | 3.9%(-1.00)#1,432 |
| 56. | Forestville | 3.0% | 3.6%(-0.600)#56 | 3.9%(-0.900)#1,498 |
| 57. | Emmitsburg | 3.1% | 3.6%(-0.500)#57 | 3.9%(-0.800)#1,598 |
| 58. | Bel Air | 3.2% | 3.6%(-0.400)#58 | 3.9%(-0.700)#1,669 |
| 59. | Woodlawn Cdp Prince George S County | 3.2% | 3.6%(-0.400)#59 | 3.9%(-0.700)#1,674 |
| 60. | Washington Grove | 3.2% | 3.6%(-0.400)#60 | 3.9%(-0.700)#1,702 |
| 61. | South Laurel | 3.3% | 3.6%(-0.300)#61 | 3.9%(-0.600)#1,729 |
| 62. | Forest Heights | 3.3% | 3.6%(-0.300)#62 | 3.9%(-0.600)#1,768 |
| 63. | Germantown | 3.4% | 3.6%(-0.200)#63 | 3.9%(-0.500)#1,788 |
| 64. | Fort Washington | 3.4% | 3.6%(-0.200)#64 | 3.9%(-0.500)#1,805 |
| 65. | Hagerstown | 3.5% | 3.6%(-0.100)#65 | 3.9%(-0.400)#1,877 |
| 66. | Havre De Grace | 3.5% | 3.6%(-0.100)#66 | 3.9%(-0.400)#1,893 |
| 67. | Frederick | 3.6% | 3.6%(=0.000)#67 | 3.9%(-0.300)#1,938 |
| 68. | Mitchellville | 3.6% | 3.6%(=0.000)#68 | 3.9%(-0.300)#1,967 |
| 69. | Waldorf | 3.7% | 3.6%(+0.100)#69 | 3.9%(-0.200)#2,007 |
| 70. | Clarksburg | 3.7% | 3.6%(+0.100)#70 | 3.9%(-0.200)#2,022 |
| 71. | Kemp Mill | 3.7% | 3.6%(+0.100)#71 | 3.9%(-0.200)#2,031 |
| 72. | Walker Mill | 3.8% | 3.6%(+0.200)#72 | 3.9%(-0.100)#2,120 |
| 73. | Oakland | 3.8% | 3.6%(+0.200)#73 | 3.9%(-0.100)#2,136 |
| 74. | Easton | 3.9% | 3.6%(+0.300)#74 | 3.9%(=0.000)#2,186 |
| 75. | Garrison | 3.9% | 3.6%(+0.300)#75 | 3.9%(=0.000)#2,198 |
| 76. | Bowie | 4.0% | 3.6%(+0.400)#76 | 3.9%(+0.100)#2,241 |
| 77. | Cumberland | 4.0% | 3.6%(+0.400)#77 | 3.9%(+0.100)#2,265 |
| 78. | Silver Spring | 4.1% | 3.6%(+0.500)#78 | 3.9%(+0.200)#2,328 |
| 79. | Glen Burnie | 4.1% | 3.6%(+0.500)#79 | 3.9%(+0.200)#2,331 |
| 80. | Cockeysville | 4.2% | 3.6%(+0.600)#80 | 3.9%(+0.300)#2,409 |
| 81. | Rockville | 4.3% | 3.6%(+0.700)#81 | 3.9%(+0.400)#2,472 |
| 82. | Croom | 4.3% | 3.6%(+0.700)#82 | 3.9%(+0.400)#2,520 |
| 83. | Oxon Hill | 4.4% | 3.6%(+0.800)#83 | 3.9%(+0.500)#2,558 |
| 84. | Cape St Claire | 4.4% | 3.6%(+0.800)#84 | 3.9%(+0.500)#2,576 |
| 85. | East Riverdale | 4.5% | 3.6%(+0.900)#85 | 3.9%(+0.600)#2,644 |
| 86. | Hillcrest Heights | 4.5% | 3.6%(+0.900)#86 | 3.9%(+0.600)#2,647 |
| 87. | Brandywine | 4.5% | 3.6%(+0.900)#87 | 3.9%(+0.600)#2,658 |
| 88. | Gaithersburg | 4.6% | 3.6%(+1.000)#88 | 3.9%(+0.700)#2,702 |
| 89. | Ilchester | 4.6% | 3.6%(+1.000)#89 | 3.9%(+0.700)#2,715 |
| 90. | Riverdale Park | 4.6% | 3.6%(+1.000)#90 | 3.9%(+0.700)#2,744 |
| 91. | Laytonsville | 4.7% | 3.6%(+1.10)#91 | 3.9%(+0.800)#2,844 |
| 92. | Arnold | 4.9% | 3.6%(+1.30)#92 | 3.9%(+1.00)#2,914 |
| 93. | New Carrollton | 4.9% | 3.6%(+1.30)#93 | 3.9%(+1.00)#2,924 |
| 94. | Darnestown | 4.9% | 3.6%(+1.30)#94 | 3.9%(+1.00)#2,932 |
| 95. | Union Bridge | 4.9% | 3.6%(+1.30)#95 | 3.9%(+1.00)#2,955 |
| 96. | Camp Springs | 5.0% | 3.6%(+1.40)#96 | 3.9%(+1.10)#2,979 |
| 97. | Leisure World | 5.0% | 3.6%(+1.40)#97 | 3.9%(+1.10)#2,996 |
| 98. | Edgewood | 5.3% | 3.6%(+1.70)#98 | 3.9%(+1.40)#3,187 |
| 99. | Halfway | 5.3% | 3.6%(+1.70)#99 | 3.9%(+1.40)#3,203 |
| 100. | Temple Hills | 5.3% | 3.6%(+1.70)#100 | 3.9%(+1.40)#3,206 |
Common Questions
What are the Top 10 Cities with the Lowest Unemployment Rate Amomg Seniors Over the Age of 65 in Maryland?
Top 10 Cities with the Lowest Unemployment Rate Amomg Seniors Over the Age of 65 in Maryland are:
#1
0.10%
#2
0.20%
#3
0.40%
#4
0.40%
#5
0.40%
#6
0.50%
#7
0.60%
#8
0.70%
#9
1.0%
#10
1.0%
What city has the Lowest Unemployment Rate Amomg Seniors Over the Age of 65 in Maryland?
Middle River has the Lowest Unemployment Rate Amomg Seniors Over the Age of 65 in Maryland with 0.10%.
What is the Unemployment Rate Amomg Seniors Over the Age of 65 in the State of Maryland?
Unemployment Rate Amomg Seniors Over the Age of 65 in Maryland is 3.6%.
What is the Unemployment Rate Amomg Seniors Over the Age of 65 in the United States?
Unemployment Rate Amomg Seniors Over the Age of 65 in the United States is 3.9%.