Cities with the Lowest Unemployment Rate Amomg Seniors Over the Age of 65 in Montana

RELATED REPORTS & OPTIONS

Lowest Unemployment | Senior > 65
Population
Families and Households
Female Fertility
Female Fertility (Unmarried)
Race (Community Size)
Race (Percentage)
Ancestry (Community Size)
AfghanAfricanAlaska NativeAlaskan AthabascanAlbanianAleutAlsatianAmericanApacheArabArapahoArgentineanArmenianAssyrian / Chaldean / SyriacAustralianAustrianBahamianBangladeshiBarbadianBasqueBelgianBelizeanBermudanBhutaneseBlackfeetBolivianBrazilianBritishBritish West IndianBulgarianBurmeseCajunCambodianCanadianCape VerdeanCarpatho RusynCelticCentral AmericanCentral American IndianCherokeeCheyenneChickasawChileanChineseChippewaChoctawColombianColvilleComancheCosta RicanCreeCreekCroatianCrowCubanCypriotCzechCzechoslovakianDanishDelawareDominicanDutchDutch West IndianEastern EuropeanEcuadorianEgyptianEnglishEstonianEthiopianEuropeanFijianFilipinoFinnishFrenchFrench American IndianFrench CanadianGermanGerman RussianGhanaianGreekGuamanian / ChamorroGuatemalanGuyaneseHaitianHmongHonduranHopiHoumaHungarianIcelanderIndian (Asian)IndonesianInupiatIranianIraqiIrishIroquoisIsraeliItalianJamaicanJapaneseJordanianKenyanKiowaKoreanLaotianLatvianLebaneseLiberianLithuanianLumbeeLuxembourgerMacedonianMalaysianMalteseMarshalleseMenomineeMexicanMexican American IndianMongolianMoroccanNative HawaiianNavajoNepaleseNew ZealanderNicaraguanNigerianNorthern EuropeanNorwegianOkinawanOsageOttawaPaiutePakistaniPalestinianPanamanianParaguayanPennsylvania GermanPeruvianPimaPolishPortuguesePotawatomiPuebloPuerto RicanPuget Sound SalishRomanianRussianSalvadoranSamoanScandinavianScotch-IrishScottishSeminoleSenegaleseSerbianShoshoneSierra LeoneanSiouxSlavicSlovakSloveneSomaliSouth AfricanSouth AmericanSouth American IndianSoviet UnionSpaniardSpanishSpanish AmericanSpanish American IndianSri LankanSubsaharan AfricanSudaneseSwedishSwissSyrianTaiwaneseThaiTlingit-HaidaTohono O'OdhamTonganTrinidadian and TobagonianTsimshianTurkishU.S. Virgin IslanderUgandanUkrainianUruguayanUteVenezuelanVietnameseWelshWest IndianYakamaYaquiYugoslavianYumanYup'ikZimbabwean
Ancestry (Percentage)
AfghanAfricanAlaska NativeAlaskan AthabascanAlbanianAleutAlsatianAmericanApacheArabArapahoArgentineanArmenianAssyrian / Chaldean / SyriacAustralianAustrianBahamianBangladeshiBarbadianBasqueBelgianBelizeanBermudanBhutaneseBlackfeetBolivianBrazilianBritishBritish West IndianBulgarianBurmeseCajunCambodianCanadianCape VerdeanCarpatho RusynCelticCentral AmericanCentral American IndianCherokeeCheyenneChickasawChileanChineseChippewaChoctawColombianColvilleComancheCosta RicanCreeCreekCroatianCrowCubanCypriotCzechCzechoslovakianDanishDelawareDominicanDutchDutch West IndianEastern EuropeanEcuadorianEgyptianEnglishEstonianEthiopianEuropeanFijianFilipinoFinnishFrenchFrench American IndianFrench CanadianGermanGerman RussianGhanaianGreekGuamanian / ChamorroGuatemalanGuyaneseHaitianHmongHonduranHopiHoumaHungarianIcelanderIndian (Asian)IndonesianInupiatIranianIraqiIrishIroquoisIsraeliItalianJamaicanJapaneseJordanianKenyanKiowaKoreanLaotianLatvianLebaneseLiberianLithuanianLumbeeLuxembourgerMacedonianMalaysianMalteseMarshalleseMenomineeMexicanMexican American IndianMongolianMoroccanNative HawaiianNavajoNepaleseNew ZealanderNicaraguanNigerianNorthern EuropeanNorwegianOkinawanOsageOttawaPaiutePakistaniPalestinianPanamanianParaguayanPennsylvania GermanPeruvianPimaPolishPortuguesePotawatomiPuebloPuerto RicanPuget Sound SalishRomanianRussianSalvadoranSamoanScandinavianScotch-IrishScottishSeminoleSenegaleseSerbianShoshoneSierra LeoneanSiouxSlavicSlovakSloveneSomaliSouth AfricanSouth AmericanSouth American IndianSoviet UnionSpaniardSpanishSpanish AmericanSpanish American IndianSri LankanSubsaharan AfricanSudaneseSwedishSwissSyrianTaiwaneseThaiTlingit-HaidaTohono O'OdhamTonganTrinidadian and TobagonianTsimshianTurkishU.S. Virgin IslanderUgandanUkrainianUruguayanUteVenezuelanVietnameseWelshWest IndianYakamaYaquiYugoslavianYumanYup'ikZimbabwean
Immigrant Origin (Total)
AfghanistanAfricaAlbaniaArgentinaArmeniaAsiaAustraliaAustriaAzoresBahamasBangladeshBarbadosBelarusBelgiumBelizeBoliviaBosnia and HerzegovinaBrazilBulgariaBurma / MyanmarCabo VerdeCambodiaCameroonCanadaCaribbeanCentral AmericaChileChinaColombiaCongoCosta RicaCroatiaCubaCzechoslovakiaDenmarkDominicaDominican RepublicEastern AfricaEastern AsiaEastern EuropeEcuadorEgyptEl SalvadorEnglandEritreaEthiopiaEuropeFijiFranceGermanyGhanaGreeceGrenadaGuatemalaGuyanaHaitiHondurasHong KongHungaryIndiaIndonesiaIranIraqIrelandIsraelItalyJamaicaJapanJordanKazakhstanKenyaKoreaKuwaitLaosLatin AmericaLatviaLebanonLiberiaLithuaniaMalaysiaMexicoMicronesiaMiddle AfricaMoldovaMoroccoNepalNetherlandsNicaraguaNigeriaNorth MacedoniaNorthern AfricaNorthern EuropeNorwayOceaniaPakistanPanamaPeruPhilippinesPolandPortugalRomaniaRussiaSaudi ArabiaScotlandSenegalSerbiaSierra LeoneSingaporeSomaliaSouth AfricaSouth AmericaSouth Central AsiaSouth Eastern AsiaSouthern EuropeSpainSri LankaSt. Vincent and the GrenadinesSudanSwedenSwitzerlandSyriaTaiwanThailandTrinidad and TobagoTurkeyUgandaUkraineUruguayUzbekistanVenezuelaVietnamWest IndiesWestern AfricaWestern AsiaWestern EuropeYemenZaireZimbabwe
Immigrant Origin (Percentage)
AfghanistanAfricaAlbaniaArgentinaArmeniaAsiaAustraliaAustriaAzoresBahamasBangladeshBarbadosBelarusBelgiumBelizeBoliviaBosnia and HerzegovinaBrazilBulgariaBurma / MyanmarCabo VerdeCambodiaCameroonCanadaCaribbeanCentral AmericaChileChinaColombiaCongoCosta RicaCroatiaCubaCzechoslovakiaDenmarkDominicaDominican RepublicEastern AfricaEastern AsiaEastern EuropeEcuadorEgyptEl SalvadorEnglandEritreaEthiopiaEuropeFijiFranceGermanyGhanaGreeceGrenadaGuatemalaGuyanaHaitiHondurasHong KongHungaryIndiaIndonesiaIranIraqIrelandIsraelItalyJamaicaJapanJordanKazakhstanKenyaKoreaKuwaitLaosLatin AmericaLatviaLebanonLiberiaLithuaniaMalaysiaMexicoMicronesiaMiddle AfricaMoldovaMoroccoNepalNetherlandsNicaraguaNigeriaNorth MacedoniaNorthern AfricaNorthern EuropeNorwayOceaniaPakistanPanamaPeruPhilippinesPolandPortugalRomaniaRussiaSaudi ArabiaScotlandSenegalSerbiaSierra LeoneSingaporeSomaliaSouth AfricaSouth AmericaSouth Central AsiaSouth Eastern AsiaSouthern EuropeSpainSri LankaSt. Vincent and the GrenadinesSudanSwedenSwitzerlandSyriaTaiwanThailandTrinidad and TobagoTurkeyUgandaUkraineUruguayUzbekistanVenezuelaVietnamWest IndiesWestern AfricaWestern AsiaWestern EuropeYemenZaireZimbabwe
Income
Income (Families)
Income (Households)
Poverty
Poverty (Families)
Unemployment
Employment Occupations
Employment Industries
Employer Class
Commute Time
Commute Means
School Enrollment
Education by Degree Field
Occupancy
Finances
Physical Characteristics
Montana
Compare Cities
Comparison Subject

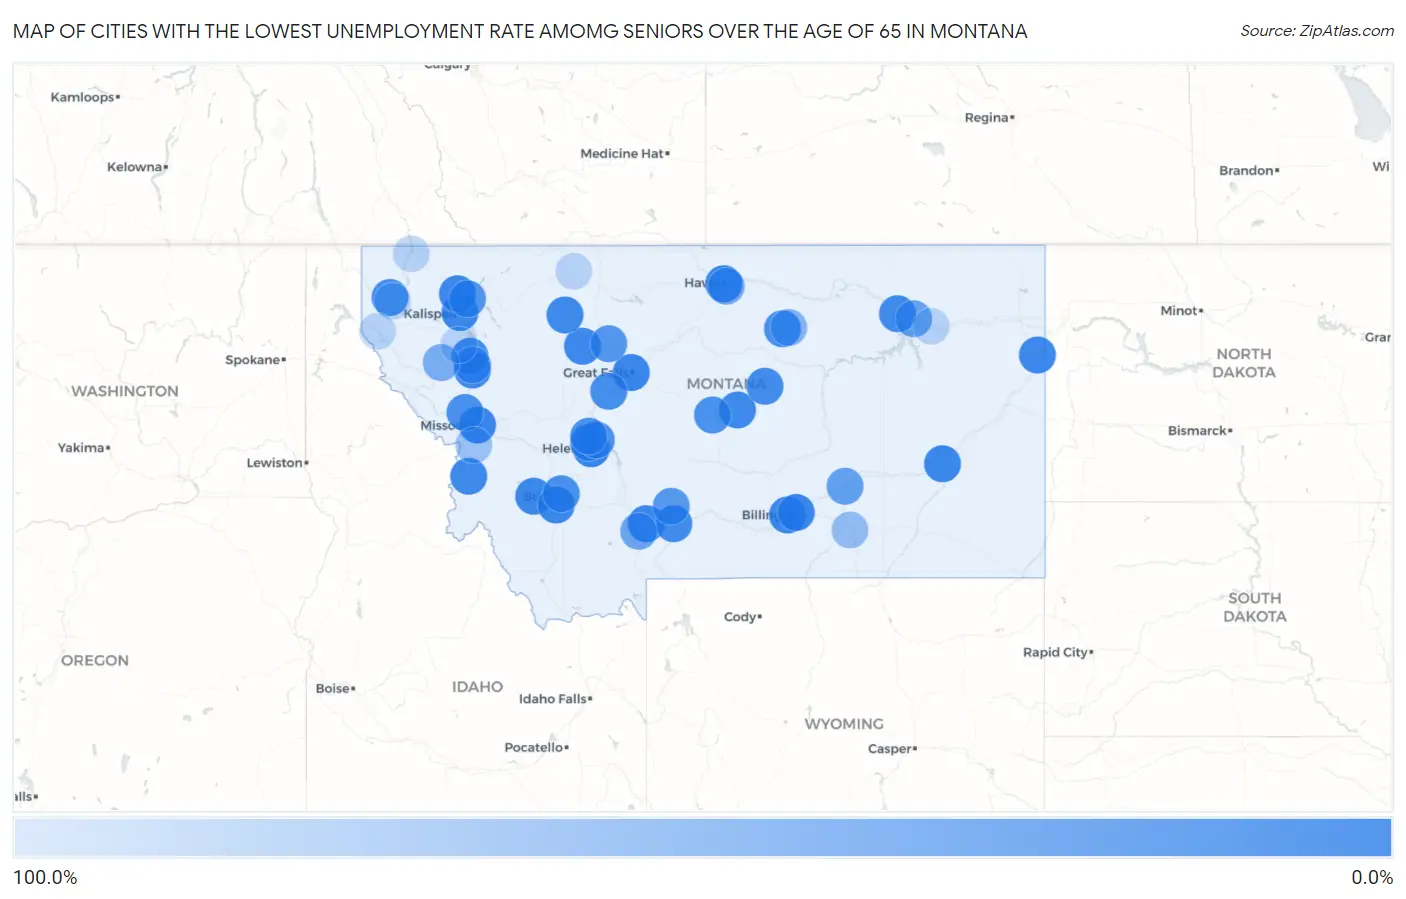
Map of Cities with the Lowest Unemployment Rate Amomg Seniors Over the Age of 65 in Montana

100.0%
0.0%
Cities with the Lowest Unemployment Rate Amomg Seniors Over the Age of 65 in Montana Map

Cities with the Lowest Unemployment Rate Amomg Seniors Over the Age of 65 in Montana

City Senior Unemployment vs State vs National
1.Missoula0.90%2.8%(-1.90)#13.9%(-3.00)#154
2.Bozeman0.90%2.8%(-1.90)#23.9%(-3.00)#158
3.Helena1.1%2.8%(-1.70)#33.9%(-2.80)#252
4.Great Falls1.3%2.8%(-1.50)#43.9%(-2.60)#336
5.Havre1.3%2.8%(-1.50)#53.9%(-2.60)#380
6.Anaconda Deer Lodge County2.4%2.8%(-0.400)#63.9%(-1.50)#1,059
7.Billings2.6%2.8%(-0.200)#73.9%(-1.30)#1,159
8.Miles City2.8%2.8%(=0.000)#83.9%(-1.10)#1,346
9.Helena Valley West Central3.1%2.8%(+0.300)#93.9%(-0.800)#1,584
10.Kalispell3.2%2.8%(+0.400)#103.9%(-0.700)#1,650
11.Whitefish3.2%2.8%(+0.400)#113.9%(-0.700)#1,673
12.Butte Silver Bow Balance3.3%2.8%(+0.500)#123.9%(-0.600)#1,724
13.Sidney3.5%2.8%(+0.700)#133.9%(-0.400)#1,913
14.Lockwood3.9%2.8%(+1.10)#143.9%(=0.000)#2,202
15.Choteau4.4%2.8%(+1.60)#153.9%(+0.500)#2,603
16.Dupuyer5.2%2.8%(+2.40)#163.9%(+1.30)#3,156
17.Lewistown5.7%2.8%(+2.90)#173.9%(+1.80)#3,420
18.Hamilton5.9%2.8%(+3.10)#183.9%(+2.00)#3,521
19.Ronan6.3%2.8%(+3.50)#193.9%(+2.40)#3,737
20.Glasgow6.9%2.8%(+4.10)#203.9%(+3.00)#4,035
21.Livingston7.5%2.8%(+4.70)#213.9%(+3.60)#4,263
22.Polson8.1%2.8%(+5.30)#223.9%(+4.20)#4,482
23.Roy9.0%2.8%(+6.20)#233.9%(+5.10)#4,809
24.Libby10.2%2.8%(+7.40)#243.9%(+6.30)#5,159
25.Hays11.1%2.8%(+8.30)#253.9%(+7.20)#5,361
26.Cascade11.5%2.8%(+8.70)#263.9%(+7.60)#5,456
27.Helena Valley Northeast13.3%2.8%(+10.5)#273.9%(+9.40)#5,743
28.Frenchtown14.2%2.8%(+11.4)#283.9%(+10.3)#5,869
29.Walkerville14.3%2.8%(+11.5)#293.9%(+10.4)#5,906
30.Helena Valley Northwest14.5%2.8%(+11.7)#303.9%(+10.6)#5,921
31.Hobson15.6%2.8%(+12.8)#313.9%(+11.7)#6,035
32.Tracy16.6%2.8%(+13.8)#323.9%(+12.7)#6,181
33.Columbia Falls20.7%2.8%(+17.9)#333.9%(+16.8)#6,534
34.Dutton22.2%2.8%(+19.4)#343.9%(+18.3)#6,635
35.Clyde Park25.9%2.8%(+23.1)#353.9%(+22.0)#6,819
36.Custer33.3%2.8%(+30.5)#363.9%(+29.4)#7,086
37.Nashua38.4%2.8%(+35.6)#373.9%(+34.5)#7,196
38.Pablo39.4%2.8%(+36.6)#383.9%(+35.5)#7,210
39.Gallatin Gateway41.0%2.8%(+38.2)#393.9%(+37.1)#7,248
40.Saddle Butte46.6%2.8%(+43.8)#403.9%(+42.7)#7,317
41.Camas50.0%2.8%(+47.2)#413.9%(+46.1)#7,377
42.Lodge Pole59.8%2.8%(+57.0)#423.9%(+55.9)#7,420
43.Crow Agency71.2%2.8%(+68.4)#433.9%(+67.3)#7,476
44.Florence78.5%2.8%(+75.7)#443.9%(+74.6)#7,501
45.White Haven99.5%2.8%(+96.7)#453.9%(+95.6)#7,531
46.Frazer100.0%2.8%(+97.2)#463.9%(+96.1)#7,582
47.Noxon100.0%2.8%(+97.2)#473.9%(+96.1)#7,593
48.Elmo100.0%2.8%(+97.2)#483.9%(+96.1)#7,595
49.Rexford100.0%2.8%(+97.2)#493.9%(+96.1)#7,597
50.Santa Rita100.0%2.8%(+97.2)#503.9%(+96.1)#7,614

Common Questions

What are the Top 10 Cities with the Lowest Unemployment Rate Amomg Seniors Over the Age of 65 in Montana?
Top 10 Cities with the Lowest Unemployment Rate Amomg Seniors Over the Age of 65 in Montana are:
What city has the Lowest Unemployment Rate Amomg Seniors Over the Age of 65 in Montana?
Missoula has the Lowest Unemployment Rate Amomg Seniors Over the Age of 65 in Montana with 0.90%.
What is the Unemployment Rate Amomg Seniors Over the Age of 65 in the State of Montana?
Unemployment Rate Amomg Seniors Over the Age of 65 in Montana is 2.8%.
What is the Unemployment Rate Amomg Seniors Over the Age of 65 in the United States?
Unemployment Rate Amomg Seniors Over the Age of 65 in the United States is 3.9%.