Sumner, WA Map & Demographics
Sumner Map
Sumner Overview
$42,659
PER CAPITA INCOME
$93,500
AVG FAMILY INCOME
$83,285
AVG HOUSEHOLD INCOME
34.5%
WAGE / INCOME GAP [ % ]
65.5¢/ $1
WAGE / INCOME GAP [ $ ]
0.39
INEQUALITY / GINI INDEX
10,589
TOTAL POPULATION
5,104
MALE POPULATION
5,485
FEMALE POPULATION
93.05
MALES / 100 FEMALES
107.46
FEMALES / 100 MALES
37.0
MEDIAN AGE
3.0
AVG FAMILY SIZE
2.4
AVG HOUSEHOLD SIZE
5,406
LABOR FORCE [ PEOPLE ]
63.3%
PERCENT IN LABOR FORCE
4.4%
UNEMPLOYMENT RATE
Sumner Zip Codes
Income in Sumner
Income Overview in Sumner
Per Capita Income in Sumner is $42,659, while median incomes of families and households are $93,500 and $83,285 respectively.
| Characteristic | Number | Measure |
| Per Capita Income | 10,589 | $42,659 |
| Median Family Income | 2,700 | $93,500 |
| Mean Family Income | 2,700 | $116,010 |
| Median Household Income | 4,413 | $83,285 |
| Mean Household Income | 4,413 | $101,784 |
| Income Deficit | 2,700 | $0 |
| Wage / Income Gap (%) | 10,589 | 34.49% |
| Wage / Income Gap ($) | 10,589 | 65.51¢ per $1 |
| Gini / Inequality Index | 10,589 | 0.39 |
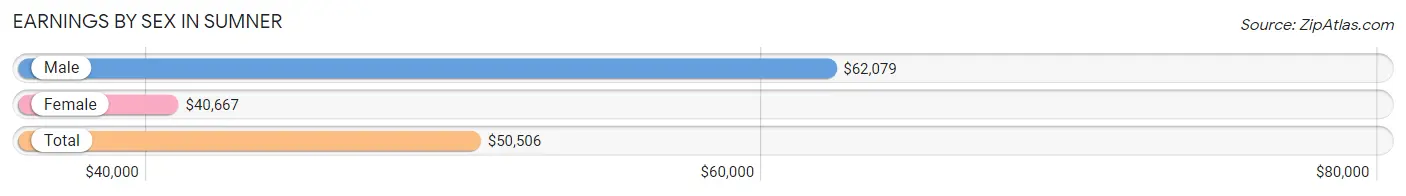
Earnings by Sex in Sumner
Average Earnings in Sumner are $50,506, $62,079 for men and $40,667 for women, a difference of 34.5%.
| Sex | Number | Average Earnings |
| Male | 3,119 (53.1%) | $62,079 |
| Female | 2,752 (46.9%) | $40,667 |
| Total | 5,871 (100.0%) | $50,506 |
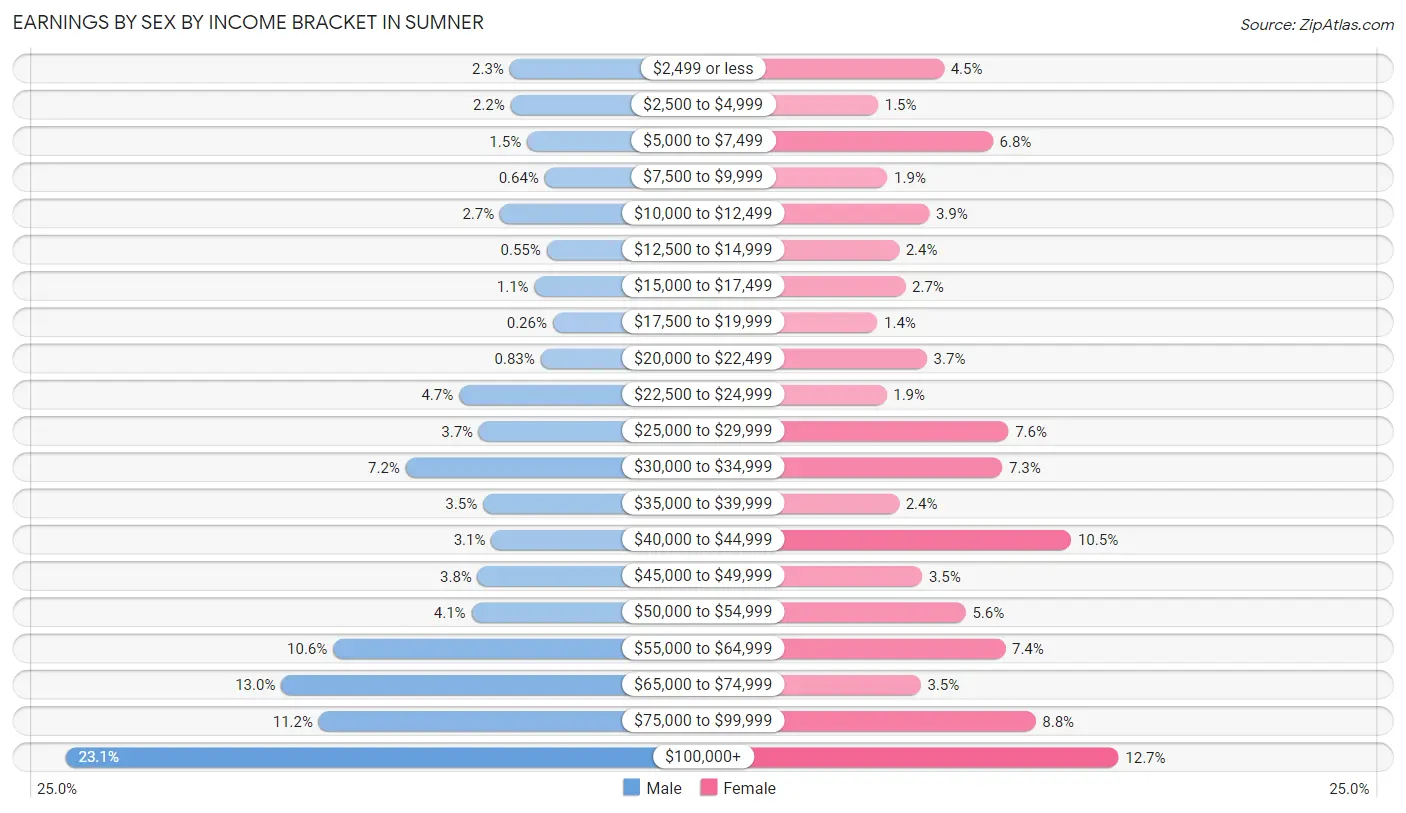
Earnings by Sex by Income Bracket in Sumner
The most common earnings brackets in Sumner are $100,000+ for men (720 | 23.1%) and $100,000+ for women (350 | 12.7%).
| Income | Male | Female |
| $2,499 or less | 71 (2.3%) | 125 (4.5%) |
| $2,500 to $4,999 | 70 (2.2%) | 40 (1.5%) |
| $5,000 to $7,499 | 46 (1.5%) | 188 (6.8%) |
| $7,500 to $9,999 | 20 (0.6%) | 52 (1.9%) |
| $10,000 to $12,499 | 85 (2.7%) | 106 (3.8%) |
| $12,500 to $14,999 | 17 (0.5%) | 67 (2.4%) |
| $15,000 to $17,499 | 35 (1.1%) | 75 (2.7%) |
| $17,500 to $19,999 | 8 (0.3%) | 39 (1.4%) |
| $20,000 to $22,499 | 26 (0.8%) | 103 (3.7%) |
| $22,500 to $24,999 | 145 (4.6%) | 51 (1.8%) |
| $25,000 to $29,999 | 116 (3.7%) | 208 (7.6%) |
| $30,000 to $34,999 | 223 (7.1%) | 200 (7.3%) |
| $35,000 to $39,999 | 110 (3.5%) | 67 (2.4%) |
| $40,000 to $44,999 | 98 (3.1%) | 289 (10.5%) |
| $45,000 to $49,999 | 118 (3.8%) | 97 (3.5%) |
| $50,000 to $54,999 | 127 (4.1%) | 153 (5.6%) |
| $55,000 to $64,999 | 329 (10.5%) | 204 (7.4%) |
| $65,000 to $74,999 | 405 (13.0%) | 95 (3.5%) |
| $75,000 to $99,999 | 350 (11.2%) | 243 (8.8%) |
| $100,000+ | 720 (23.1%) | 350 (12.7%) |
| Total | 3,119 (100.0%) | 2,752 (100.0%) |
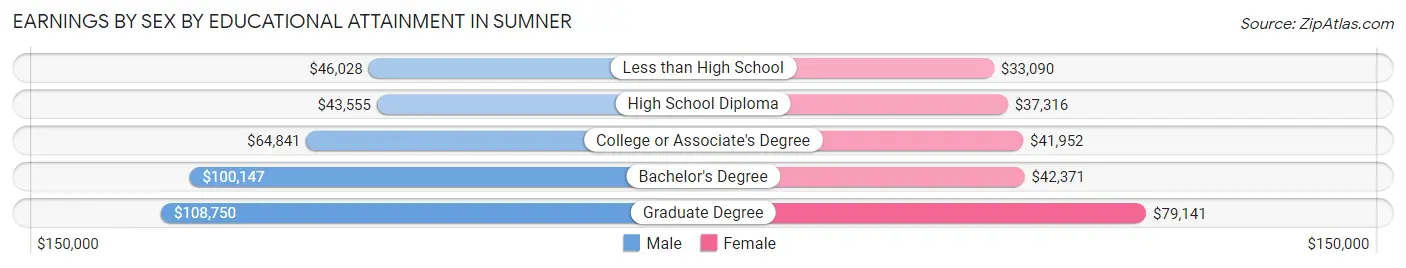
Earnings by Sex by Educational Attainment in Sumner
Average earnings in Sumner are $67,013 for men and $41,808 for women, a difference of 37.6%. Men with an educational attainment of graduate degree enjoy the highest average annual earnings of $108,750, while those with high school diploma education earn the least with $43,555. Women with an educational attainment of graduate degree earn the most with the average annual earnings of $79,141, while those with less than high school education have the smallest earnings of $33,090.
| Educational Attainment | Male Income | Female Income |
| Less than High School | $46,028 | $33,090 |
| High School Diploma | $43,555 | $37,316 |
| College or Associate's Degree | $64,841 | $41,952 |
| Bachelor's Degree | $100,147 | $42,371 |
| Graduate Degree | $108,750 | $79,141 |
| Total | $67,013 | $41,808 |
Family Income in Sumner
Family Income Brackets in Sumner
According to the Sumner family income data, there are 640 families falling into the $100,000 to $149,999 income range, which is the most common income bracket and makes up 23.7% of all families. Conversely, the $10,000 to $14,999 income bracket is the least frequent group with only 11 families (0.4%) belonging to this category.
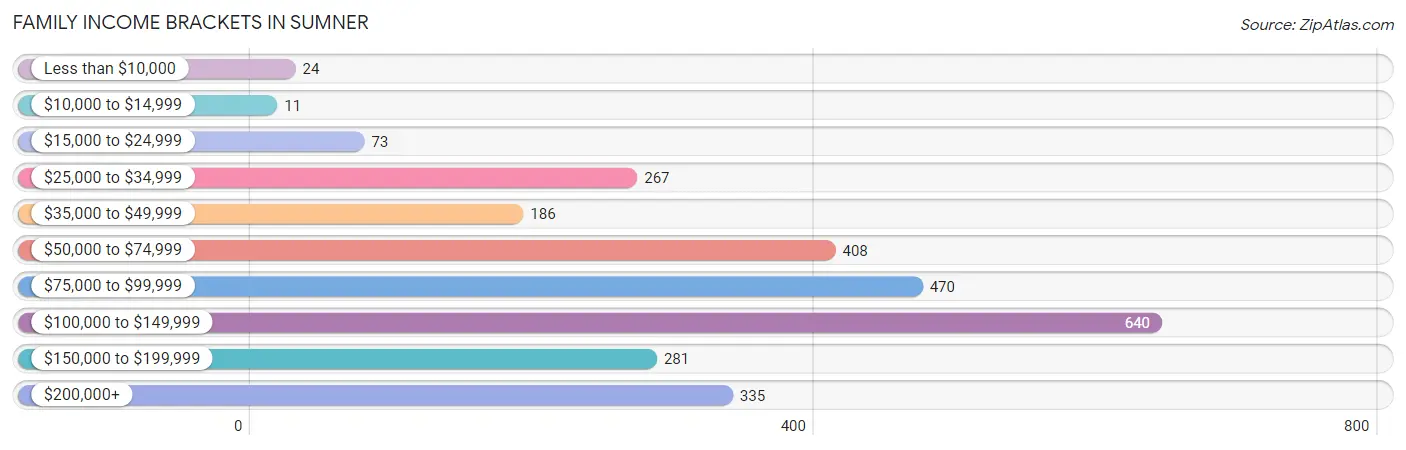
| Income Bracket | # Families | % Families |
| Less than $10,000 | 24 | 0.9% |
| $10,000 to $14,999 | 11 | 0.4% |
| $15,000 to $24,999 | 73 | 2.7% |
| $25,000 to $34,999 | 267 | 9.9% |
| $35,000 to $49,999 | 186 | 6.9% |
| $50,000 to $74,999 | 408 | 15.1% |
| $75,000 to $99,999 | 470 | 17.4% |
| $100,000 to $149,999 | 640 | 23.7% |
| $150,000 to $199,999 | 281 | 10.4% |
| $200,000+ | 335 | 12.4% |
Family Income by Famaliy Size in Sumner
6-person families (35 | 1.3%) account for the highest median family income in Sumner with $230,313 per family, while 2-person families (1,263 | 46.8%) have the highest median income of $40,425 per family member.
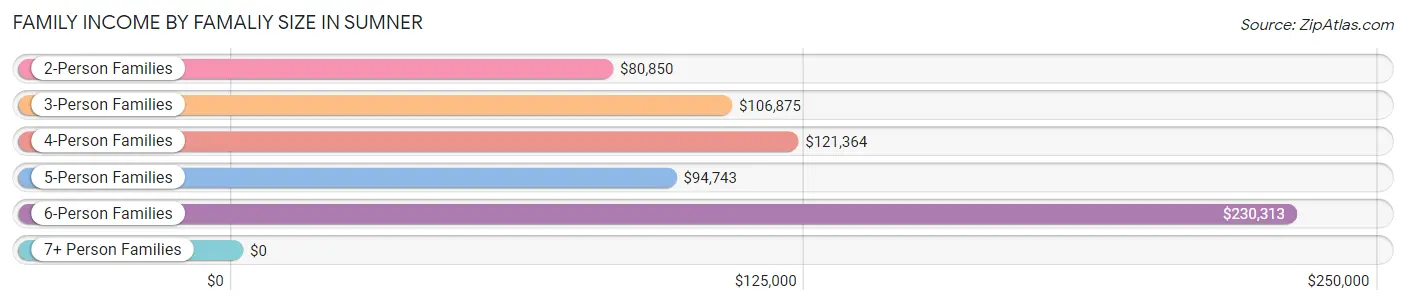
| Income Bracket | # Families | Median Income |
| 2-Person Families | 1,263 (46.8%) | $80,850 |
| 3-Person Families | 595 (22.0%) | $106,875 |
| 4-Person Families | 602 (22.3%) | $121,364 |
| 5-Person Families | 205 (7.6%) | $94,743 |
| 6-Person Families | 35 (1.3%) | $230,313 |
| 7+ Person Families | 0 (0.0%) | $0 |
| Total | 2,700 (100.0%) | $93,500 |
Family Income by Number of Earners in Sumner
The median family income in Sumner is $93,500, with families comprising 3+ earners (201) having the highest median family income of $196,442, while families with 1 earner (873) have the lowest median family income of $54,256, accounting for 7.4% and 32.3% of families, respectively.
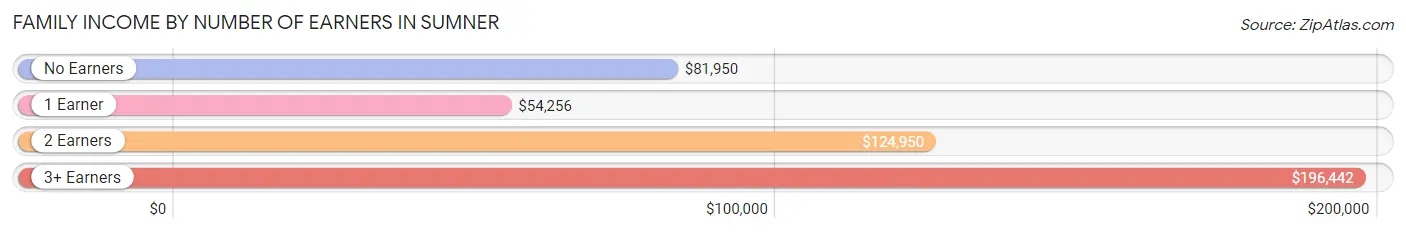
| Number of Earners | # Families | Median Income |
| No Earners | 365 (13.5%) | $81,950 |
| 1 Earner | 873 (32.3%) | $54,256 |
| 2 Earners | 1,261 (46.7%) | $124,950 |
| 3+ Earners | 201 (7.4%) | $196,442 |
| Total | 2,700 (100.0%) | $93,500 |
Household Income in Sumner
Household Income Brackets in Sumner
With 1,028 households falling in the category, the $100,000 to $149,999 income range is the most frequent in Sumner, accounting for 23.3% of all households. In contrast, only 75 households (1.7%) fall into the less than $10,000 income bracket, making it the least populous group.
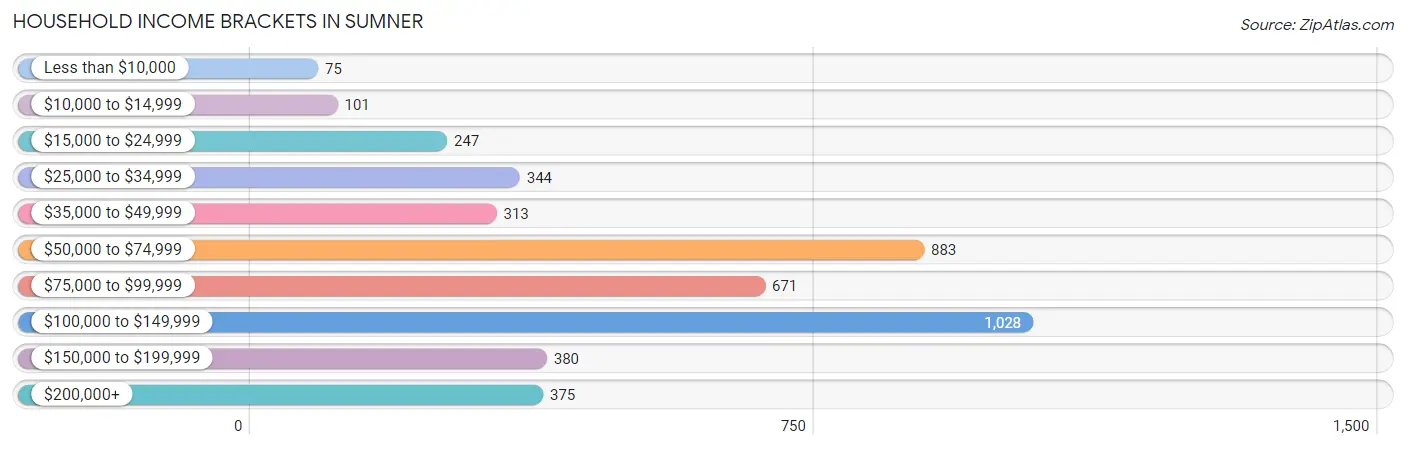
| Income Bracket | # Households | % Households |
| Less than $10,000 | 75 | 1.7% |
| $10,000 to $14,999 | 101 | 2.3% |
| $15,000 to $24,999 | 247 | 5.6% |
| $25,000 to $34,999 | 344 | 7.8% |
| $35,000 to $49,999 | 313 | 7.1% |
| $50,000 to $74,999 | 883 | 20.0% |
| $75,000 to $99,999 | 671 | 15.2% |
| $100,000 to $149,999 | 1,028 | 23.3% |
| $150,000 to $199,999 | 380 | 8.6% |
| $200,000+ | 375 | 8.5% |
Household Income by Householder Age in Sumner
The median household income in Sumner is $83,285, with the highest median household income of $95,412 found in the 25 to 44 years age bracket for the primary householder. A total of 1,551 households (35.1%) fall into this category. Meanwhile, the 15 to 24 years age bracket for the primary householder has the lowest median household income of $57,685, with 114 households (2.6%) in this group.
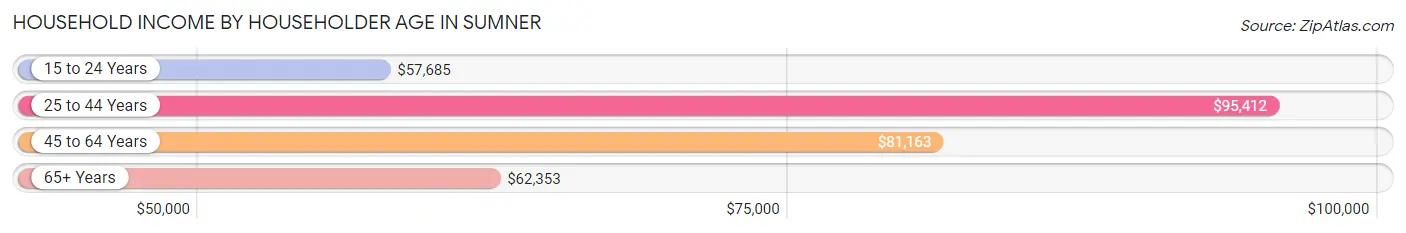
| Income Bracket | # Households | Median Income |
| 15 to 24 Years | 114 (2.6%) | $57,685 |
| 25 to 44 Years | 1,551 (35.1%) | $95,412 |
| 45 to 64 Years | 1,690 (38.3%) | $81,163 |
| 65+ Years | 1,058 (24.0%) | $62,353 |
| Total | 4,413 (100.0%) | $83,285 |
Poverty in Sumner
Income Below Poverty by Sex and Age in Sumner
With 5.1% poverty level for males and 6.7% for females among the residents of Sumner, 6 to 11 year old males and under 5 year old females are the most vulnerable to poverty, with 61 males (16.4%) and 65 females (14.7%) in their respective age groups living below the poverty level.
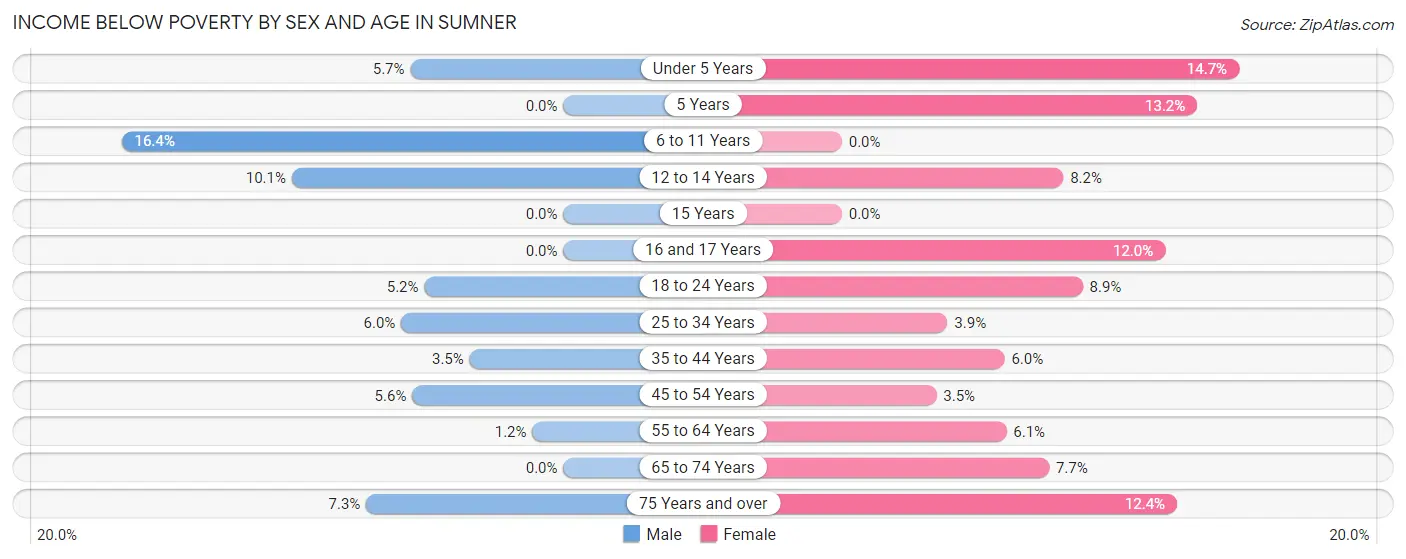
| Age Bracket | Male | Female |
| Under 5 Years | 15 (5.7%) | 65 (14.7%) |
| 5 Years | 0 (0.0%) | 12 (13.2%) |
| 6 to 11 Years | 61 (16.4%) | 0 (0.0%) |
| 12 to 14 Years | 12 (10.1%) | 12 (8.2%) |
| 15 Years | 0 (0.0%) | 0 (0.0%) |
| 16 and 17 Years | 0 (0.0%) | 15 (12.0%) |
| 18 to 24 Years | 16 (5.2%) | 33 (8.9%) |
| 25 to 34 Years | 65 (6.0%) | 39 (3.9%) |
| 35 to 44 Years | 25 (3.5%) | 38 (6.0%) |
| 45 to 54 Years | 37 (5.6%) | 28 (3.5%) |
| 55 to 64 Years | 7 (1.1%) | 31 (6.1%) |
| 65 to 74 Years | 0 (0.0%) | 43 (7.7%) |
| 75 Years and over | 18 (7.3%) | 49 (12.4%) |
| Total | 256 (5.1%) | 365 (6.7%) |
Income Above Poverty by Sex and Age in Sumner
According to the poverty statistics in Sumner, males aged 5 years and females aged 6 to 11 years are the age groups that are most secure financially, with 100.0% of males and 100.0% of females in these age groups living above the poverty line.
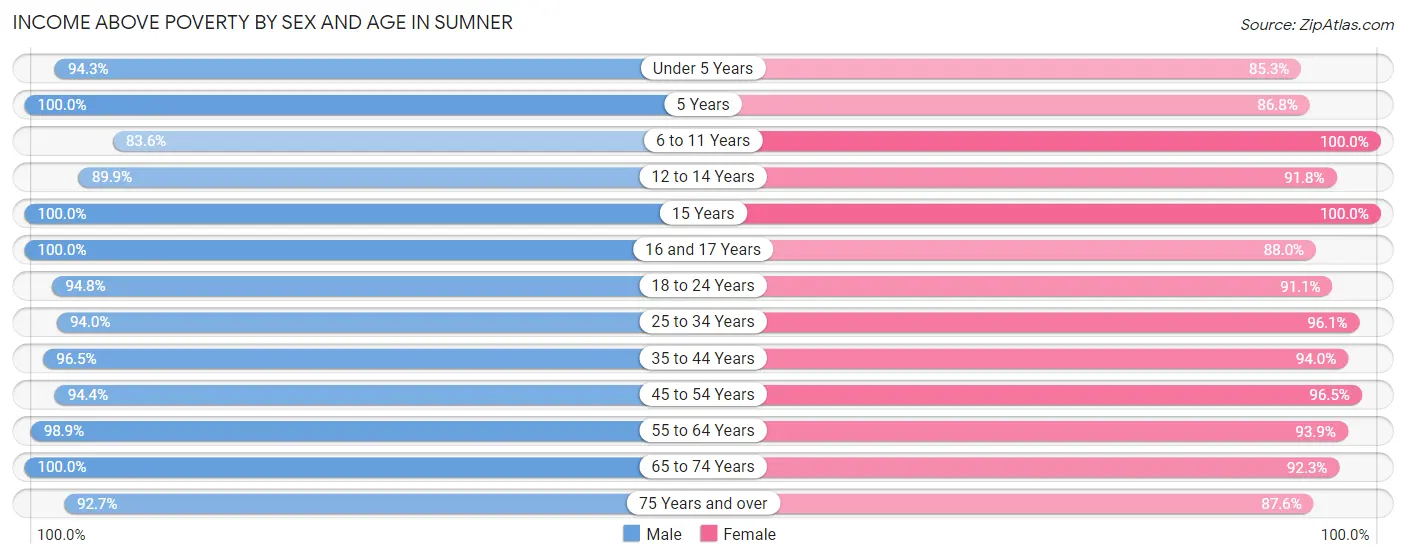
| Age Bracket | Male | Female |
| Under 5 Years | 249 (94.3%) | 376 (85.3%) |
| 5 Years | 24 (100.0%) | 79 (86.8%) |
| 6 to 11 Years | 311 (83.6%) | 399 (100.0%) |
| 12 to 14 Years | 107 (89.9%) | 134 (91.8%) |
| 15 Years | 111 (100.0%) | 11 (100.0%) |
| 16 and 17 Years | 117 (100.0%) | 110 (88.0%) |
| 18 to 24 Years | 294 (94.8%) | 336 (91.1%) |
| 25 to 34 Years | 1,014 (94.0%) | 957 (96.1%) |
| 35 to 44 Years | 694 (96.5%) | 591 (94.0%) |
| 45 to 54 Years | 623 (94.4%) | 769 (96.5%) |
| 55 to 64 Years | 601 (98.9%) | 476 (93.9%) |
| 65 to 74 Years | 407 (100.0%) | 516 (92.3%) |
| 75 Years and over | 228 (92.7%) | 345 (87.6%) |
| Total | 4,780 (94.9%) | 5,099 (93.3%) |
Income Below Poverty Among Married-Couple Families in Sumner
The poverty statistics for married-couple families in Sumner show that 1.6% or 29 of the total 1,853 families live below the poverty line. Families with 1 or 2 children have the highest poverty rate of 2.4%, comprising of 15 families. On the other hand, families with 3 or 4 children have the lowest poverty rate of 0.0%, which includes 0 families.
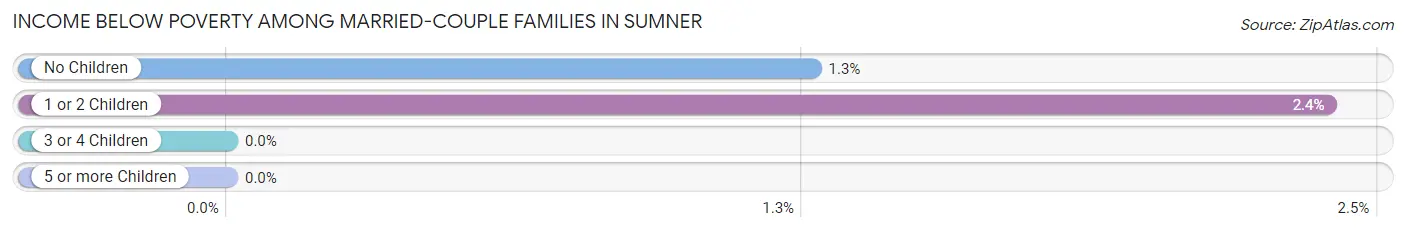
| Children | Above Poverty | Below Poverty |
| No Children | 1,089 (98.7%) | 14 (1.3%) |
| 1 or 2 Children | 613 (97.6%) | 15 (2.4%) |
| 3 or 4 Children | 122 (100.0%) | 0 (0.0%) |
| 5 or more Children | 0 (0.0%) | 0 (0.0%) |
| Total | 1,824 (98.4%) | 29 (1.6%) |
Income Below Poverty Among Single-Parent Households in Sumner
According to the poverty data in Sumner, 4.0% or 13 single-father households and 9.2% or 48 single-mother households are living below the poverty line. Among single-father households, those with 1 or 2 children have the highest poverty rate, with 13 households (11.1%) experiencing poverty. Likewise, among single-mother households, those with 3 or 4 children have the highest poverty rate, with 36 households (54.5%) falling below the poverty line.
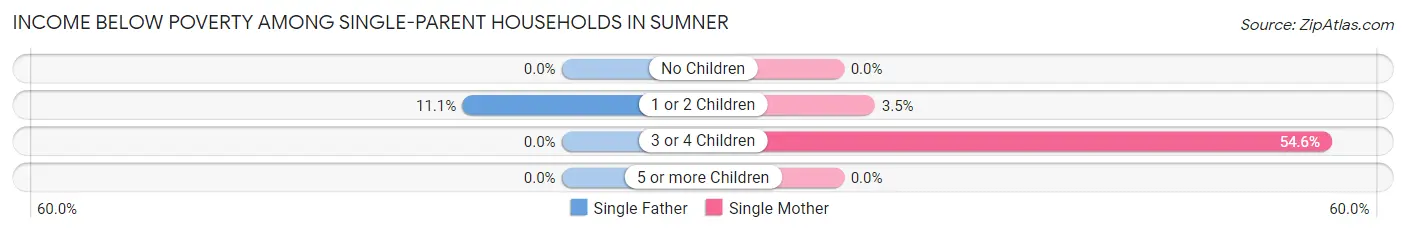
| Children | Single Father | Single Mother |
| No Children | 0 (0.0%) | 0 (0.0%) |
| 1 or 2 Children | 13 (11.1%) | 12 (3.5%) |
| 3 or 4 Children | 0 (0.0%) | 36 (54.5%) |
| 5 or more Children | 0 (0.0%) | 0 (0.0%) |
| Total | 13 (4.0%) | 48 (9.2%) |
Income Below Poverty Among Married-Couple vs Single-Parent Households in Sumner
The poverty data for Sumner shows that 29 of the married-couple family households (1.6%) and 61 of the single-parent households (7.2%) are living below the poverty level. Within the married-couple family households, those with 1 or 2 children have the highest poverty rate, with 15 households (2.4%) falling below the poverty line. Among the single-parent households, those with 3 or 4 children have the highest poverty rate, with 36 household (54.5%) living below poverty.
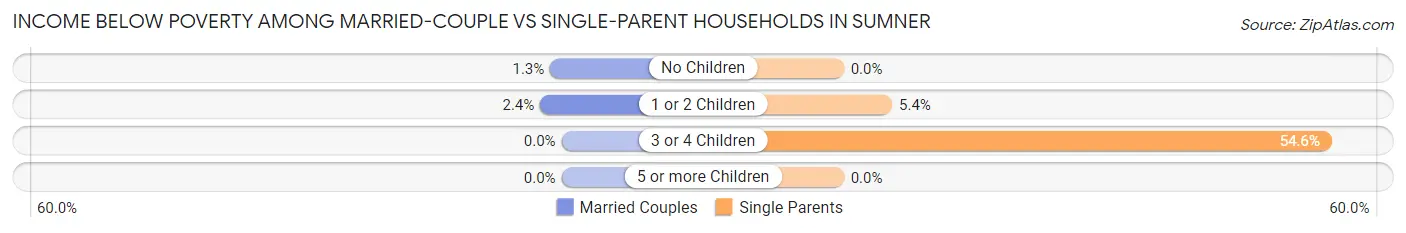
| Children | Married-Couple Families | Single-Parent Households |
| No Children | 14 (1.3%) | 0 (0.0%) |
| 1 or 2 Children | 15 (2.4%) | 25 (5.4%) |
| 3 or 4 Children | 0 (0.0%) | 36 (54.5%) |
| 5 or more Children | 0 (0.0%) | 0 (0.0%) |
| Total | 29 (1.6%) | 61 (7.2%) |
Race in Sumner
The most populous races in Sumner are White / Caucasian (8,646 | 81.7%), Hispanic or Latino (1,901 | 17.9%), and Two or more Races (1,149 | 10.8%).
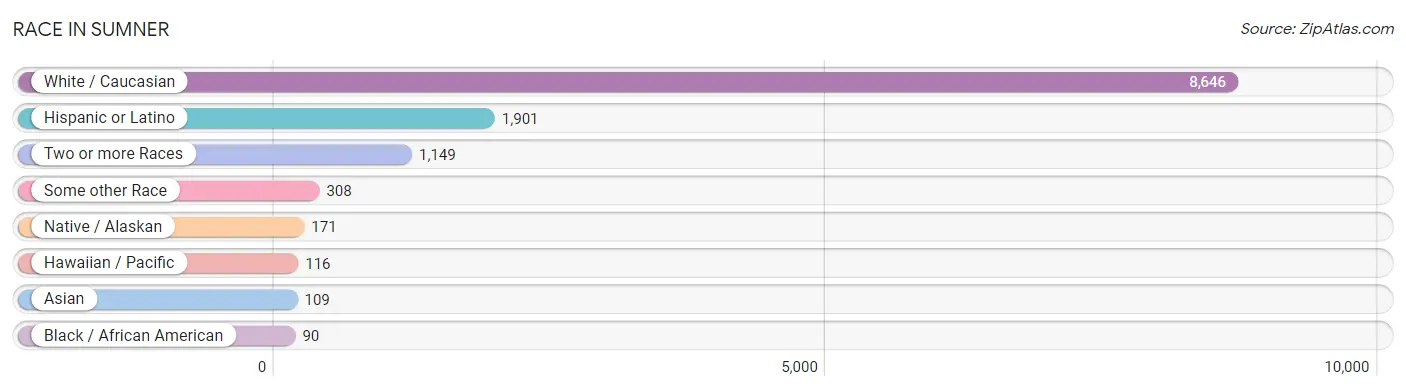
| Race | # Population | % Population |
| Asian | 109 | 1.0% |
| Black / African American | 90 | 0.9% |
| Hawaiian / Pacific | 116 | 1.1% |
| Hispanic or Latino | 1,901 | 17.9% |
| Native / Alaskan | 171 | 1.6% |
| White / Caucasian | 8,646 | 81.7% |
| Two or more Races | 1,149 | 10.8% |
| Some other Race | 308 | 2.9% |
| Total | 10,589 | 100.0% |
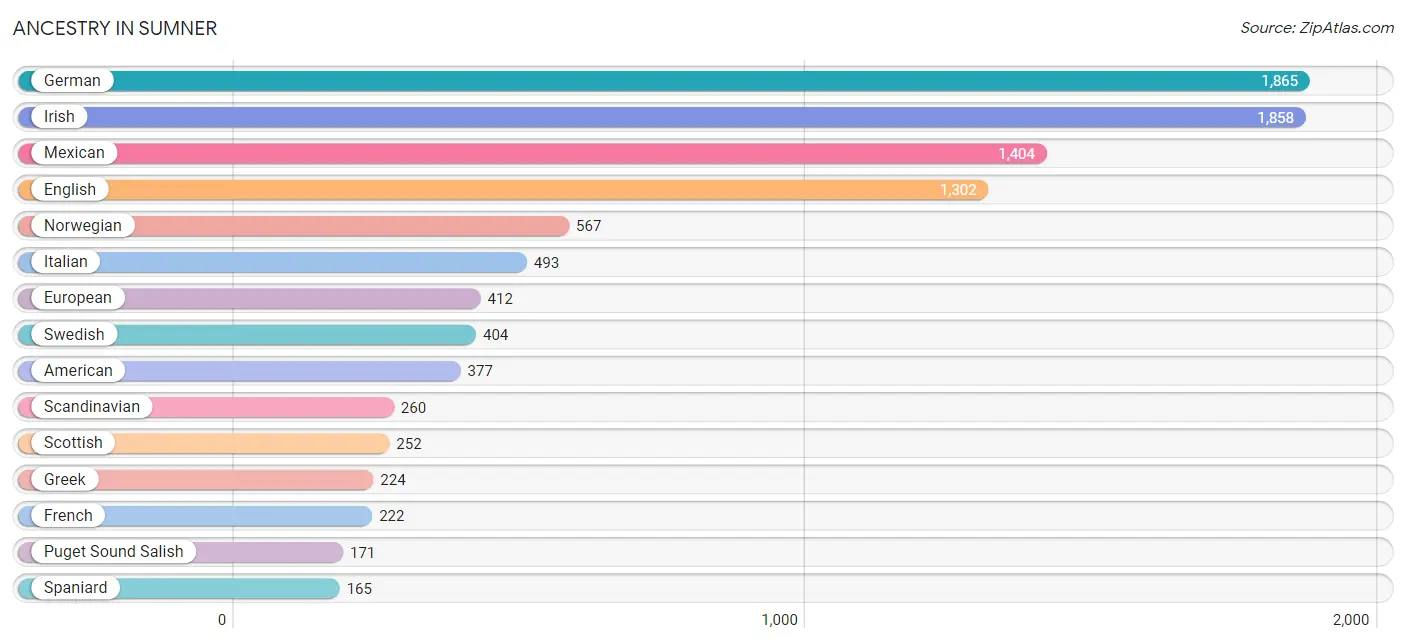
Ancestry in Sumner
The most populous ancestries reported in Sumner are German (1,865 | 17.6%), Irish (1,858 | 17.5%), Mexican (1,404 | 13.3%), English (1,302 | 12.3%), and Norwegian (567 | 5.3%), together accounting for 66.1% of all Sumner residents.
| Ancestry | # Population | % Population |
| African | 26 | 0.3% |
| American | 377 | 3.6% |
| Arab | 22 | 0.2% |
| Austrian | 27 | 0.3% |
| Bahamian | 53 | 0.5% |
| Bhutanese | 30 | 0.3% |
| Blackfeet | 38 | 0.4% |
| Brazilian | 47 | 0.4% |
| British | 153 | 1.4% |
| Burmese | 13 | 0.1% |
| Canadian | 14 | 0.1% |
| Central American | 75 | 0.7% |
| Cherokee | 12 | 0.1% |
| Choctaw | 93 | 0.9% |
| Comanche | 8 | 0.1% |
| Croatian | 7 | 0.1% |
| Cuban | 18 | 0.2% |
| Czech | 54 | 0.5% |
| Delaware | 37 | 0.4% |
| Dutch | 92 | 0.9% |
| Eastern European | 6 | 0.1% |
| English | 1,302 | 12.3% |
| European | 412 | 3.9% |
| Finnish | 7 | 0.1% |
| French | 222 | 2.1% |
| French Canadian | 80 | 0.8% |
| German | 1,865 | 17.6% |
| Greek | 224 | 2.1% |
| Guamanian / Chamorro | 5 | 0.1% |
| Honduran | 33 | 0.3% |
| Irish | 1,858 | 17.5% |
| Italian | 493 | 4.7% |
| Japanese | 99 | 0.9% |
| Korean | 134 | 1.3% |
| Lebanese | 22 | 0.2% |
| Lithuanian | 33 | 0.3% |
| Macedonian | 15 | 0.1% |
| Malaysian | 11 | 0.1% |
| Mexican | 1,404 | 13.3% |
| Native Hawaiian | 74 | 0.7% |
| Nicaraguan | 42 | 0.4% |
| Norwegian | 567 | 5.3% |
| Polish | 47 | 0.4% |
| Portuguese | 21 | 0.2% |
| Puerto Rican | 83 | 0.8% |
| Puget Sound Salish | 171 | 1.6% |
| Russian | 128 | 1.2% |
| Scandinavian | 260 | 2.5% |
| Scotch-Irish | 85 | 0.8% |
| Scottish | 252 | 2.4% |
| Spaniard | 165 | 1.6% |
| Subsaharan African | 37 | 0.4% |
| Swedish | 404 | 3.8% |
| Swiss | 40 | 0.4% |
| Thai | 14 | 0.1% |
| Tlingit-Haida | 30 | 0.3% |
| Tsimshian | 10 | 0.1% |
| Ukrainian | 115 | 1.1% |
| Welsh | 76 | 0.7% | View All 59 Rows |
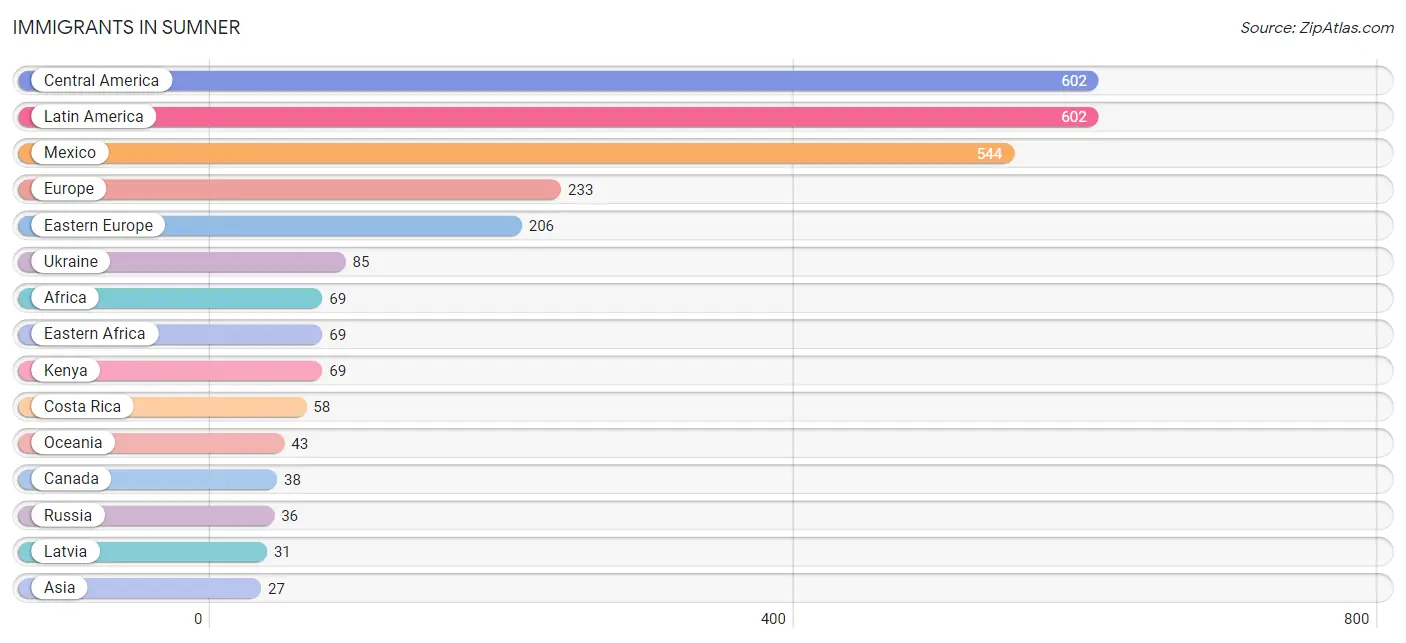
Immigrants in Sumner
The most numerous immigrant groups reported in Sumner came from Central America (602 | 5.7%), Latin America (602 | 5.7%), Mexico (544 | 5.1%), Europe (233 | 2.2%), and Eastern Europe (206 | 1.9%), together accounting for 20.7% of all Sumner residents.
| Immigration Origin | # Population | % Population |
| Africa | 69 | 0.6% |
| Asia | 27 | 0.3% |
| Belarus | 21 | 0.2% |
| Canada | 38 | 0.4% |
| Central America | 602 | 5.7% |
| Costa Rica | 58 | 0.5% |
| Eastern Africa | 69 | 0.6% |
| Eastern Asia | 6 | 0.1% |
| Eastern Europe | 206 | 1.9% |
| Europe | 233 | 2.2% |
| Kenya | 69 | 0.6% |
| Korea | 6 | 0.1% |
| Laos | 11 | 0.1% |
| Latin America | 602 | 5.7% |
| Latvia | 31 | 0.3% |
| Mexico | 544 | 5.1% |
| Moldova | 23 | 0.2% |
| Northern Europe | 27 | 0.3% |
| Norway | 6 | 0.1% |
| Oceania | 43 | 0.4% |
| Poland | 10 | 0.1% |
| Russia | 36 | 0.3% |
| South Eastern Asia | 21 | 0.2% |
| Thailand | 10 | 0.1% |
| Ukraine | 85 | 0.8% | View All 25 Rows |
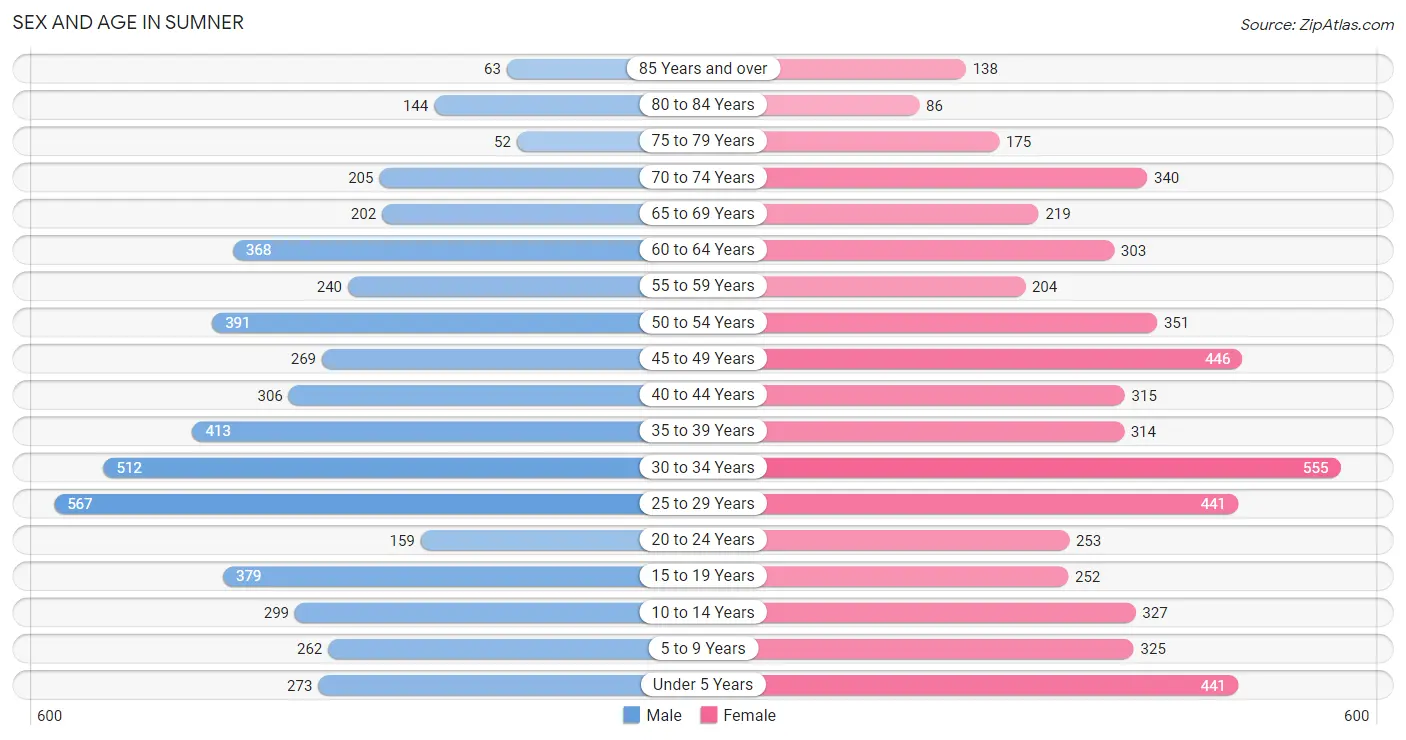
Sex and Age in Sumner
Sex and Age in Sumner
The most populous age groups in Sumner are 25 to 29 Years (567 | 11.1%) for men and 30 to 34 Years (555 | 10.1%) for women.
| Age Bracket | Male | Female |
| Under 5 Years | 273 (5.3%) | 441 (8.0%) |
| 5 to 9 Years | 262 (5.1%) | 325 (5.9%) |
| 10 to 14 Years | 299 (5.9%) | 327 (6.0%) |
| 15 to 19 Years | 379 (7.4%) | 252 (4.6%) |
| 20 to 24 Years | 159 (3.1%) | 253 (4.6%) |
| 25 to 29 Years | 567 (11.1%) | 441 (8.0%) |
| 30 to 34 Years | 512 (10.0%) | 555 (10.1%) |
| 35 to 39 Years | 413 (8.1%) | 314 (5.7%) |
| 40 to 44 Years | 306 (6.0%) | 315 (5.7%) |
| 45 to 49 Years | 269 (5.3%) | 446 (8.1%) |
| 50 to 54 Years | 391 (7.7%) | 351 (6.4%) |
| 55 to 59 Years | 240 (4.7%) | 204 (3.7%) |
| 60 to 64 Years | 368 (7.2%) | 303 (5.5%) |
| 65 to 69 Years | 202 (4.0%) | 219 (4.0%) |
| 70 to 74 Years | 205 (4.0%) | 340 (6.2%) |
| 75 to 79 Years | 52 (1.0%) | 175 (3.2%) |
| 80 to 84 Years | 144 (2.8%) | 86 (1.6%) |
| 85 Years and over | 63 (1.2%) | 138 (2.5%) |
| Total | 5,104 (100.0%) | 5,485 (100.0%) |
Families and Households in Sumner
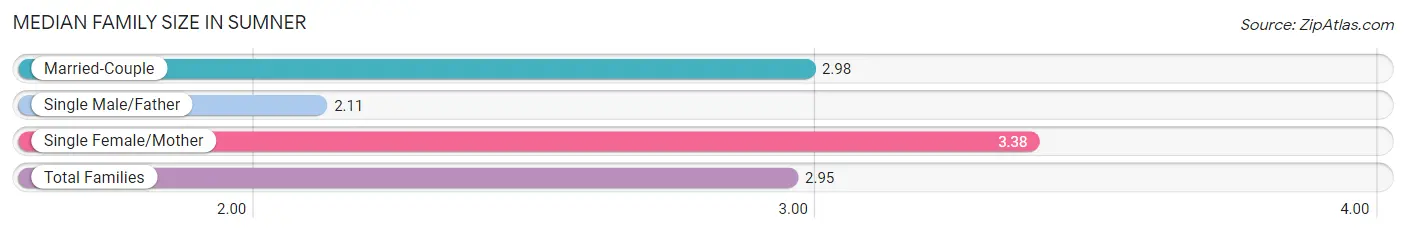
Median Family Size in Sumner
The median family size in Sumner is 2.95 persons per family, with single female/mother families (522 | 19.3%) accounting for the largest median family size of 3.38 persons per family. On the other hand, single male/father families (325 | 12.0%) represent the smallest median family size with 2.11 persons per family.
| Family Type | # Families | Family Size |
| Married-Couple | 1,853 (68.6%) | 2.98 |
| Single Male/Father | 325 (12.0%) | 2.11 |
| Single Female/Mother | 522 (19.3%) | 3.38 |
| Total Families | 2,700 (100.0%) | 2.95 |
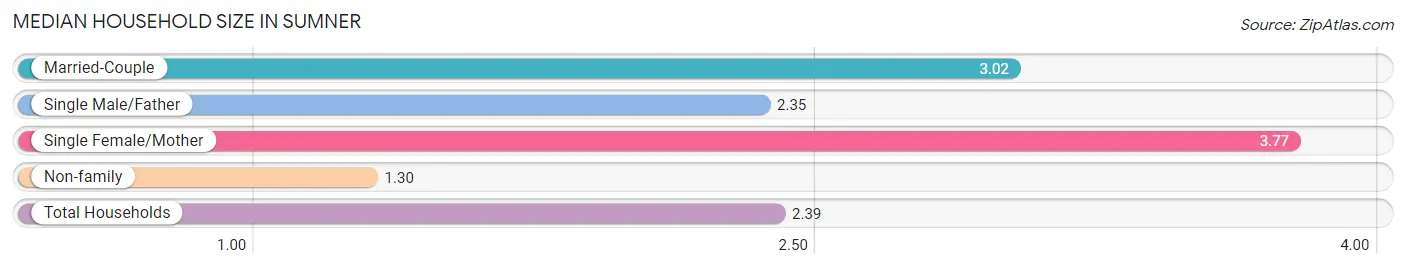
Median Household Size in Sumner
The median household size in Sumner is 2.39 persons per household, with single female/mother households (522 | 11.8%) accounting for the largest median household size of 3.77 persons per household. non-family households (1,713 | 38.8%) represent the smallest median household size with 1.30 persons per household.
| Household Type | # Households | Household Size |
| Married-Couple | 1,853 (42.0%) | 3.02 |
| Single Male/Father | 325 (7.4%) | 2.35 |
| Single Female/Mother | 522 (11.8%) | 3.77 |
| Non-family | 1,713 (38.8%) | 1.30 |
| Total Households | 4,413 (100.0%) | 2.39 |
Household Size by Marriage Status in Sumner
Out of a total of 4,413 households in Sumner, 2,700 (61.2%) are family households, while 1,713 (38.8%) are nonfamily households. The most numerous type of family households are 2-person households, comprising 1,157, and the most common type of nonfamily households are 1-person households, comprising 1,313.
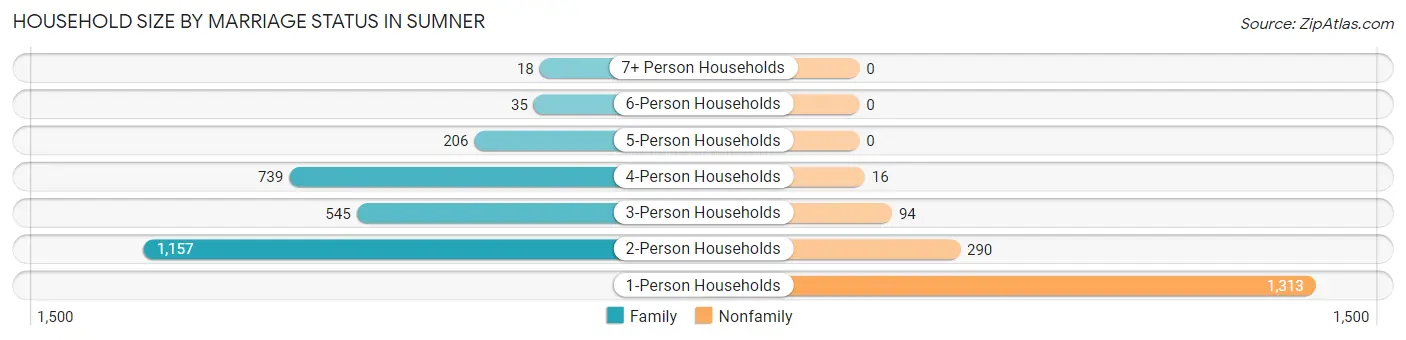
| Household Size | Family Households | Nonfamily Households |
| 1-Person Households | - | 1,313 (29.7%) |
| 2-Person Households | 1,157 (26.2%) | 290 (6.6%) |
| 3-Person Households | 545 (12.3%) | 94 (2.1%) |
| 4-Person Households | 739 (16.8%) | 16 (0.4%) |
| 5-Person Households | 206 (4.7%) | 0 (0.0%) |
| 6-Person Households | 35 (0.8%) | 0 (0.0%) |
| 7+ Person Households | 18 (0.4%) | 0 (0.0%) |
| Total | 2,700 (61.2%) | 1,713 (38.8%) |
Female Fertility in Sumner
Fertility by Age in Sumner
Average fertility rate in Sumner is 58.0 births per 1,000 women. Women in the age bracket of 20 to 34 years have the highest fertility rate with 79.0 births per 1,000 women. Women in the age bracket of 20 to 34 years acount for 65.6% of all women with births.
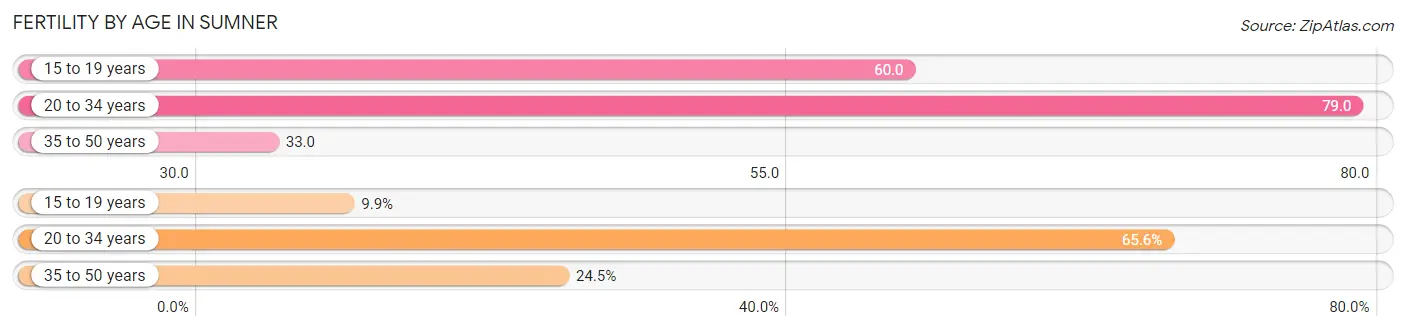
| Age Bracket | Women with Births | Births / 1,000 Women |
| 15 to 19 years | 15 (9.9%) | 60.0 |
| 20 to 34 years | 99 (65.6%) | 79.0 |
| 35 to 50 years | 37 (24.5%) | 33.0 |
| Total | 151 (100.0%) | 58.0 |
Fertility by Age by Marriage Status in Sumner
76.8% of women with births (151) in Sumner are married. The highest percentage of unmarried women with births falls into 35 to 50 years age bracket with 51.3% of them unmarried at the time of birth, while the lowest percentage of unmarried women with births belong to 15 to 19 years age bracket with 0.0% of them unmarried.
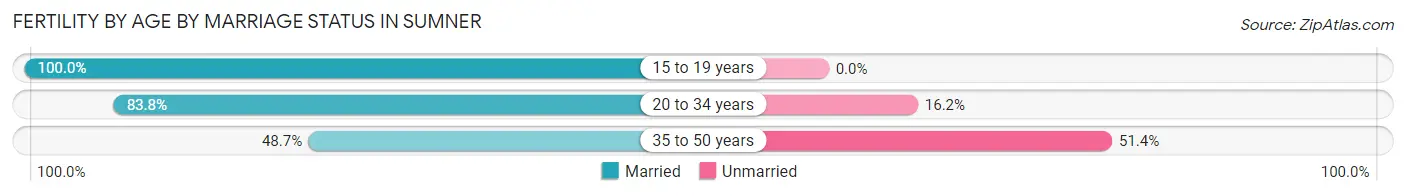
| Age Bracket | Married | Unmarried |
| 15 to 19 years | 15 (100.0%) | 0 (0.0%) |
| 20 to 34 years | 83 (83.8%) | 16 (16.2%) |
| 35 to 50 years | 18 (48.6%) | 19 (51.3%) |
| Total | 116 (76.8%) | 35 (23.2%) |
Fertility by Education in Sumner
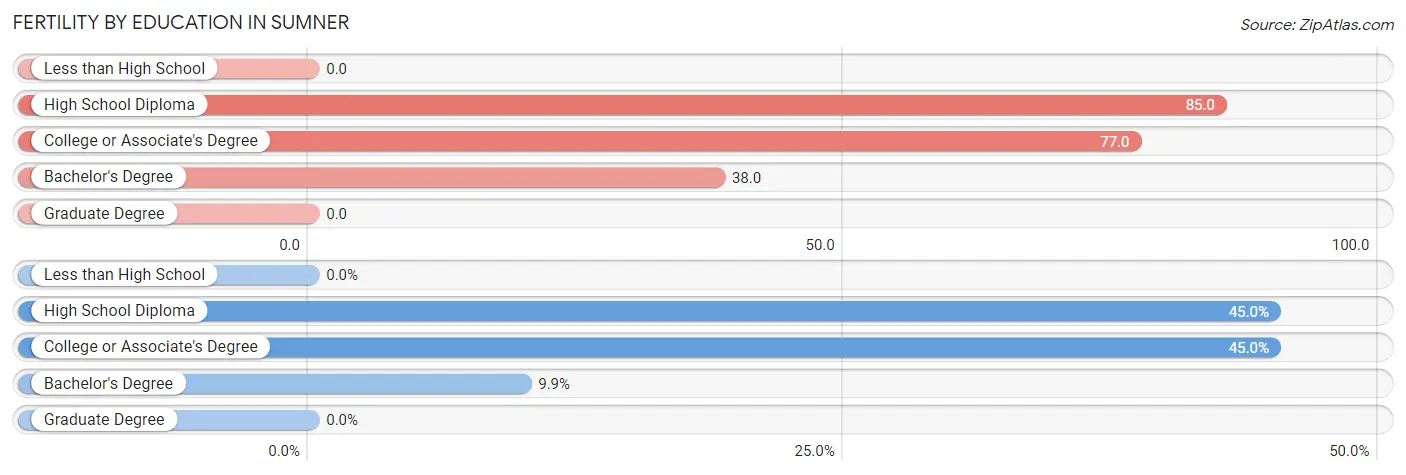
| Educational Attainment | Women with Births | Births / 1,000 Women |
| Less than High School | 0 (0.0%) | 0.0 |
| High School Diploma | 68 (45.0%) | 85.0 |
| College or Associate's Degree | 68 (45.0%) | 77.0 |
| Bachelor's Degree | 15 (9.9%) | 38.0 |
| Graduate Degree | 0 (0.0%) | 0.0 |
| Total | 151 (100.0%) | 58.0 |
Fertility by Education by Marriage Status in Sumner
23.2% of women with births in Sumner are unmarried. Women with the educational attainment of bachelor's degree are most likely to be married with 100.0% of them married at childbirth, while women with the educational attainment of high school diploma are least likely to be married with 27.9% of them unmarried at childbirth.
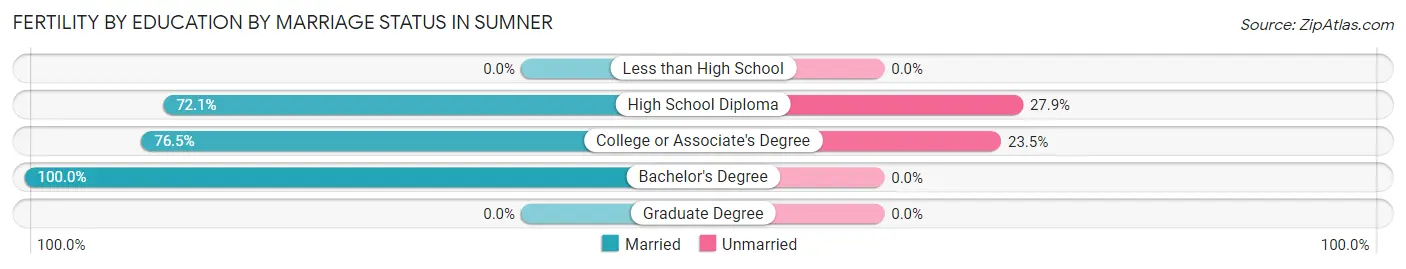
| Educational Attainment | Married | Unmarried |
| Less than High School | 0 (0.0%) | 0 (0.0%) |
| High School Diploma | 49 (72.1%) | 19 (27.9%) |
| College or Associate's Degree | 52 (76.5%) | 16 (23.5%) |
| Bachelor's Degree | 15 (100.0%) | 0 (0.0%) |
| Graduate Degree | 0 (0.0%) | 0 (0.0%) |
| Total | 116 (76.8%) | 35 (23.2%) |
Employment Characteristics in Sumner
Employment by Class of Employer in Sumner
Among the 5,009 employed individuals in Sumner, private company employees (3,322 | 66.3%), not-for-profit organizations (368 | 7.3%), and local government employees (330 | 6.6%) make up the most common classes of employment.
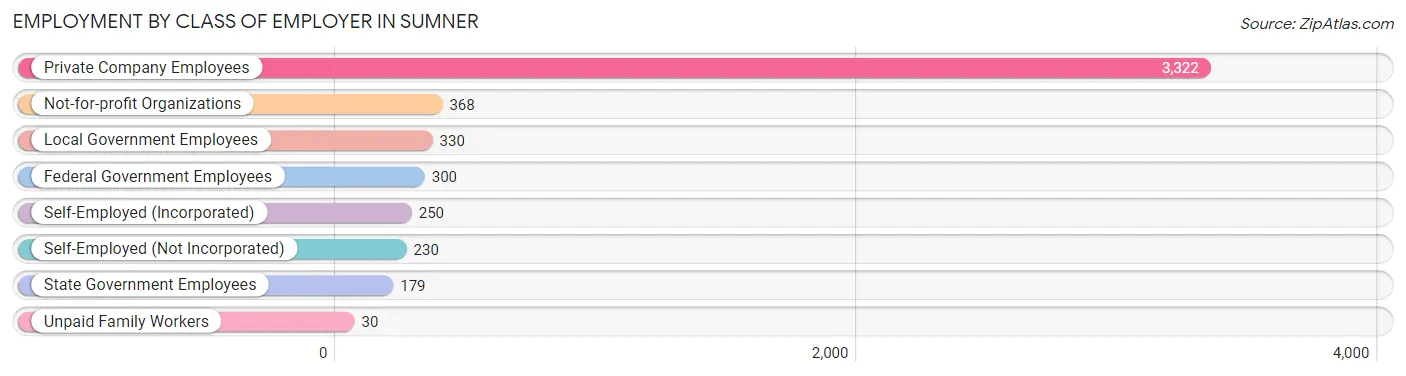
| Employer Class | # Employees | % Employees |
| Private Company Employees | 3,322 | 66.3% |
| Self-Employed (Incorporated) | 250 | 5.0% |
| Self-Employed (Not Incorporated) | 230 | 4.6% |
| Not-for-profit Organizations | 368 | 7.3% |
| Local Government Employees | 330 | 6.6% |
| State Government Employees | 179 | 3.6% |
| Federal Government Employees | 300 | 6.0% |
| Unpaid Family Workers | 30 | 0.6% |
| Total | 5,009 | 100.0% |
Employment Status by Age in Sumner
According to the labor force statistics for Sumner, out of the total population over 16 years of age (8,540), 63.3% or 5,406 individuals are in the labor force, with 4.4% or 238 of them unemployed. The age group with the highest labor force participation rate is 30 to 34 years, with 90.3% or 964 individuals in the labor force. Within the labor force, the 20 to 24 years age range has the highest percentage of unemployed individuals, with 16.5% or 45 of them being unemployed.
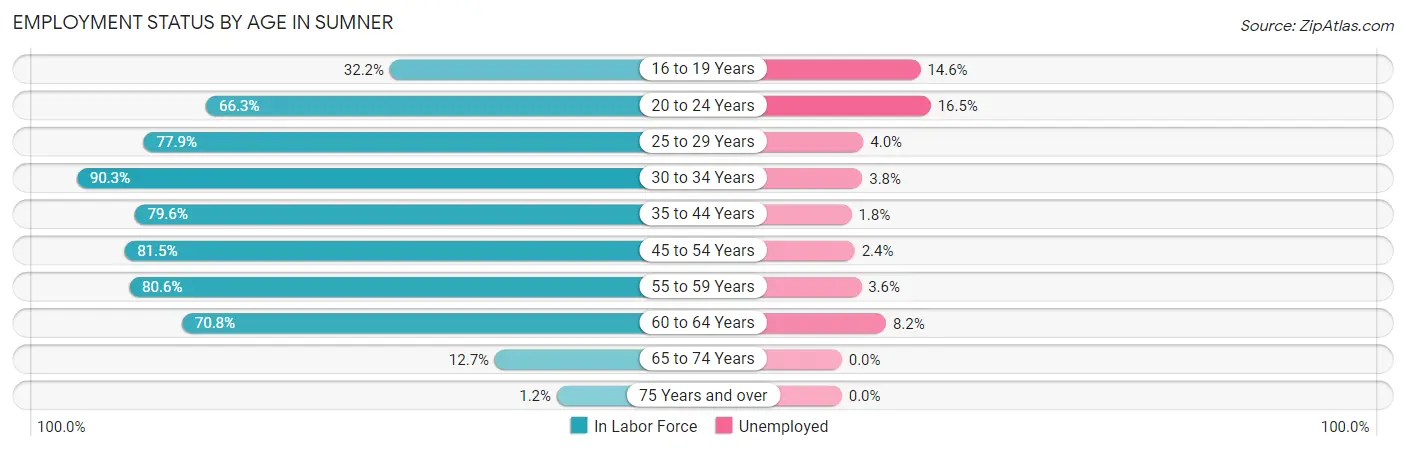
| Age Bracket | In Labor Force | Unemployed |
| 16 to 19 Years | 164 (32.2%) | 24 (14.6%) |
| 20 to 24 Years | 273 (66.3%) | 45 (16.5%) |
| 25 to 29 Years | 785 (77.9%) | 31 (4.0%) |
| 30 to 34 Years | 964 (90.3%) | 37 (3.8%) |
| 35 to 44 Years | 1,073 (79.6%) | 19 (1.8%) |
| 45 to 54 Years | 1,187 (81.5%) | 28 (2.4%) |
| 55 to 59 Years | 358 (80.6%) | 13 (3.6%) |
| 60 to 64 Years | 475 (70.8%) | 39 (8.2%) |
| 65 to 74 Years | 123 (12.7%) | 0 (0.0%) |
| 75 Years and over | 8 (1.2%) | 0 (0.0%) |
| Total | 5,406 (63.3%) | 238 (4.4%) |
Employment Status by Educational Attainment in Sumner
According to labor force statistics for Sumner, 80.8% of individuals (4,844) out of the total population between 25 and 64 years of age (5,995) are in the labor force, with 3.5% or 170 of them being unemployed. The group with the highest labor force participation rate are those with the educational attainment of college / associate degree, with 84.7% or 1,743 individuals in the labor force. Within the labor force, individuals with high school diploma education have the highest percentage of unemployment, with 7.2% or 99 of them being unemployed.
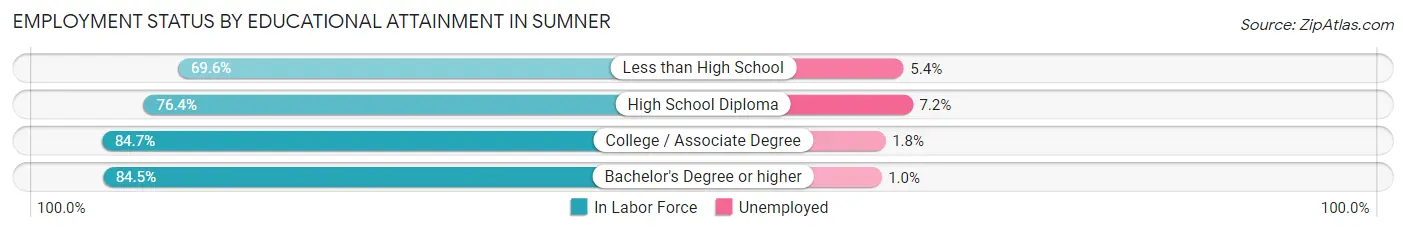
| Educational Attainment | In Labor Force | Unemployed |
| Less than High School | 389 (69.6%) | 30 (5.4%) |
| High School Diploma | 1,378 (76.4%) | 130 (7.2%) |
| College / Associate Degree | 1,743 (84.7%) | 37 (1.8%) |
| Bachelor's Degree or higher | 1,330 (84.5%) | 16 (1.0%) |
| Total | 4,844 (80.8%) | 210 (3.5%) |
Employment Occupations by Sex in Sumner
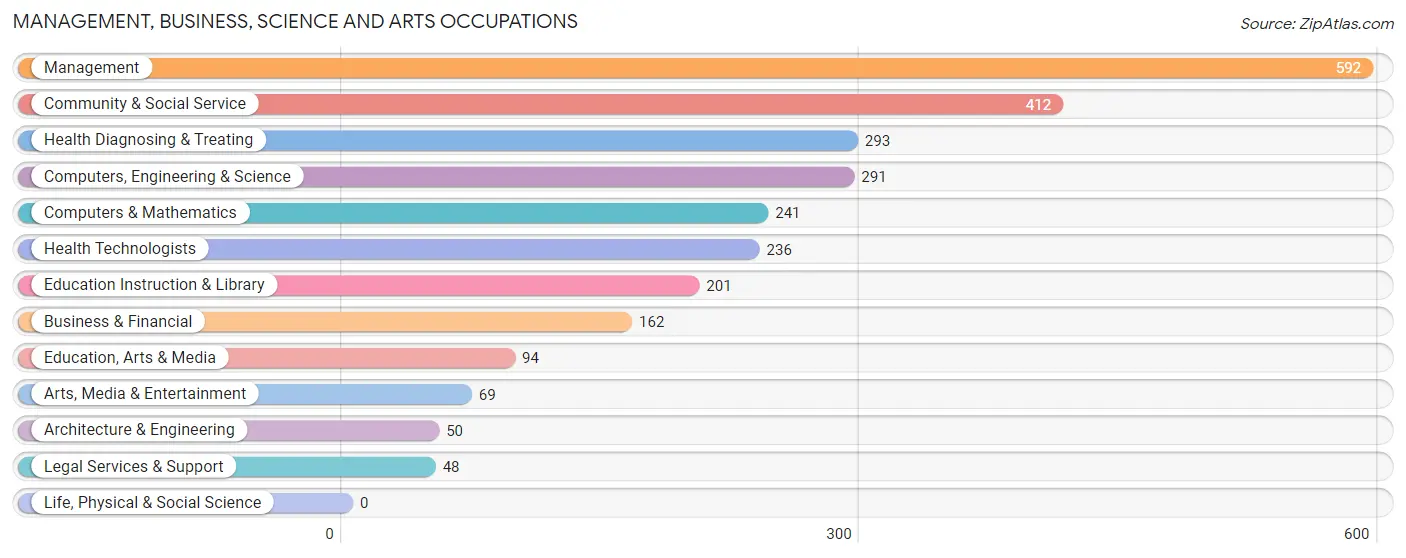
Management, Business, Science and Arts Occupations
The most common Management, Business, Science and Arts occupations in Sumner are Management (592 | 11.7%), Community & Social Service (412 | 8.2%), Health Diagnosing & Treating (293 | 5.8%), Computers, Engineering & Science (291 | 5.8%), and Computers & Mathematics (241 | 4.8%).
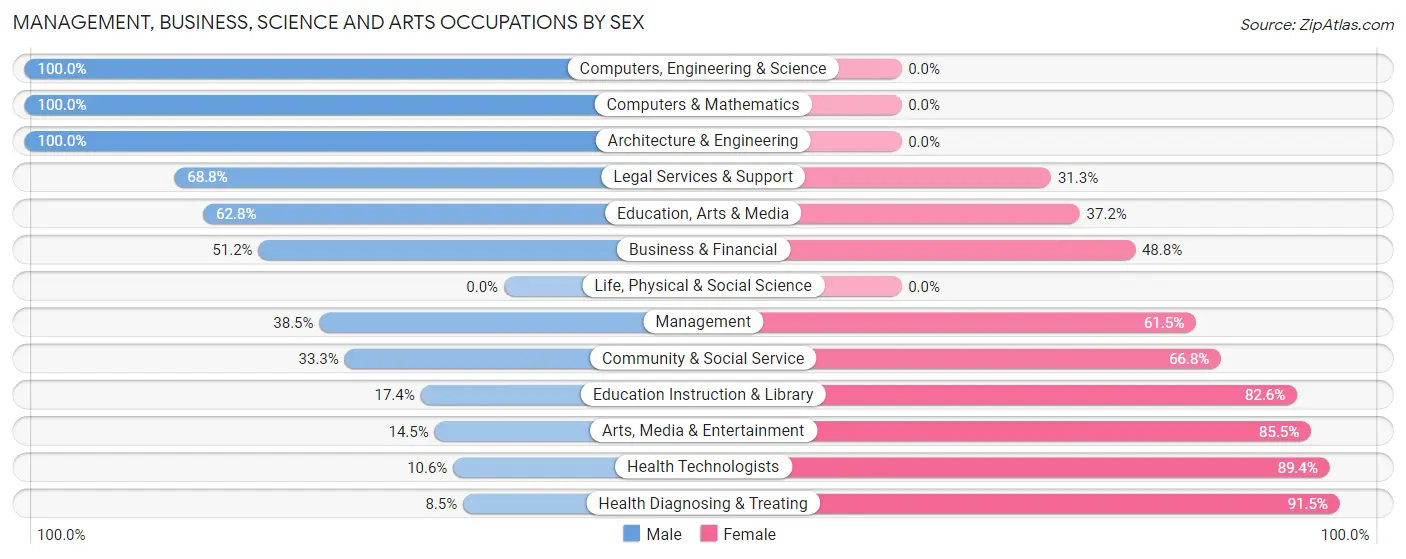
Management, Business, Science and Arts Occupations by Sex
Within the Management, Business, Science and Arts occupations in Sumner, the most male-oriented occupations are Computers, Engineering & Science (100.0%), Computers & Mathematics (100.0%), and Architecture & Engineering (100.0%), while the most female-oriented occupations are Health Diagnosing & Treating (91.5%), Health Technologists (89.4%), and Arts, Media & Entertainment (85.5%).
| Occupation | Male | Female |
| Management | 228 (38.5%) | 364 (61.5%) |
| Business & Financial | 83 (51.2%) | 79 (48.8%) |
| Computers, Engineering & Science | 291 (100.0%) | 0 (0.0%) |
| Computers & Mathematics | 241 (100.0%) | 0 (0.0%) |
| Architecture & Engineering | 50 (100.0%) | 0 (0.0%) |
| Life, Physical & Social Science | 0 (0.0%) | 0 (0.0%) |
| Community & Social Service | 137 (33.3%) | 275 (66.7%) |
| Education, Arts & Media | 59 (62.8%) | 35 (37.2%) |
| Legal Services & Support | 33 (68.8%) | 15 (31.2%) |
| Education Instruction & Library | 35 (17.4%) | 166 (82.6%) |
| Arts, Media & Entertainment | 10 (14.5%) | 59 (85.5%) |
| Health Diagnosing & Treating | 25 (8.5%) | 268 (91.5%) |
| Health Technologists | 25 (10.6%) | 211 (89.4%) |
| Total (Category) | 764 (43.7%) | 986 (56.3%) |
| Total (Overall) | 2,666 (52.9%) | 2,371 (47.1%) |
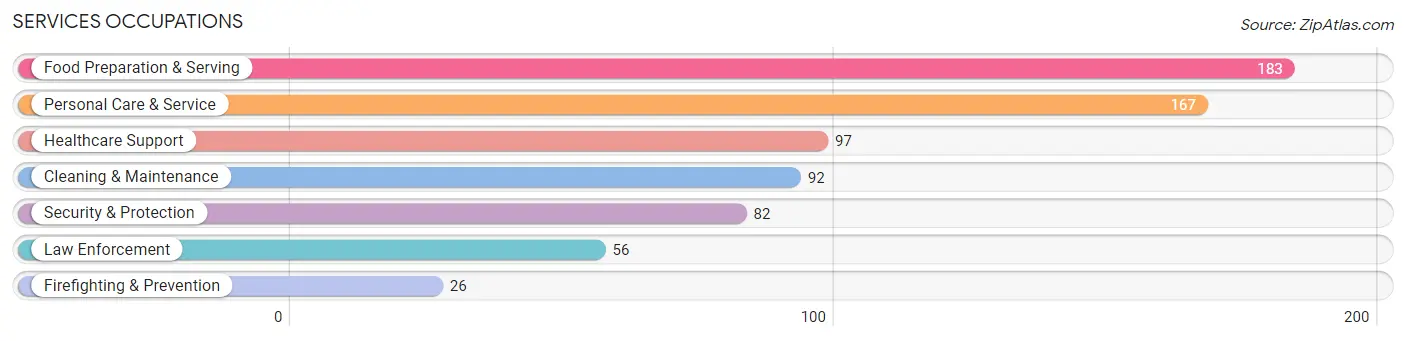
Services Occupations
The most common Services occupations in Sumner are Food Preparation & Serving (183 | 3.6%), Personal Care & Service (167 | 3.3%), Healthcare Support (97 | 1.9%), Cleaning & Maintenance (92 | 1.8%), and Security & Protection (82 | 1.6%).
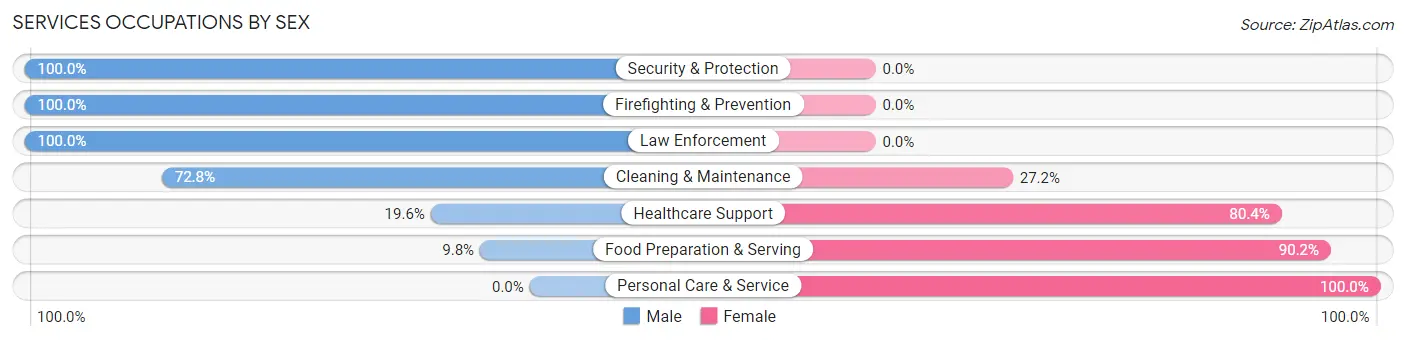
Services Occupations by Sex
Within the Services occupations in Sumner, the most male-oriented occupations are Security & Protection (100.0%), Firefighting & Prevention (100.0%), and Law Enforcement (100.0%), while the most female-oriented occupations are Personal Care & Service (100.0%), Food Preparation & Serving (90.2%), and Healthcare Support (80.4%).
| Occupation | Male | Female |
| Healthcare Support | 19 (19.6%) | 78 (80.4%) |
| Security & Protection | 82 (100.0%) | 0 (0.0%) |
| Firefighting & Prevention | 26 (100.0%) | 0 (0.0%) |
| Law Enforcement | 56 (100.0%) | 0 (0.0%) |
| Food Preparation & Serving | 18 (9.8%) | 165 (90.2%) |
| Cleaning & Maintenance | 67 (72.8%) | 25 (27.2%) |
| Personal Care & Service | 0 (0.0%) | 167 (100.0%) |
| Total (Category) | 186 (29.9%) | 435 (70.1%) |
| Total (Overall) | 2,666 (52.9%) | 2,371 (47.1%) |
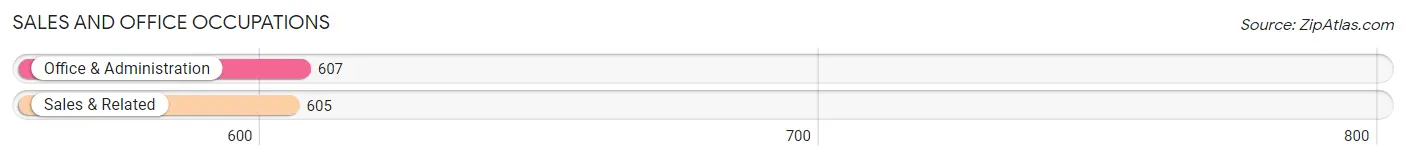
Sales and Office Occupations
The most common Sales and Office occupations in Sumner are Office & Administration (607 | 12.0%), and Sales & Related (605 | 12.0%).
Sales and Office Occupations by Sex
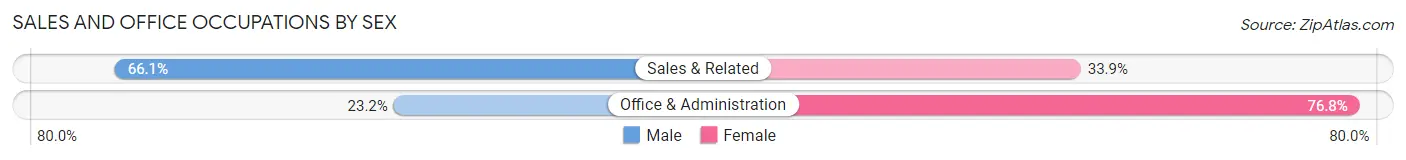
| Occupation | Male | Female |
| Sales & Related | 400 (66.1%) | 205 (33.9%) |
| Office & Administration | 141 (23.2%) | 466 (76.8%) |
| Total (Category) | 541 (44.6%) | 671 (55.4%) |
| Total (Overall) | 2,666 (52.9%) | 2,371 (47.1%) |
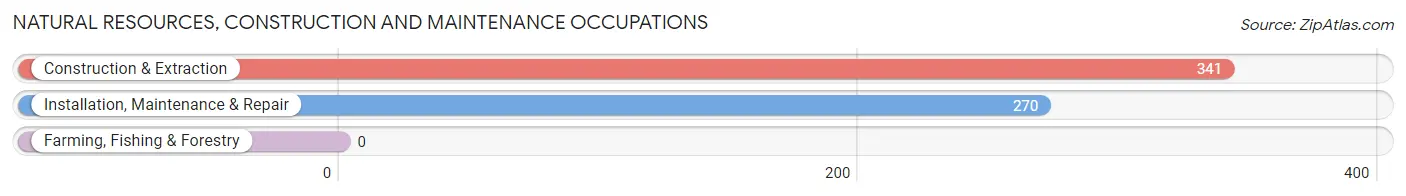
Natural Resources, Construction and Maintenance Occupations
The most common Natural Resources, Construction and Maintenance occupations in Sumner are Construction & Extraction (341 | 6.8%), and Installation, Maintenance & Repair (270 | 5.4%).
Natural Resources, Construction and Maintenance Occupations by Sex
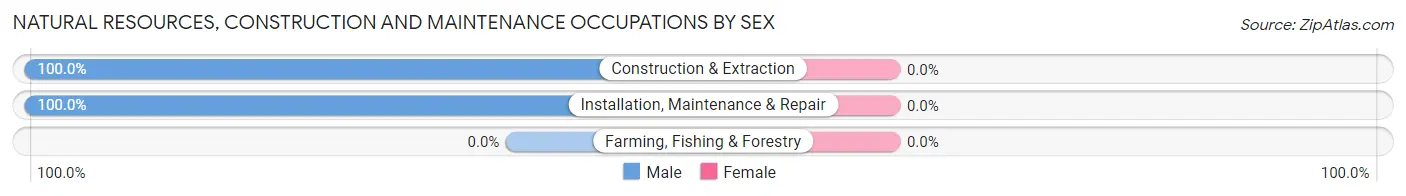
| Occupation | Male | Female |
| Farming, Fishing & Forestry | 0 (0.0%) | 0 (0.0%) |
| Construction & Extraction | 341 (100.0%) | 0 (0.0%) |
| Installation, Maintenance & Repair | 270 (100.0%) | 0 (0.0%) |
| Total (Category) | 611 (100.0%) | 0 (0.0%) |
| Total (Overall) | 2,666 (52.9%) | 2,371 (47.1%) |
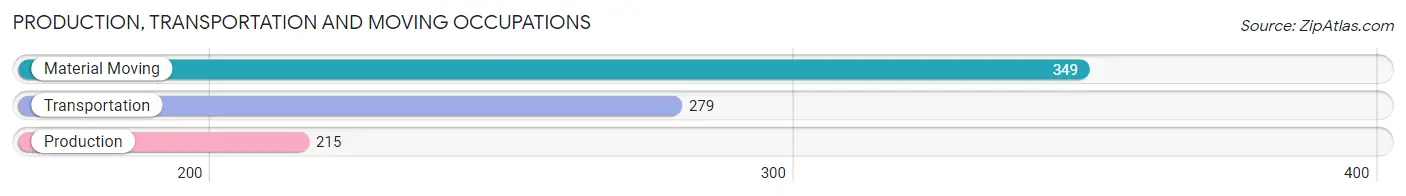
Production, Transportation and Moving Occupations
The most common Production, Transportation and Moving occupations in Sumner are Material Moving (349 | 6.9%), Transportation (279 | 5.5%), and Production (215 | 4.3%).
Production, Transportation and Moving Occupations by Sex
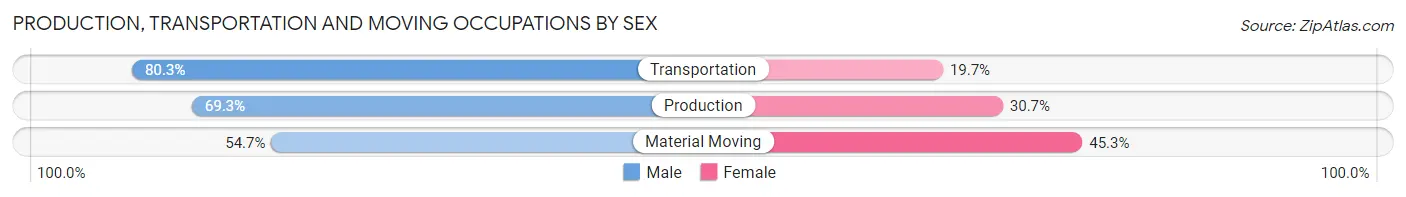
| Occupation | Male | Female |
| Production | 149 (69.3%) | 66 (30.7%) |
| Transportation | 224 (80.3%) | 55 (19.7%) |
| Material Moving | 191 (54.7%) | 158 (45.3%) |
| Total (Category) | 564 (66.9%) | 279 (33.1%) |
| Total (Overall) | 2,666 (52.9%) | 2,371 (47.1%) |
Employment Industries by Sex in Sumner
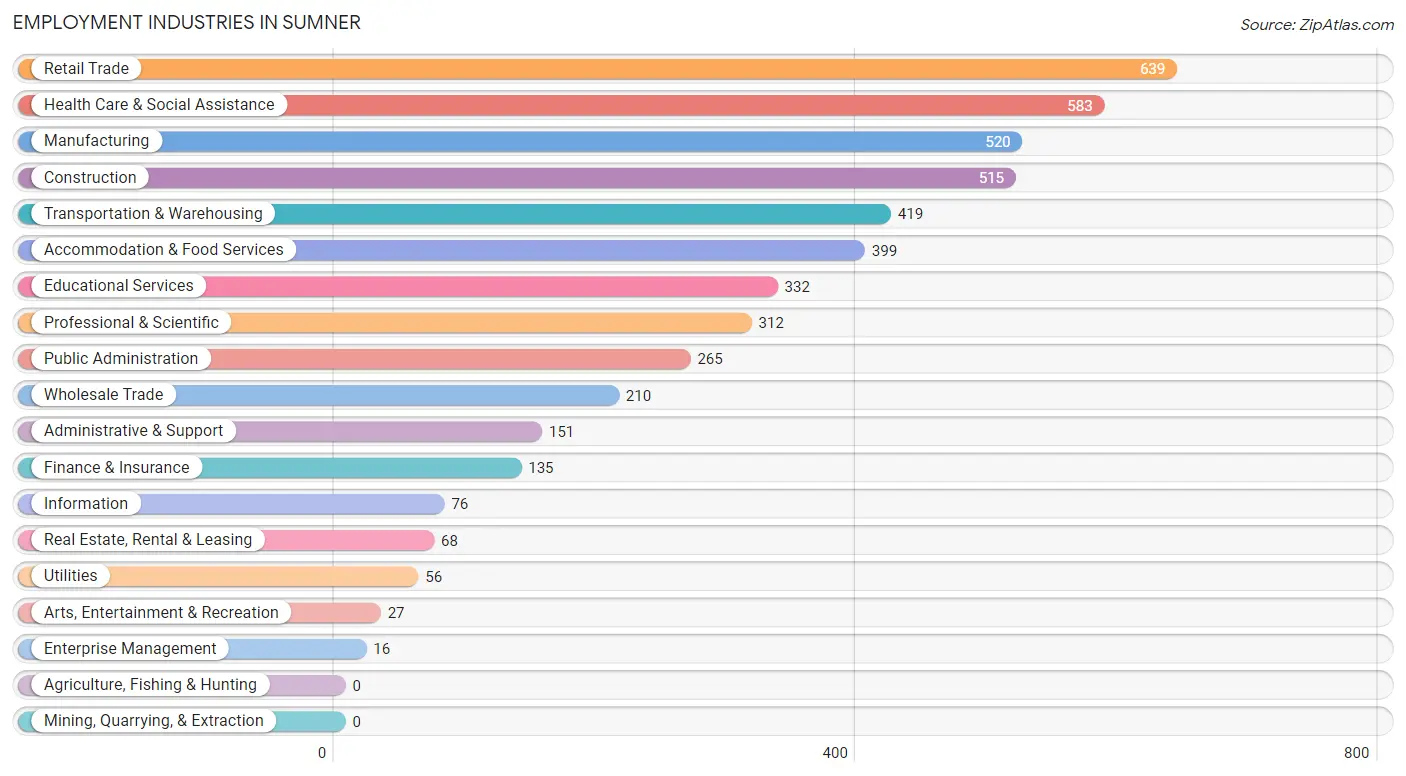
Employment Industries in Sumner
The major employment industries in Sumner include Retail Trade (639 | 12.7%), Health Care & Social Assistance (583 | 11.6%), Manufacturing (520 | 10.3%), Construction (515 | 10.2%), and Transportation & Warehousing (419 | 8.3%).
Employment Industries by Sex in Sumner
The Sumner industries that see more men than women are Arts, Entertainment & Recreation (100.0%), Wholesale Trade (90.9%), and Construction (83.3%), whereas the industries that tend to have a higher number of women are Enterprise Management (100.0%), Educational Services (84.0%), and Health Care & Social Assistance (82.7%).
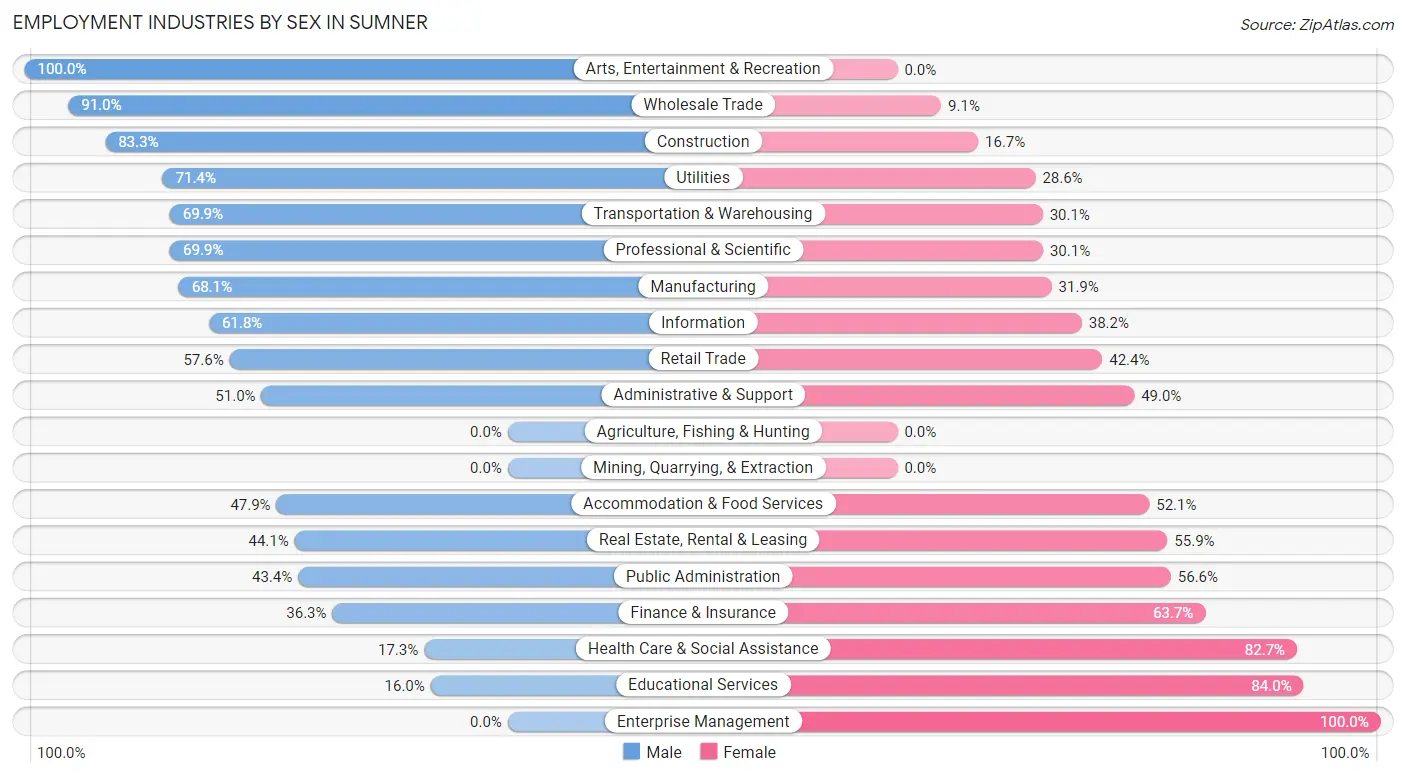
| Industry | Male | Female |
| Agriculture, Fishing & Hunting | 0 (0.0%) | 0 (0.0%) |
| Mining, Quarrying, & Extraction | 0 (0.0%) | 0 (0.0%) |
| Construction | 429 (83.3%) | 86 (16.7%) |
| Manufacturing | 354 (68.1%) | 166 (31.9%) |
| Wholesale Trade | 191 (90.9%) | 19 (9.0%) |
| Retail Trade | 368 (57.6%) | 271 (42.4%) |
| Transportation & Warehousing | 293 (69.9%) | 126 (30.1%) |
| Utilities | 40 (71.4%) | 16 (28.6%) |
| Information | 47 (61.8%) | 29 (38.2%) |
| Finance & Insurance | 49 (36.3%) | 86 (63.7%) |
| Real Estate, Rental & Leasing | 30 (44.1%) | 38 (55.9%) |
| Professional & Scientific | 218 (69.9%) | 94 (30.1%) |
| Enterprise Management | 0 (0.0%) | 16 (100.0%) |
| Administrative & Support | 77 (51.0%) | 74 (49.0%) |
| Educational Services | 53 (16.0%) | 279 (84.0%) |
| Health Care & Social Assistance | 101 (17.3%) | 482 (82.7%) |
| Arts, Entertainment & Recreation | 27 (100.0%) | 0 (0.0%) |
| Accommodation & Food Services | 191 (47.9%) | 208 (52.1%) |
| Public Administration | 115 (43.4%) | 150 (56.6%) |
| Total | 2,666 (52.9%) | 2,371 (47.1%) |
Education in Sumner
School Enrollment in Sumner
The most common levels of schooling among the 2,297 students in Sumner are middle school (484 | 21.1%), high school (465 | 20.2%), and elementary school (443 | 19.3%).
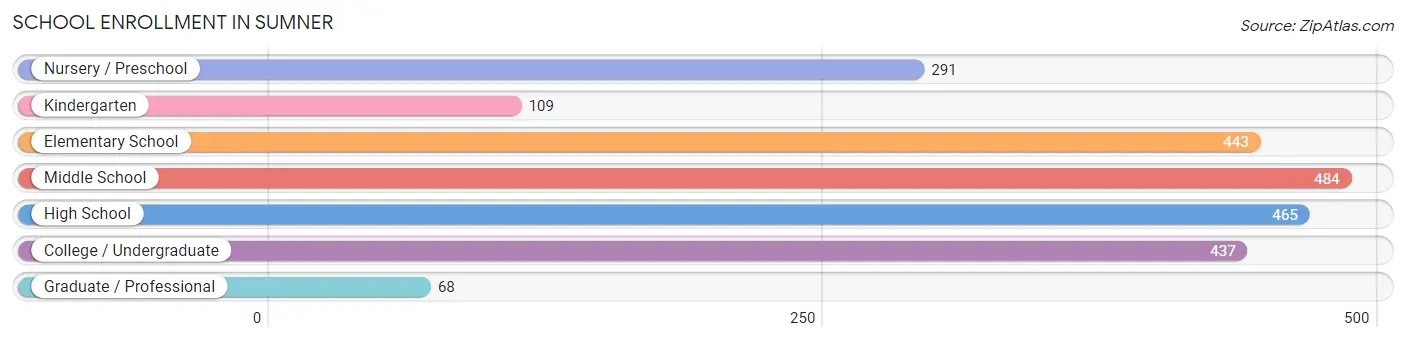
| School Level | # Students | % Students |
| Nursery / Preschool | 291 | 12.7% |
| Kindergarten | 109 | 4.8% |
| Elementary School | 443 | 19.3% |
| Middle School | 484 | 21.1% |
| High School | 465 | 20.2% |
| College / Undergraduate | 437 | 19.0% |
| Graduate / Professional | 68 | 3.0% |
| Total | 2,297 | 100.0% |
School Enrollment by Age by Funding Source in Sumner
Out of a total of 2,297 students who are enrolled in schools in Sumner, 326 (14.2%) attend a private institution, while the remaining 1,971 (85.8%) are enrolled in public schools. The age group of 3 to 4 year olds has the highest likelihood of being enrolled in private schools, with 145 (74.0% in the age bracket) enrolled. Conversely, the age group of 15 to 17 year olds has the lowest likelihood of being enrolled in a private school, with 351 (100.0% in the age bracket) attending a public institution.
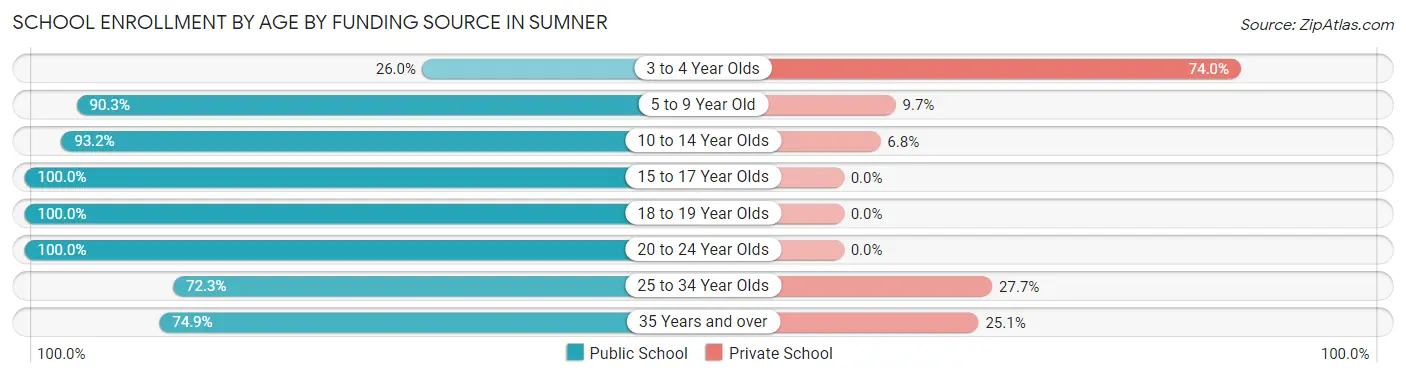
| Age Bracket | Public School | Private School |
| 3 to 4 Year Olds | 51 (26.0%) | 145 (74.0%) |
| 5 to 9 Year Old | 514 (90.3%) | 55 (9.7%) |
| 10 to 14 Year Olds | 572 (93.2%) | 42 (6.8%) |
| 15 to 17 Year Olds | 351 (100.0%) | 0 (0.0%) |
| 18 to 19 Year Olds | 162 (100.0%) | 0 (0.0%) |
| 20 to 24 Year Olds | 76 (100.0%) | 0 (0.0%) |
| 25 to 34 Year Olds | 68 (72.3%) | 26 (27.7%) |
| 35 Years and over | 176 (74.9%) | 59 (25.1%) |
| Total | 1,971 (85.8%) | 326 (14.2%) |
Educational Attainment by Field of Study in Sumner
Business (423 | 20.7%), social sciences (219 | 10.7%), computers & mathematics (202 | 9.9%), education (192 | 9.4%), and arts & humanities (191 | 9.3%) are the most common fields of study among 2,047 individuals in Sumner who have obtained a bachelor's degree or higher.
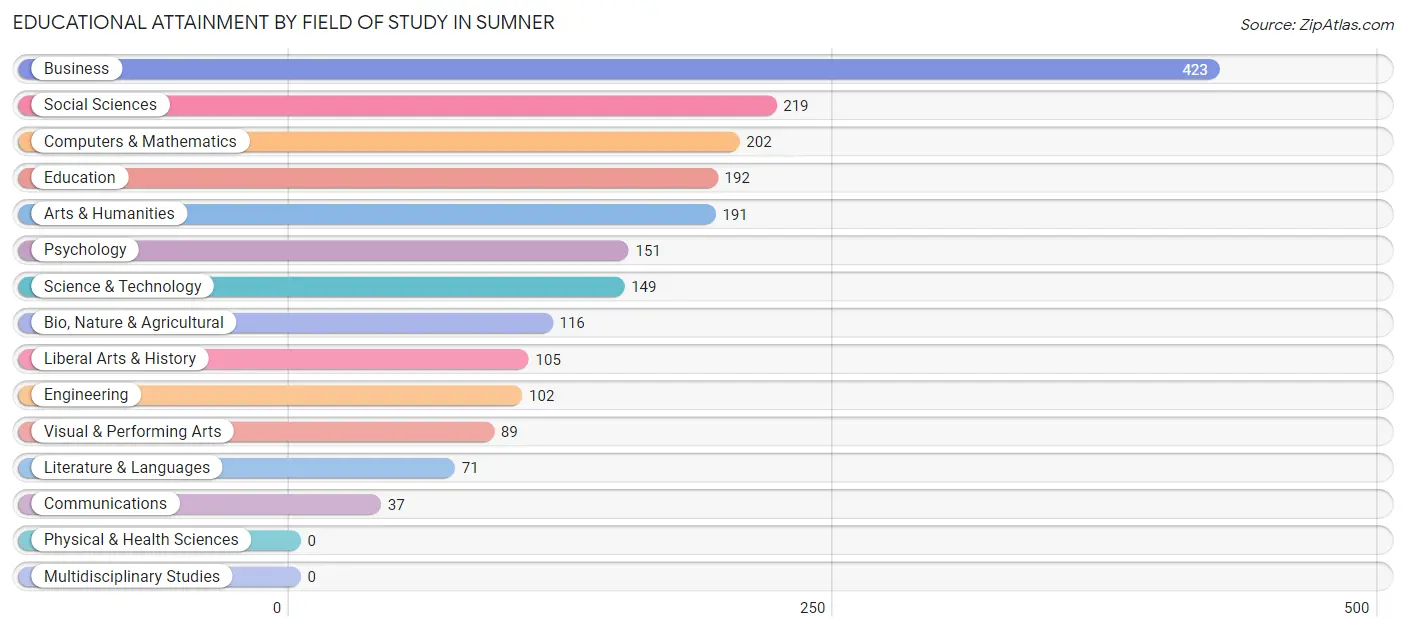
| Field of Study | # Graduates | % Graduates |
| Computers & Mathematics | 202 | 9.9% |
| Bio, Nature & Agricultural | 116 | 5.7% |
| Physical & Health Sciences | 0 | 0.0% |
| Psychology | 151 | 7.4% |
| Social Sciences | 219 | 10.7% |
| Engineering | 102 | 5.0% |
| Multidisciplinary Studies | 0 | 0.0% |
| Science & Technology | 149 | 7.3% |
| Business | 423 | 20.7% |
| Education | 192 | 9.4% |
| Literature & Languages | 71 | 3.5% |
| Liberal Arts & History | 105 | 5.1% |
| Visual & Performing Arts | 89 | 4.3% |
| Communications | 37 | 1.8% |
| Arts & Humanities | 191 | 9.3% |
| Total | 2,047 | 100.0% |
Transportation & Commute in Sumner
Vehicle Availability by Sex in Sumner
The most prevalent vehicle ownership categories in Sumner are males with 2 vehicles (1,310, accounting for 47.4%) and females with 2 vehicles (985, making up 58.3%).
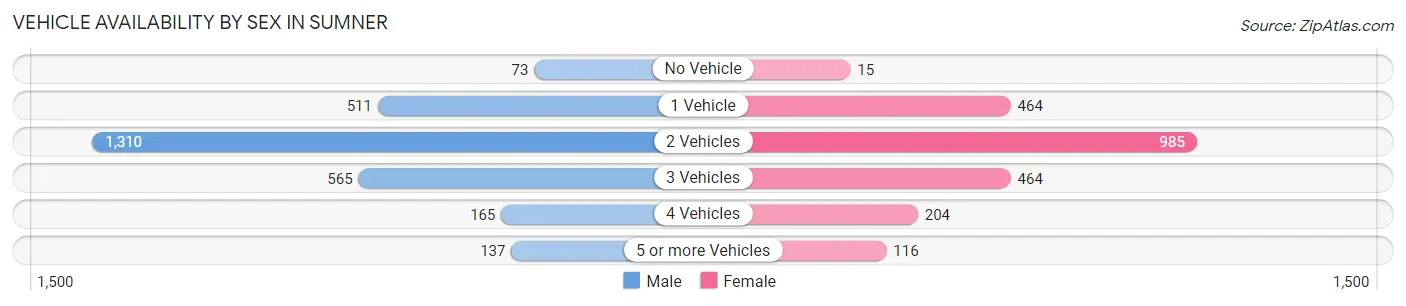
| Vehicles Available | Male | Female |
| No Vehicle | 73 (2.6%) | 15 (0.7%) |
| 1 Vehicle | 511 (18.5%) | 464 (20.6%) |
| 2 Vehicles | 1,310 (47.4%) | 985 (43.8%) |
| 3 Vehicles | 565 (20.5%) | 464 (20.6%) |
| 4 Vehicles | 165 (6.0%) | 204 (9.1%) |
| 5 or more Vehicles | 137 (5.0%) | 116 (5.2%) |
| Total | 2,761 (100.0%) | 2,248 (100.0%) |
Commute Time in Sumner
The most frequently occuring commute durations in Sumner are 20 to 24 minutes (792 commuters, 17.6%), 10 to 14 minutes (651 commuters, 14.4%), and 15 to 19 minutes (570 commuters, 12.6%).
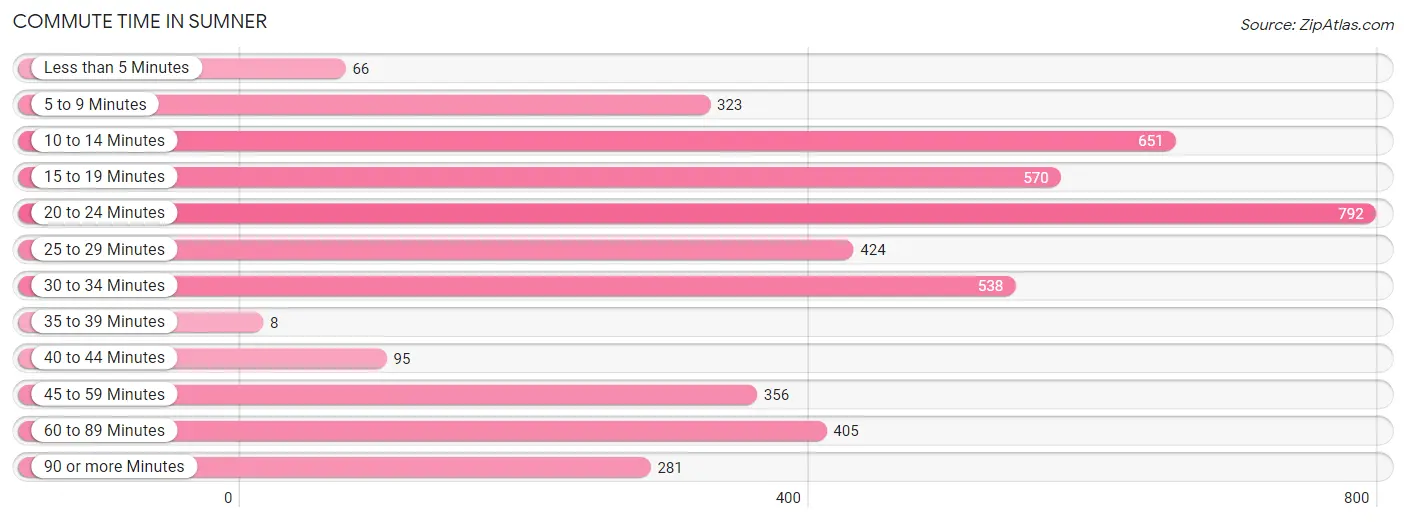
| Commute Time | # Commuters | % Commuters |
| Less than 5 Minutes | 66 | 1.5% |
| 5 to 9 Minutes | 323 | 7.2% |
| 10 to 14 Minutes | 651 | 14.4% |
| 15 to 19 Minutes | 570 | 12.6% |
| 20 to 24 Minutes | 792 | 17.6% |
| 25 to 29 Minutes | 424 | 9.4% |
| 30 to 34 Minutes | 538 | 11.9% |
| 35 to 39 Minutes | 8 | 0.2% |
| 40 to 44 Minutes | 95 | 2.1% |
| 45 to 59 Minutes | 356 | 7.9% |
| 60 to 89 Minutes | 405 | 9.0% |
| 90 or more Minutes | 281 | 6.2% |
Commute Time by Sex in Sumner
The most common commute times in Sumner are 60 to 89 minutes (367 commuters, 14.6%) for males and 20 to 24 minutes (463 commuters, 23.2%) for females.
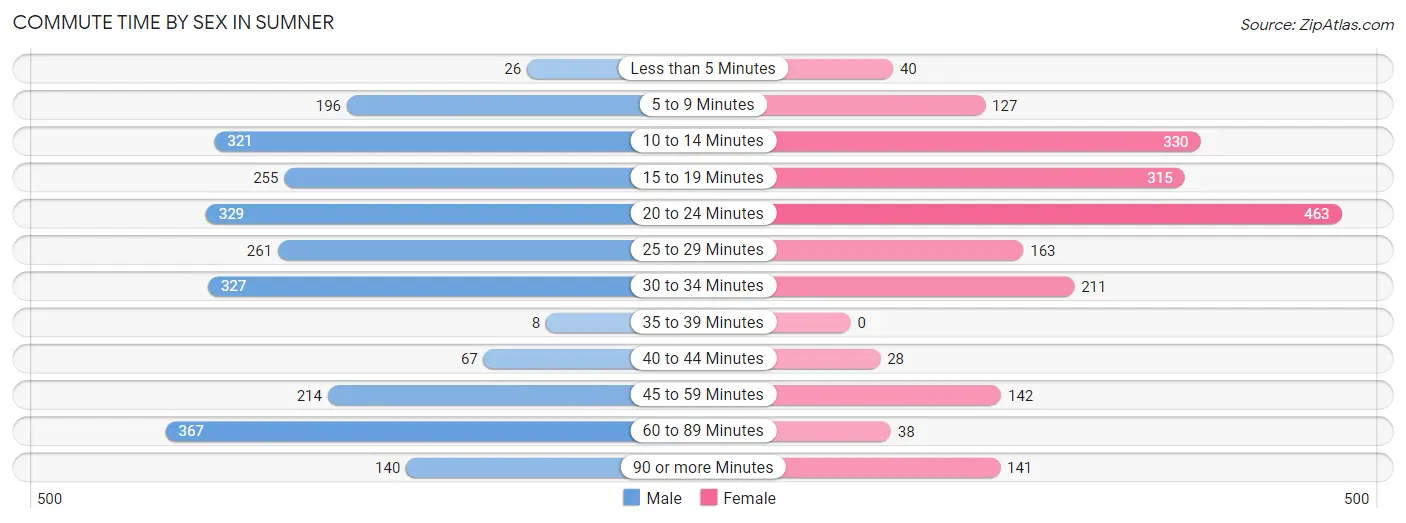
| Commute Time | Male | Female |
| Less than 5 Minutes | 26 (1.0%) | 40 (2.0%) |
| 5 to 9 Minutes | 196 (7.8%) | 127 (6.4%) |
| 10 to 14 Minutes | 321 (12.8%) | 330 (16.5%) |
| 15 to 19 Minutes | 255 (10.2%) | 315 (15.8%) |
| 20 to 24 Minutes | 329 (13.1%) | 463 (23.2%) |
| 25 to 29 Minutes | 261 (10.4%) | 163 (8.2%) |
| 30 to 34 Minutes | 327 (13.0%) | 211 (10.6%) |
| 35 to 39 Minutes | 8 (0.3%) | 0 (0.0%) |
| 40 to 44 Minutes | 67 (2.7%) | 28 (1.4%) |
| 45 to 59 Minutes | 214 (8.5%) | 142 (7.1%) |
| 60 to 89 Minutes | 367 (14.6%) | 38 (1.9%) |
| 90 or more Minutes | 140 (5.6%) | 141 (7.1%) |
Time of Departure to Work by Sex in Sumner
The most frequent times of departure to work in Sumner are 7:00 AM to 7:29 AM (432, 17.2%) for males and 7:00 AM to 7:29 AM (249, 12.5%) for females.
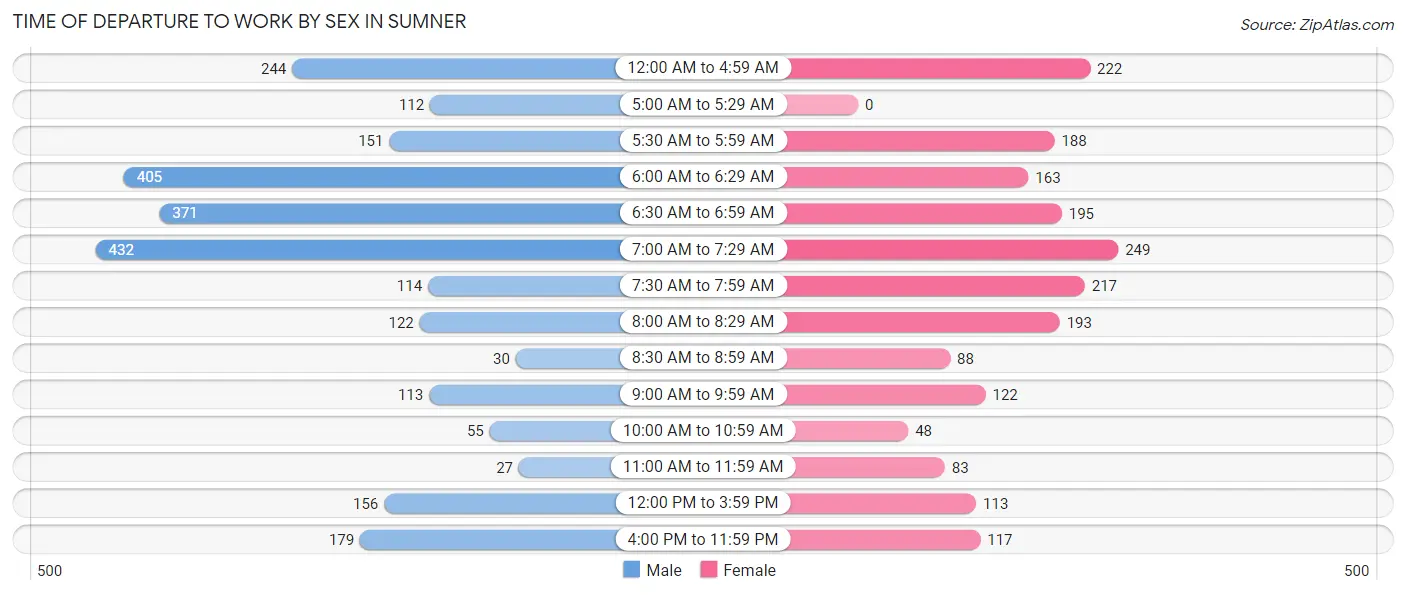
| Time of Departure | Male | Female |
| 12:00 AM to 4:59 AM | 244 (9.7%) | 222 (11.1%) |
| 5:00 AM to 5:29 AM | 112 (4.5%) | 0 (0.0%) |
| 5:30 AM to 5:59 AM | 151 (6.0%) | 188 (9.4%) |
| 6:00 AM to 6:29 AM | 405 (16.1%) | 163 (8.2%) |
| 6:30 AM to 6:59 AM | 371 (14.8%) | 195 (9.8%) |
| 7:00 AM to 7:29 AM | 432 (17.2%) | 249 (12.5%) |
| 7:30 AM to 7:59 AM | 114 (4.5%) | 217 (10.9%) |
| 8:00 AM to 8:29 AM | 122 (4.9%) | 193 (9.7%) |
| 8:30 AM to 8:59 AM | 30 (1.2%) | 88 (4.4%) |
| 9:00 AM to 9:59 AM | 113 (4.5%) | 122 (6.1%) |
| 10:00 AM to 10:59 AM | 55 (2.2%) | 48 (2.4%) |
| 11:00 AM to 11:59 AM | 27 (1.1%) | 83 (4.2%) |
| 12:00 PM to 3:59 PM | 156 (6.2%) | 113 (5.7%) |
| 4:00 PM to 11:59 PM | 179 (7.1%) | 117 (5.9%) |
| Total | 2,511 (100.0%) | 1,998 (100.0%) |
Housing Occupancy in Sumner
Occupancy by Ownership in Sumner
Of the total 4,413 dwellings in Sumner, owner-occupied units account for 2,207 (50.0%), while renter-occupied units make up 2,206 (50.0%).
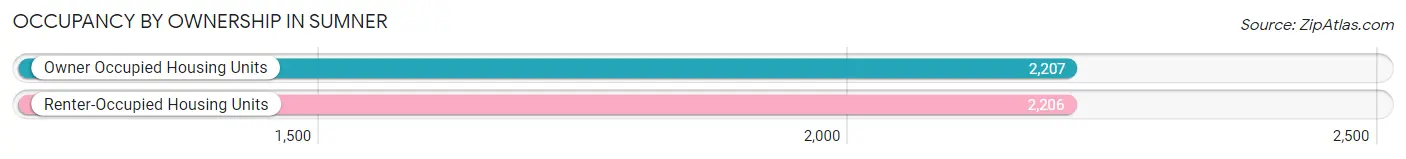
| Occupancy | # Housing Units | % Housing Units |
| Owner Occupied Housing Units | 2,207 | 50.0% |
| Renter-Occupied Housing Units | 2,206 | 50.0% |
| Total Occupied Housing Units | 4,413 | 100.0% |
Occupancy by Household Size in Sumner
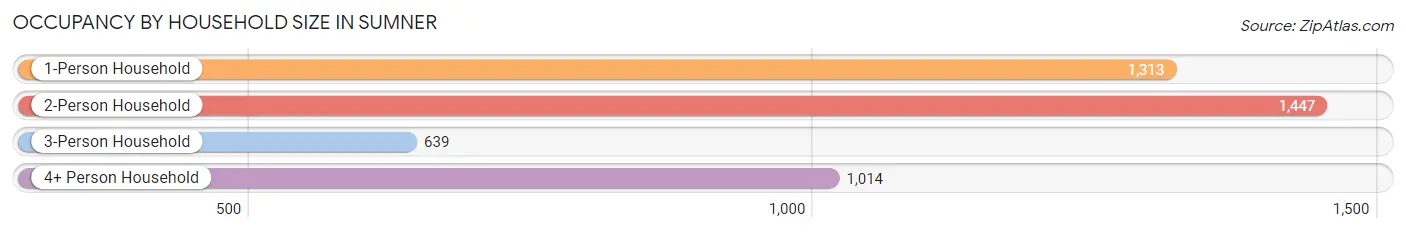
| Household Size | # Housing Units | % Housing Units |
| 1-Person Household | 1,313 | 29.7% |
| 2-Person Household | 1,447 | 32.8% |
| 3-Person Household | 639 | 14.5% |
| 4+ Person Household | 1,014 | 23.0% |
| Total Housing Units | 4,413 | 100.0% |
Occupancy by Ownership by Household Size in Sumner
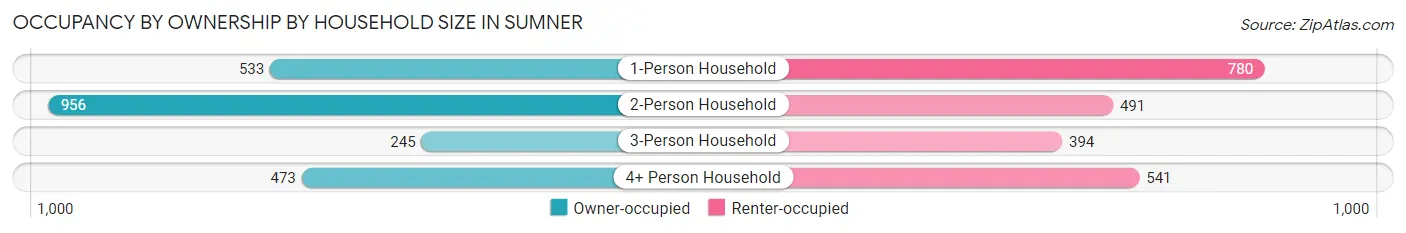
| Household Size | Owner-occupied | Renter-occupied |
| 1-Person Household | 533 (40.6%) | 780 (59.4%) |
| 2-Person Household | 956 (66.1%) | 491 (33.9%) |
| 3-Person Household | 245 (38.3%) | 394 (61.7%) |
| 4+ Person Household | 473 (46.7%) | 541 (53.3%) |
| Total Housing Units | 2,207 (50.0%) | 2,206 (50.0%) |
Occupancy by Educational Attainment in Sumner
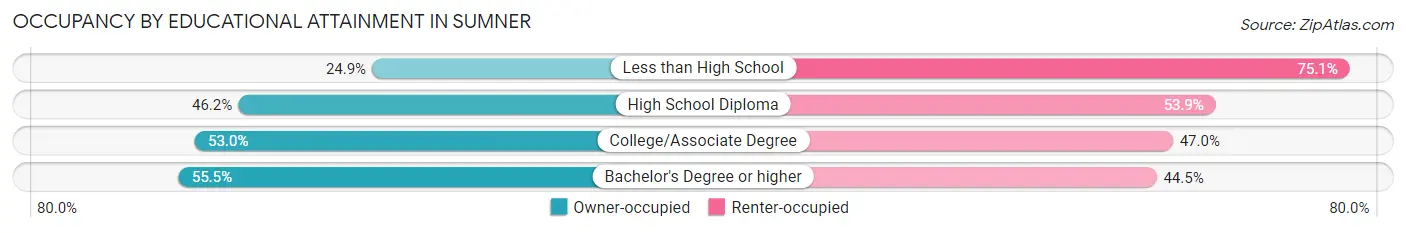
| Household Size | Owner-occupied | Renter-occupied |
| Less than High School | 71 (24.9%) | 214 (75.1%) |
| High School Diploma | 534 (46.2%) | 623 (53.8%) |
| College/Associate Degree | 985 (53.0%) | 875 (47.0%) |
| Bachelor's Degree or higher | 617 (55.5%) | 494 (44.5%) |
Occupancy by Age of Householder in Sumner
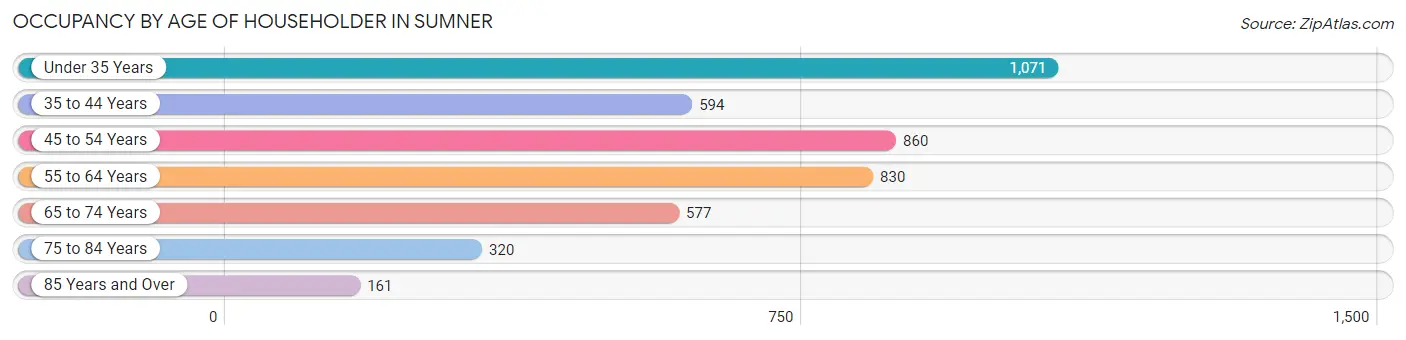
| Age Bracket | # Households | % Households |
| Under 35 Years | 1,071 | 24.3% |
| 35 to 44 Years | 594 | 13.5% |
| 45 to 54 Years | 860 | 19.5% |
| 55 to 64 Years | 830 | 18.8% |
| 65 to 74 Years | 577 | 13.1% |
| 75 to 84 Years | 320 | 7.2% |
| 85 Years and Over | 161 | 3.6% |
| Total | 4,413 | 100.0% |
Housing Finances in Sumner
Median Income by Occupancy in Sumner
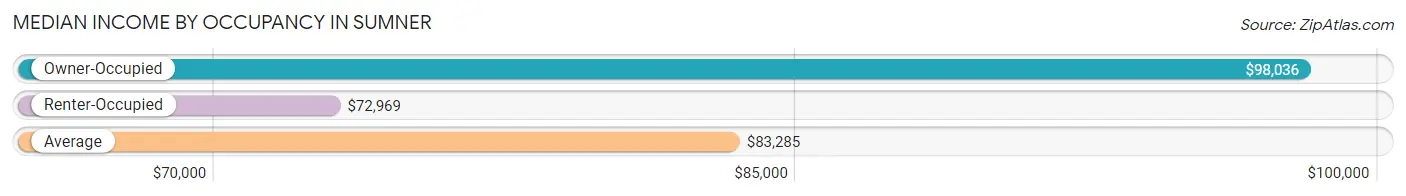
| Occupancy Type | # Households | Median Income |
| Owner-Occupied | 2,207 (50.0%) | $98,036 |
| Renter-Occupied | 2,206 (50.0%) | $72,969 |
| Average | 4,413 (100.0%) | $83,285 |
Occupancy by Householder Income Bracket in Sumner
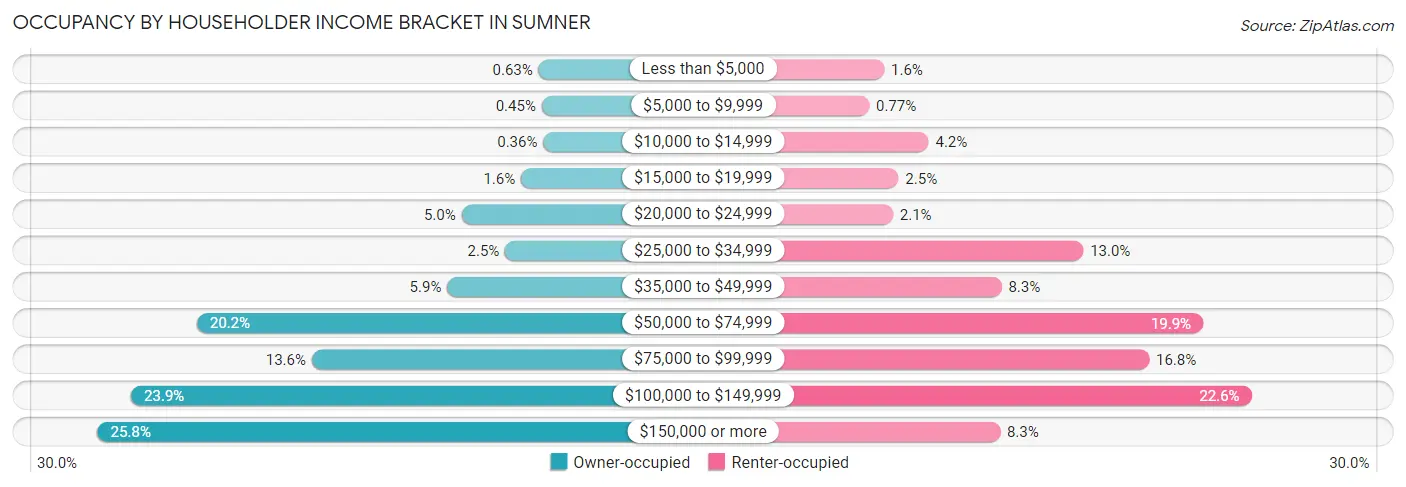
| Income Bracket | Owner-occupied | Renter-occupied |
| Less than $5,000 | 14 (0.6%) | 36 (1.6%) |
| $5,000 to $9,999 | 10 (0.4%) | 17 (0.8%) |
| $10,000 to $14,999 | 8 (0.4%) | 92 (4.2%) |
| $15,000 to $19,999 | 36 (1.6%) | 54 (2.5%) |
| $20,000 to $24,999 | 111 (5.0%) | 47 (2.1%) |
| $25,000 to $34,999 | 56 (2.5%) | 287 (13.0%) |
| $35,000 to $49,999 | 129 (5.9%) | 184 (8.3%) |
| $50,000 to $74,999 | 445 (20.2%) | 438 (19.9%) |
| $75,000 to $99,999 | 300 (13.6%) | 370 (16.8%) |
| $100,000 to $149,999 | 528 (23.9%) | 499 (22.6%) |
| $150,000 or more | 570 (25.8%) | 182 (8.3%) |
| Total | 2,207 (100.0%) | 2,206 (100.0%) |
Monthly Housing Cost Tiers in Sumner
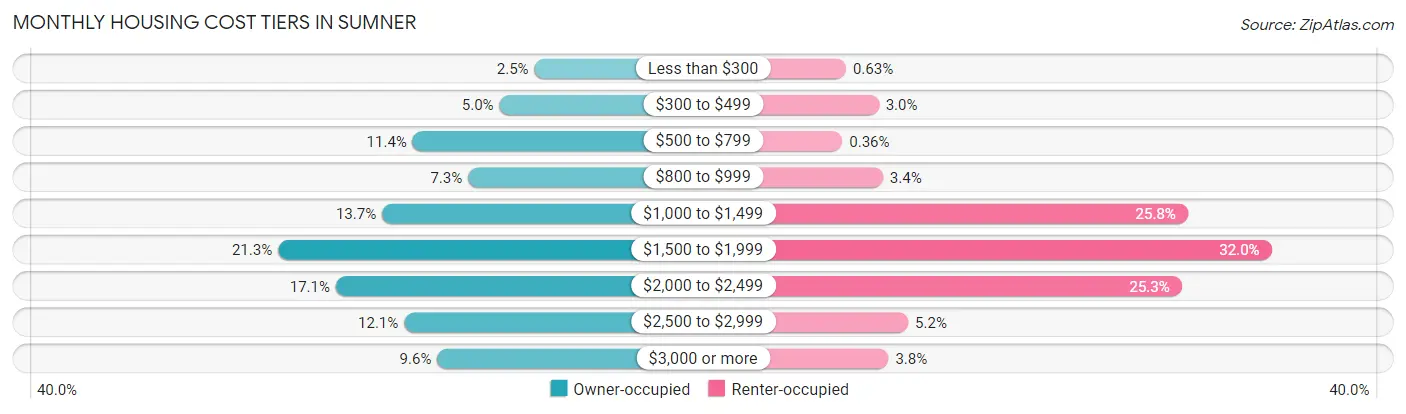
| Monthly Cost | Owner-occupied | Renter-occupied |
| Less than $300 | 54 (2.5%) | 14 (0.6%) |
| $300 to $499 | 111 (5.0%) | 67 (3.0%) |
| $500 to $799 | 252 (11.4%) | 8 (0.4%) |
| $800 to $999 | 162 (7.3%) | 74 (3.4%) |
| $1,000 to $1,499 | 302 (13.7%) | 569 (25.8%) |
| $1,500 to $1,999 | 471 (21.3%) | 705 (32.0%) |
| $2,000 to $2,499 | 377 (17.1%) | 559 (25.3%) |
| $2,500 to $2,999 | 266 (12.0%) | 115 (5.2%) |
| $3,000 or more | 212 (9.6%) | 83 (3.8%) |
| Total | 2,207 (100.0%) | 2,206 (100.0%) |
Physical Housing Characteristics in Sumner
Housing Structures in Sumner
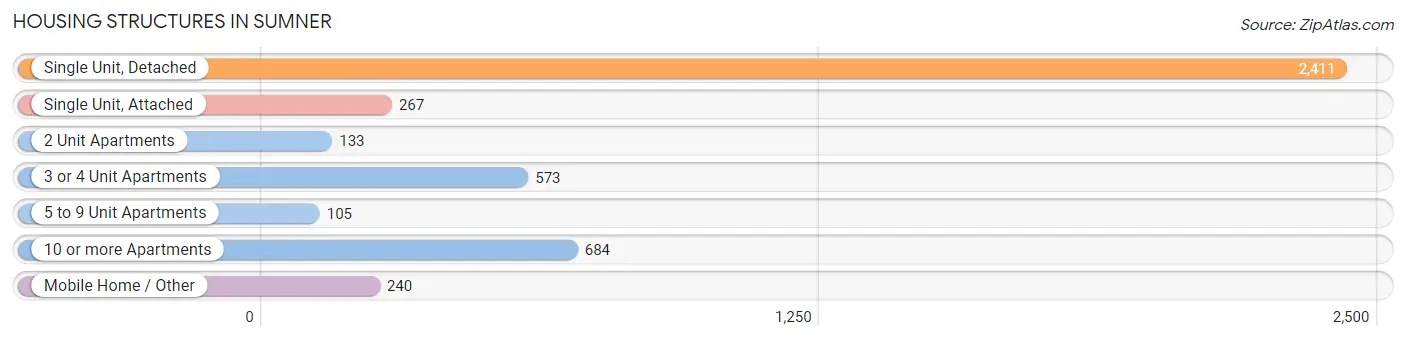
| Structure Type | # Housing Units | % Housing Units |
| Single Unit, Detached | 2,411 | 54.6% |
| Single Unit, Attached | 267 | 6.0% |
| 2 Unit Apartments | 133 | 3.0% |
| 3 or 4 Unit Apartments | 573 | 13.0% |
| 5 to 9 Unit Apartments | 105 | 2.4% |
| 10 or more Apartments | 684 | 15.5% |
| Mobile Home / Other | 240 | 5.4% |
| Total | 4,413 | 100.0% |
Housing Structures by Occupancy in Sumner
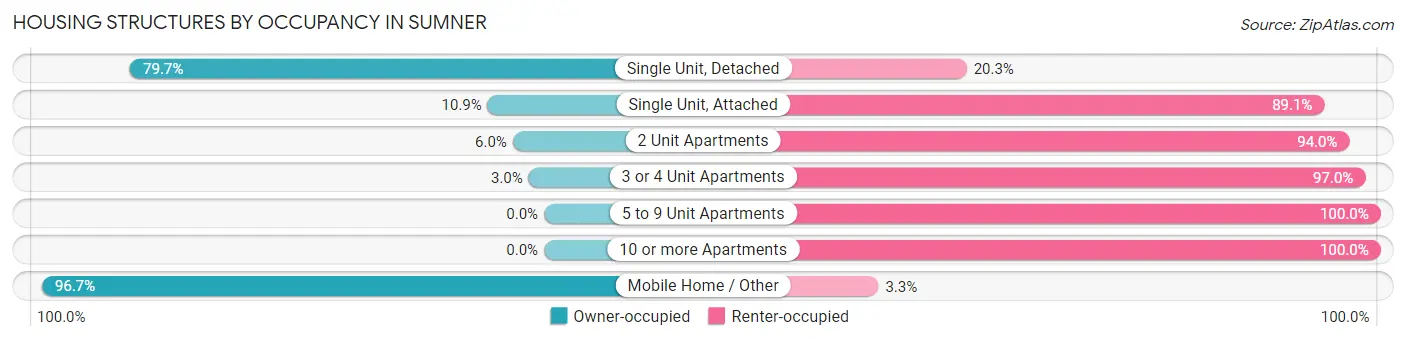
| Structure Type | Owner-occupied | Renter-occupied |
| Single Unit, Detached | 1,921 (79.7%) | 490 (20.3%) |
| Single Unit, Attached | 29 (10.9%) | 238 (89.1%) |
| 2 Unit Apartments | 8 (6.0%) | 125 (94.0%) |
| 3 or 4 Unit Apartments | 17 (3.0%) | 556 (97.0%) |
| 5 to 9 Unit Apartments | 0 (0.0%) | 105 (100.0%) |
| 10 or more Apartments | 0 (0.0%) | 684 (100.0%) |
| Mobile Home / Other | 232 (96.7%) | 8 (3.3%) |
| Total | 2,207 (50.0%) | 2,206 (50.0%) |
Housing Structures by Number of Rooms in Sumner
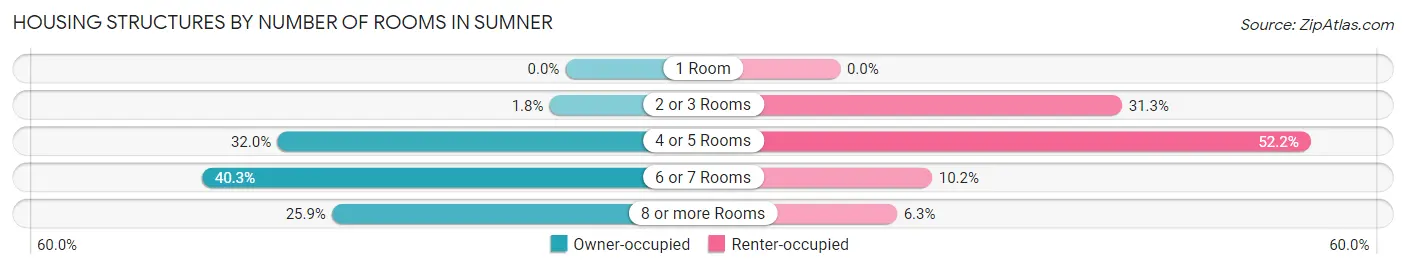
| Number of Rooms | Owner-occupied | Renter-occupied |
| 1 Room | 0 (0.0%) | 0 (0.0%) |
| 2 or 3 Rooms | 39 (1.8%) | 690 (31.3%) |
| 4 or 5 Rooms | 706 (32.0%) | 1,152 (52.2%) |
| 6 or 7 Rooms | 890 (40.3%) | 225 (10.2%) |
| 8 or more Rooms | 572 (25.9%) | 139 (6.3%) |
| Total | 2,207 (100.0%) | 2,206 (100.0%) |
Housing Structure by Heating Type in Sumner
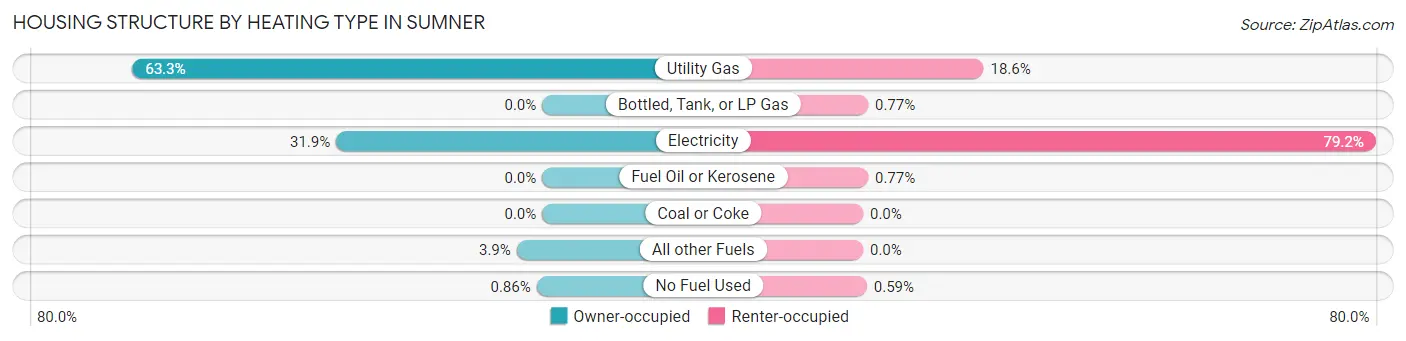
| Heating Type | Owner-occupied | Renter-occupied |
| Utility Gas | 1,398 (63.3%) | 411 (18.6%) |
| Bottled, Tank, or LP Gas | 0 (0.0%) | 17 (0.8%) |
| Electricity | 703 (31.9%) | 1,748 (79.2%) |
| Fuel Oil or Kerosene | 0 (0.0%) | 17 (0.8%) |
| Coal or Coke | 0 (0.0%) | 0 (0.0%) |
| All other Fuels | 87 (3.9%) | 0 (0.0%) |
| No Fuel Used | 19 (0.9%) | 13 (0.6%) |
| Total | 2,207 (100.0%) | 2,206 (100.0%) |
Household Vehicle Usage in Sumner
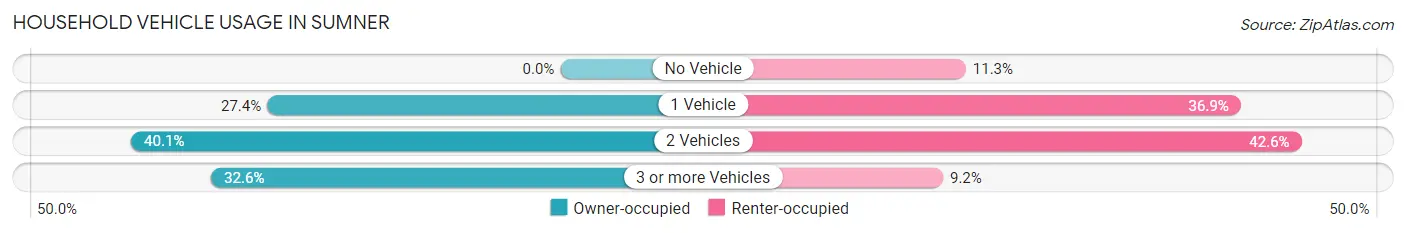
| Vehicles per Household | Owner-occupied | Renter-occupied |
| No Vehicle | 0 (0.0%) | 249 (11.3%) |
| 1 Vehicle | 604 (27.4%) | 815 (36.9%) |
| 2 Vehicles | 884 (40.1%) | 940 (42.6%) |
| 3 or more Vehicles | 719 (32.6%) | 202 (9.2%) |
| Total | 2,207 (100.0%) | 2,206 (100.0%) |
Real Estate & Mortgages in Sumner
Real Estate and Mortgage Overview in Sumner
| Characteristic | Without Mortgage | With Mortgage |
| Housing Units | 738 | 1,469 |
| Median Property Value | $417,100 | $453,400 |
| Median Household Income | $87,000 | $405 |
| Monthly Housing Costs | $762 | $199 |
| Real Estate Taxes | $4,315 | $35 |
Property Value by Mortgage Status in Sumner
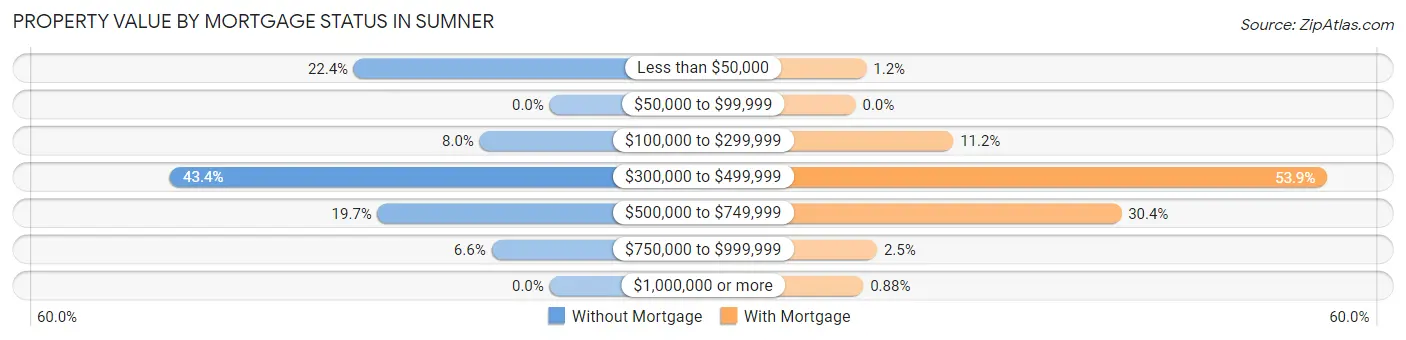
| Property Value | Without Mortgage | With Mortgage |
| Less than $50,000 | 165 (22.4%) | 18 (1.2%) |
| $50,000 to $99,999 | 0 (0.0%) | 0 (0.0%) |
| $100,000 to $299,999 | 59 (8.0%) | 164 (11.2%) |
| $300,000 to $499,999 | 320 (43.4%) | 792 (53.9%) |
| $500,000 to $749,999 | 145 (19.7%) | 446 (30.4%) |
| $750,000 to $999,999 | 49 (6.6%) | 36 (2.5%) |
| $1,000,000 or more | 0 (0.0%) | 13 (0.9%) |
| Total | 738 (100.0%) | 1,469 (100.0%) |
Household Income by Mortgage Status in Sumner
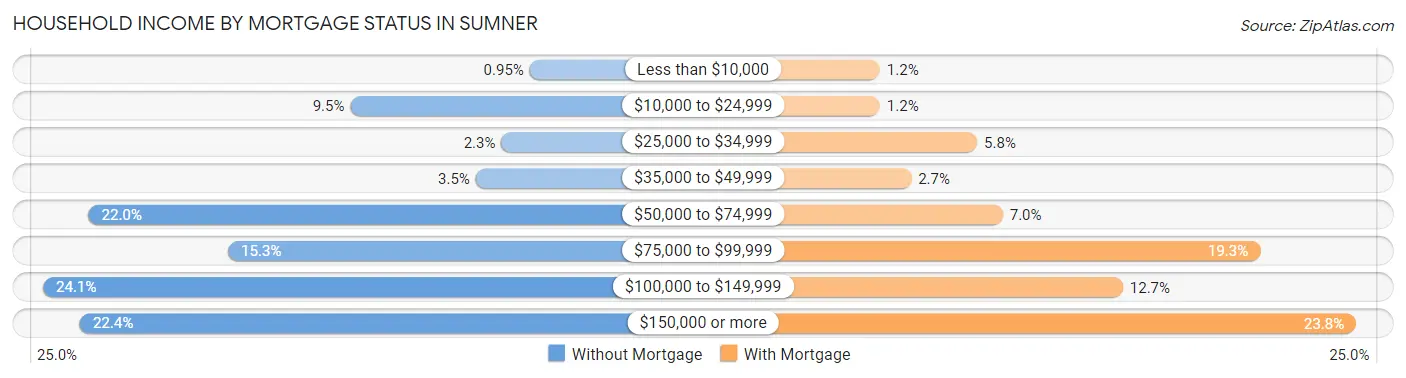
| Household Income | Without Mortgage | With Mortgage |
| Less than $10,000 | 7 (0.9%) | 17 (1.2%) |
| $10,000 to $24,999 | 70 (9.5%) | 17 (1.2%) |
| $25,000 to $34,999 | 17 (2.3%) | 85 (5.8%) |
| $35,000 to $49,999 | 26 (3.5%) | 39 (2.6%) |
| $50,000 to $74,999 | 162 (22.0%) | 103 (7.0%) |
| $75,000 to $99,999 | 113 (15.3%) | 283 (19.3%) |
| $100,000 to $149,999 | 178 (24.1%) | 187 (12.7%) |
| $150,000 or more | 165 (22.4%) | 350 (23.8%) |
| Total | 738 (100.0%) | 1,469 (100.0%) |
Property Value to Household Income Ratio in Sumner
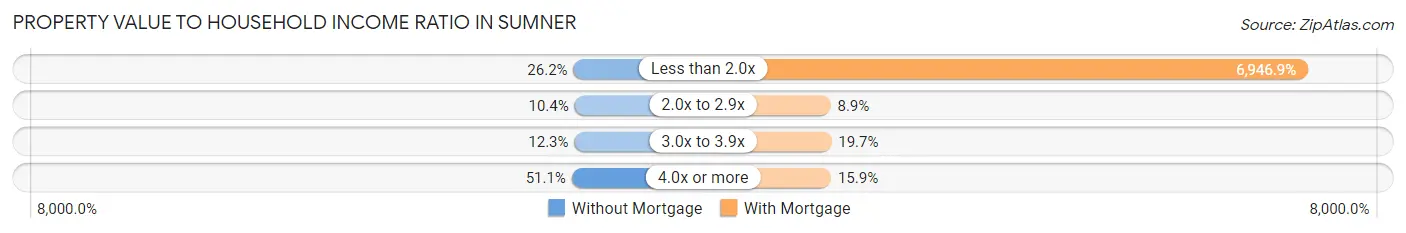
| Value-to-Income Ratio | Without Mortgage | With Mortgage |
| Less than 2.0x | 193 (26.2%) | 102,050 (6,946.9%) |
| 2.0x to 2.9x | 77 (10.4%) | 131 (8.9%) |
| 3.0x to 3.9x | 91 (12.3%) | 290 (19.7%) |
| 4.0x or more | 377 (51.1%) | 233 (15.9%) |
| Total | 738 (100.0%) | 1,469 (100.0%) |
Real Estate Taxes by Mortgage Status in Sumner
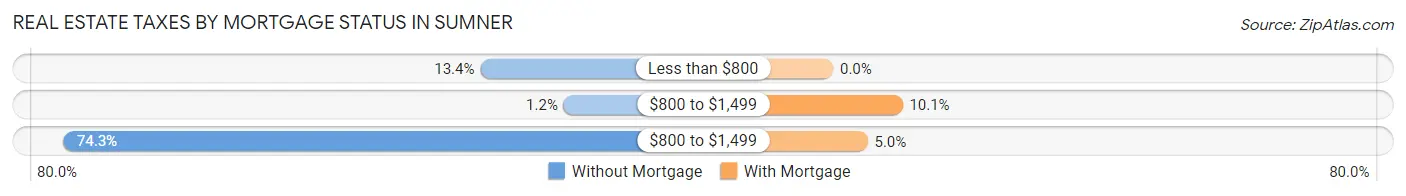
| Property Taxes | Without Mortgage | With Mortgage |
| Less than $800 | 99 (13.4%) | 0 (0.0%) |
| $800 to $1,499 | 9 (1.2%) | 149 (10.1%) |
| $800 to $1,499 | 548 (74.3%) | 74 (5.0%) |
| Total | 738 (100.0%) | 1,469 (100.0%) |
Health & Disability in Sumner
Health Insurance Coverage by Age in Sumner
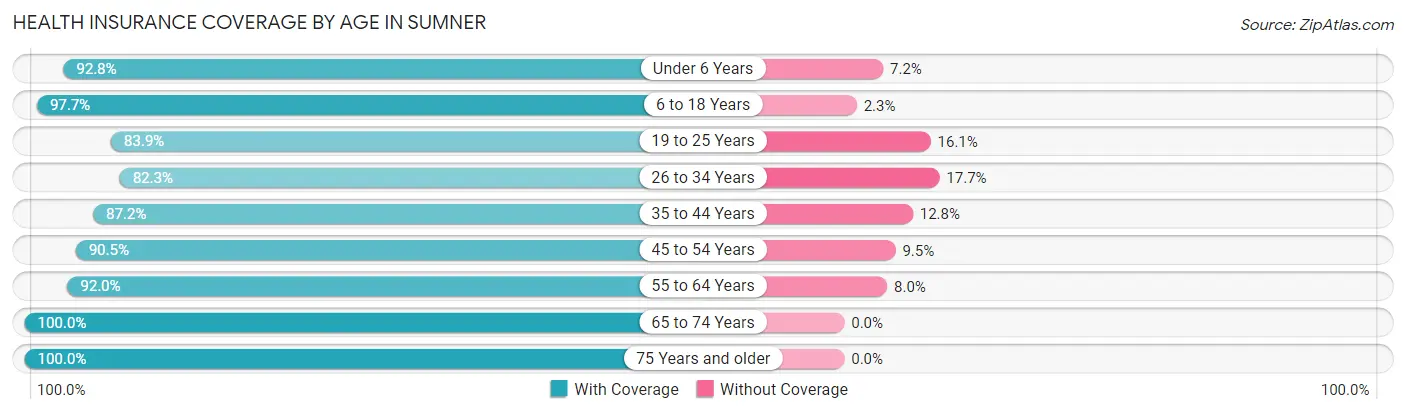
| Age Bracket | With Coverage | Without Coverage |
| Under 6 Years | 769 (92.8%) | 60 (7.2%) |
| 6 to 18 Years | 1,521 (97.7%) | 36 (2.3%) |
| 19 to 25 Years | 594 (83.9%) | 114 (16.1%) |
| 26 to 34 Years | 1,516 (82.3%) | 327 (17.7%) |
| 35 to 44 Years | 1,148 (87.2%) | 168 (12.8%) |
| 45 to 54 Years | 1,318 (90.5%) | 139 (9.5%) |
| 55 to 64 Years | 1,026 (92.0%) | 89 (8.0%) |
| 65 to 74 Years | 966 (100.0%) | 0 (0.0%) |
| 75 Years and older | 640 (100.0%) | 0 (0.0%) |
| Total | 9,498 (91.1%) | 933 (8.9%) |
Health Insurance Coverage by Citizenship Status in Sumner
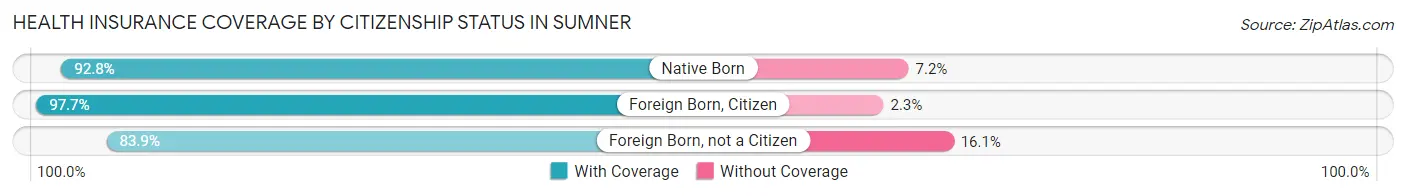
| Citizenship Status | With Coverage | Without Coverage |
| Native Born | 769 (92.8%) | 60 (7.2%) |
| Foreign Born, Citizen | 1,521 (97.7%) | 36 (2.3%) |
| Foreign Born, not a Citizen | 594 (83.9%) | 114 (16.1%) |
Health Insurance Coverage by Household Income in Sumner
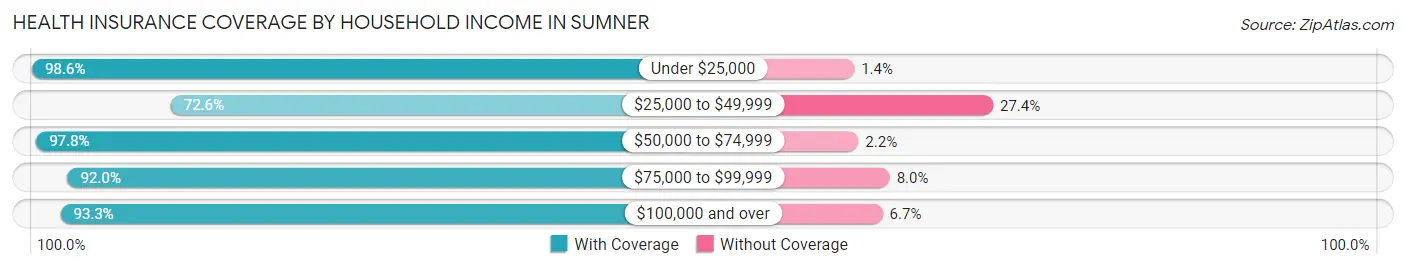
| Household Income | With Coverage | Without Coverage |
| Under $25,000 | 637 (98.6%) | 9 (1.4%) |
| $25,000 to $49,999 | 1,068 (72.6%) | 403 (27.4%) |
| $50,000 to $74,999 | 1,301 (97.8%) | 29 (2.2%) |
| $75,000 to $99,999 | 1,658 (92.0%) | 145 (8.0%) |
| $100,000 and over | 4,816 (93.3%) | 347 (6.7%) |
Public vs Private Health Insurance Coverage by Age in Sumner
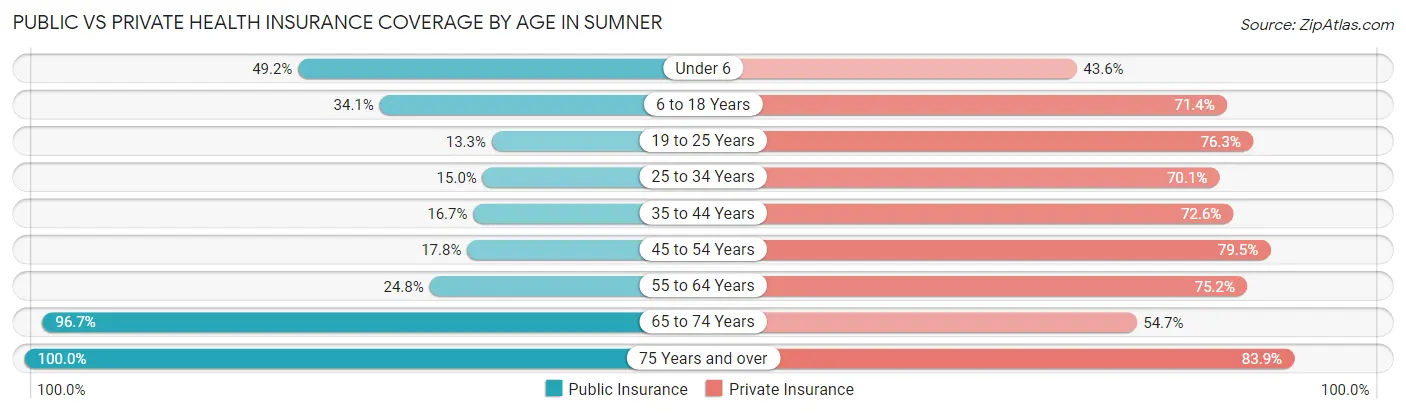
| Age Bracket | Public Insurance | Private Insurance |
| Under 6 | 408 (49.2%) | 361 (43.5%) |
| 6 to 18 Years | 531 (34.1%) | 1,112 (71.4%) |
| 19 to 25 Years | 94 (13.3%) | 540 (76.3%) |
| 25 to 34 Years | 276 (15.0%) | 1,291 (70.1%) |
| 35 to 44 Years | 220 (16.7%) | 956 (72.6%) |
| 45 to 54 Years | 260 (17.8%) | 1,158 (79.5%) |
| 55 to 64 Years | 277 (24.8%) | 838 (75.2%) |
| 65 to 74 Years | 934 (96.7%) | 528 (54.7%) |
| 75 Years and over | 640 (100.0%) | 537 (83.9%) |
| Total | 3,640 (34.9%) | 7,321 (70.2%) |
Disability Status by Sex by Age in Sumner
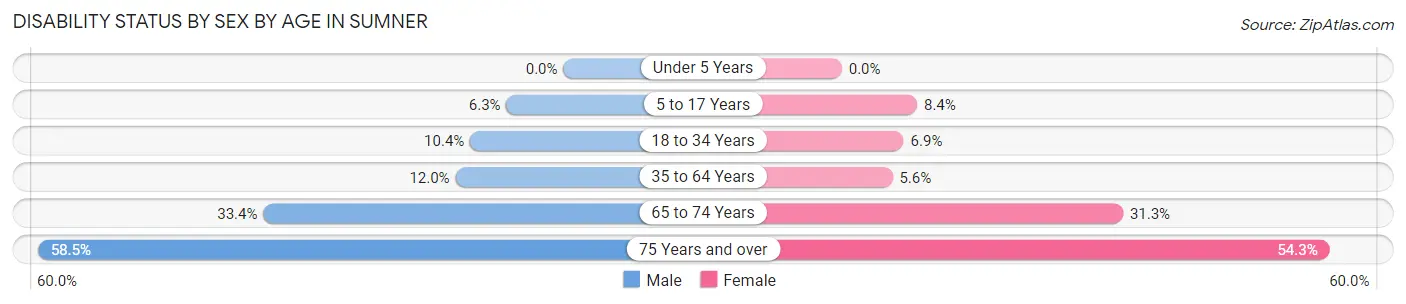
| Age Bracket | Male | Female |
| Under 5 Years | 0 (0.0%) | 0 (0.0%) |
| 5 to 17 Years | 50 (6.3%) | 66 (8.4%) |
| 18 to 34 Years | 133 (10.4%) | 94 (6.9%) |
| 35 to 64 Years | 235 (12.0%) | 109 (5.6%) |
| 65 to 74 Years | 136 (33.4%) | 175 (31.3%) |
| 75 Years and over | 144 (58.5%) | 214 (54.3%) |
Disability Class by Sex by Age in Sumner
Disability Class: Hearing Difficulty
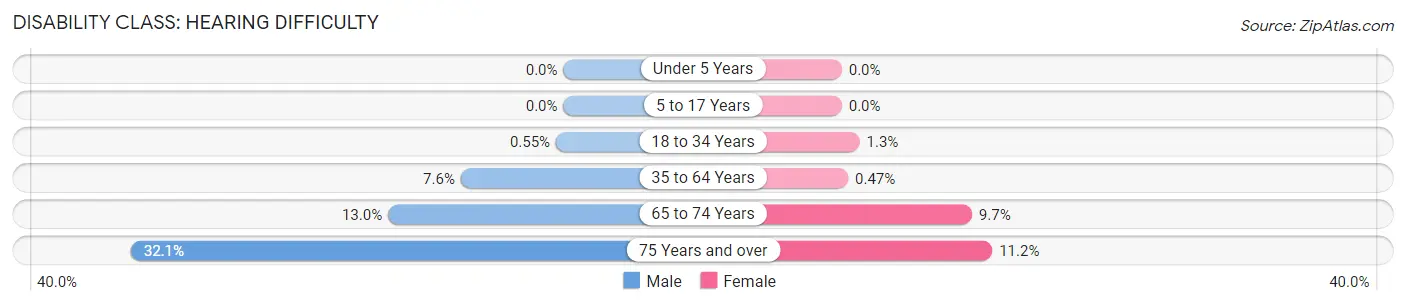
| Age Bracket | Male | Female |
| Under 5 Years | 0 (0.0%) | 0 (0.0%) |
| 5 to 17 Years | 0 (0.0%) | 0 (0.0%) |
| 18 to 34 Years | 7 (0.5%) | 18 (1.3%) |
| 35 to 64 Years | 149 (7.6%) | 9 (0.5%) |
| 65 to 74 Years | 53 (13.0%) | 54 (9.7%) |
| 75 Years and over | 79 (32.1%) | 44 (11.2%) |
Disability Class: Vision Difficulty
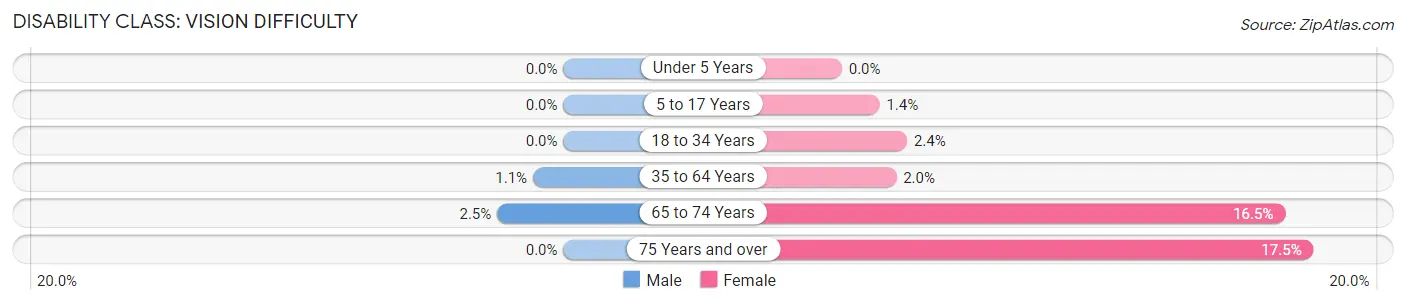
| Age Bracket | Male | Female |
| Under 5 Years | 0 (0.0%) | 0 (0.0%) |
| 5 to 17 Years | 0 (0.0%) | 11 (1.4%) |
| 18 to 34 Years | 0 (0.0%) | 33 (2.4%) |
| 35 to 64 Years | 22 (1.1%) | 39 (2.0%) |
| 65 to 74 Years | 10 (2.5%) | 92 (16.5%) |
| 75 Years and over | 0 (0.0%) | 69 (17.5%) |
Disability Class: Cognitive Difficulty
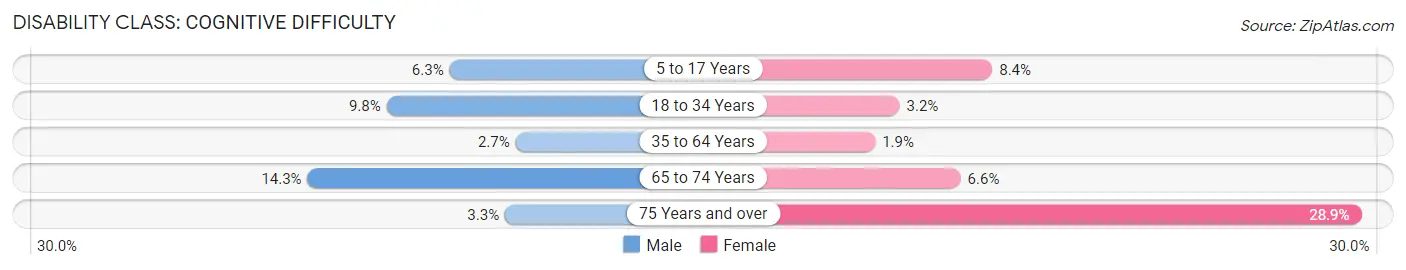
| Age Bracket | Male | Female |
| 5 to 17 Years | 50 (6.3%) | 66 (8.4%) |
| 18 to 34 Years | 126 (9.8%) | 44 (3.2%) |
| 35 to 64 Years | 52 (2.7%) | 36 (1.9%) |
| 65 to 74 Years | 58 (14.2%) | 37 (6.6%) |
| 75 Years and over | 8 (3.3%) | 114 (28.9%) |
Disability Class: Ambulatory Difficulty
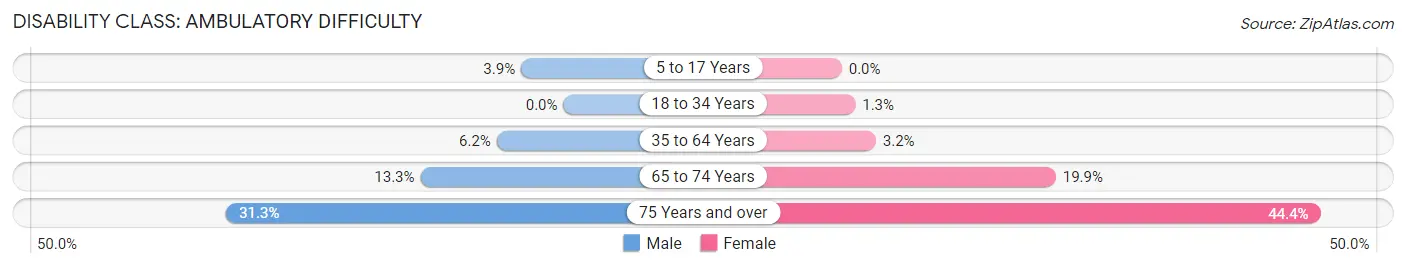
| Age Bracket | Male | Female |
| 5 to 17 Years | 31 (3.9%) | 0 (0.0%) |
| 18 to 34 Years | 0 (0.0%) | 17 (1.3%) |
| 35 to 64 Years | 121 (6.2%) | 61 (3.2%) |
| 65 to 74 Years | 54 (13.3%) | 111 (19.9%) |
| 75 Years and over | 77 (31.3%) | 175 (44.4%) |
Disability Class: Self-Care Difficulty
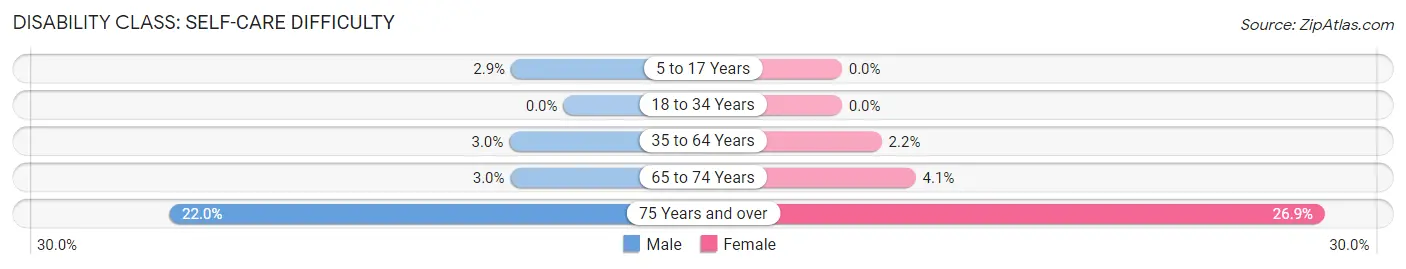
| Age Bracket | Male | Female |
| 5 to 17 Years | 23 (2.9%) | 0 (0.0%) |
| 18 to 34 Years | 0 (0.0%) | 0 (0.0%) |
| 35 to 64 Years | 59 (3.0%) | 43 (2.2%) |
| 65 to 74 Years | 12 (2.9%) | 23 (4.1%) |
| 75 Years and over | 54 (22.0%) | 106 (26.9%) |
Technology Access in Sumner
Computing Device Access in Sumner
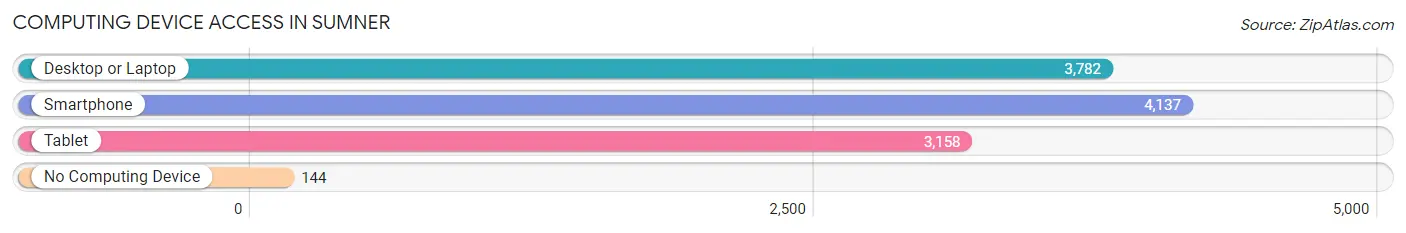
| Device Type | # Households | % Households |
| Desktop or Laptop | 3,782 | 85.7% |
| Smartphone | 4,137 | 93.8% |
| Tablet | 3,158 | 71.6% |
| No Computing Device | 144 | 3.3% |
| Total | 4,413 | 100.0% |
Internet Access in Sumner
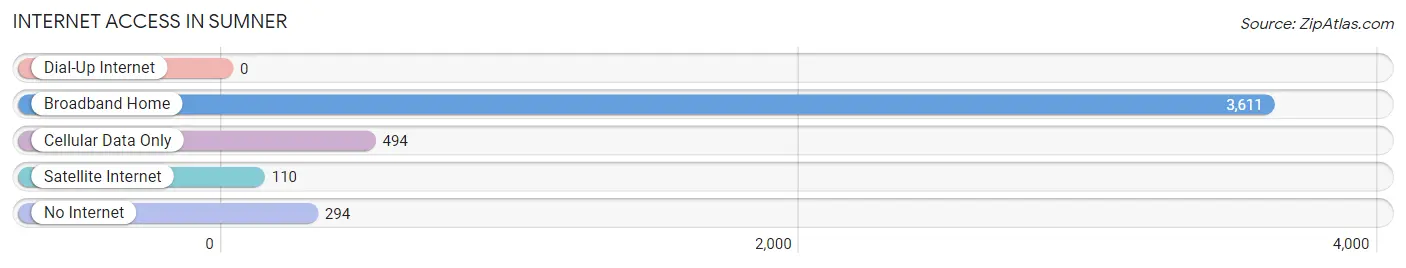
| Internet Type | # Households | % Households |
| Dial-Up Internet | 0 | 0.0% |
| Broadband Home | 3,611 | 81.8% |
| Cellular Data Only | 494 | 11.2% |
| Satellite Internet | 110 | 2.5% |
| No Internet | 294 | 6.7% |
| Total | 4,413 | 100.0% |
Sumner Summary
Sumner, Washington is a small city located in Pierce County, Washington, United States. It is located approximately 25 miles southeast of Tacoma and is part of the Seattle metropolitan area. The population of Sumner was 9,451 at the 2010 census.
History
The area that is now Sumner was first settled in 1853 by Ezra Meeker and his family. Meeker was a pioneer who traveled the Oregon Trail and was instrumental in the development of the area. He established a homestead and a trading post, which became the nucleus of the town. The town was officially incorporated in 1890 and was named after U.S. Senator Charles Sumner.
Geography
Sumner is located at 47°14′N 122°13′W (47.23, -122.21). According to the United States Census Bureau, the city has a total area of 4.3 square miles, all of it land.
Economy
Sumner’s economy is largely based on agriculture and light manufacturing. The city is home to several large farms, including the Meeker family’s original homestead. The city is also home to several light manufacturing companies, including a large paper mill and a canning factory.
Demographics
As of the 2010 census, there were 9,451 people, 3,717 households, and 2,541 families residing in the city. The population density was 2,193.3 people per square mile. The racial makeup of the city was 81.2% White, 5.2% African American, 0.7% Native American, 4.2% Asian, 0.2% Pacific Islander, 5.2% from other races, and 3.3% from two or more races. Hispanic or Latino of any race were 11.2% of the population.
The median income for a household in the city was $50,945, and the median income for a family was $60,945. The per capita income for the city was $23,945. About 8.2% of families and 10.2% of the population were below the poverty line, including 14.2% of those under age 18 and 6.2% of those age 65 or over.
Sumner is a small city with a rich history and a diverse population. It is home to several large farms and light manufacturing companies, and its economy is largely based on agriculture and light manufacturing. The city has a median income that is higher than the national average, and its population is diverse, with a mix of races and ethnicities. Sumner is a great place to live and work, and its residents enjoy a high quality of life.
Common Questions
What is Per Capita Income in Sumner?
Per Capita income in Sumner is $42,659.
What is the Median Family Income in Sumner?
Median Family Income in Sumner is $93,500.
What is the Median Household income in Sumner?
Median Household Income in Sumner is $83,285.
What is Income or Wage Gap in Sumner?
Income or Wage Gap in Sumner is 34.5%.
Women in Sumner earn 65.5 cents for every dollar earned by a man.
What is Inequality or Gini Index in Sumner?
Inequality or Gini Index in Sumner is 0.39.
What is the Total Population of Sumner?
Total Population of Sumner is 10,589.
What is the Total Male Population of Sumner?
Total Male Population of Sumner is 5,104.
What is the Total Female Population of Sumner?
Total Female Population of Sumner is 5,485.
What is the Ratio of Males per 100 Females in Sumner?
There are 93.05 Males per 100 Females in Sumner.
What is the Ratio of Females per 100 Males in Sumner?
There are 107.46 Females per 100 Males in Sumner.
What is the Median Population Age in Sumner?
Median Population Age in Sumner is 37.0 Years.
What is the Average Family Size in Sumner
Average Family Size in Sumner is 3.0 People.
What is the Average Household Size in Sumner
Average Household Size in Sumner is 2.4 People.
How Large is the Labor Force in Sumner?
There are 5,406 People in the Labor Forcein in Sumner.
What is the Percentage of People in the Labor Force in Sumner?
63.3% of People are in the Labor Force in Sumner.
What is the Unemployment Rate in Sumner?
Unemployment Rate in Sumner is 4.4%.