La Conner, WA Map & Demographics
La Conner Map
La Conner Overview
$47,466
PER CAPITA INCOME
$117,708
AVG FAMILY INCOME
$72,981
AVG HOUSEHOLD INCOME
17.7%
WAGE / INCOME GAP [ % ]
82.3¢/ $1
WAGE / INCOME GAP [ $ ]
0.47
INEQUALITY / GINI INDEX
1,000
TOTAL POPULATION
503
MALE POPULATION
497
FEMALE POPULATION
101.21
MALES / 100 FEMALES
98.81
FEMALES / 100 MALES
59.5
MEDIAN AGE
2.8
AVG FAMILY SIZE
2.0
AVG HOUSEHOLD SIZE
462
LABOR FORCE [ PEOPLE ]
51.3%
PERCENT IN LABOR FORCE
0.4%
UNEMPLOYMENT RATE
La Conner Zip Codes
La Conner Area Codes
Income in La Conner
Income Overview in La Conner
Per Capita Income in La Conner is $47,466, while median incomes of families and households are $117,708 and $72,981 respectively.
| Characteristic | Number | Measure |
| Per Capita Income | 1,000 | $47,466 |
| Median Family Income | 270 | $117,708 |
| Mean Family Income | 270 | $136,407 |
| Median Household Income | 489 | $72,981 |
| Mean Household Income | 489 | $95,523 |
| Income Deficit | 270 | $0 |
| Wage / Income Gap (%) | 1,000 | 17.67% |
| Wage / Income Gap ($) | 1,000 | 82.33¢ per $1 |
| Gini / Inequality Index | 1,000 | 0.47 |
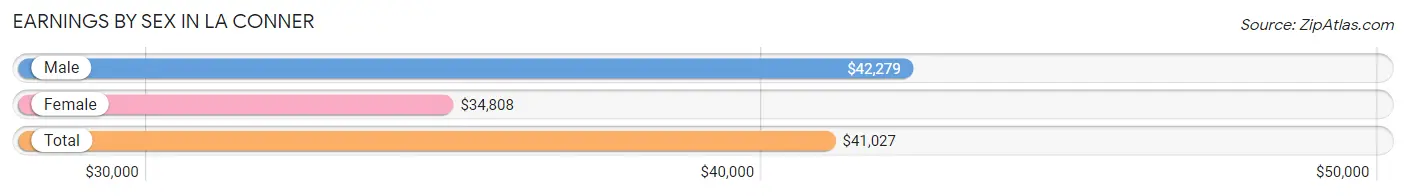
Earnings by Sex in La Conner
Average Earnings in La Conner are $41,027, $42,279 for men and $34,808 for women, a difference of 17.7%.
| Sex | Number | Average Earnings |
| Male | 227 (43.7%) | $42,279 |
| Female | 292 (56.3%) | $34,808 |
| Total | 519 (100.0%) | $41,027 |
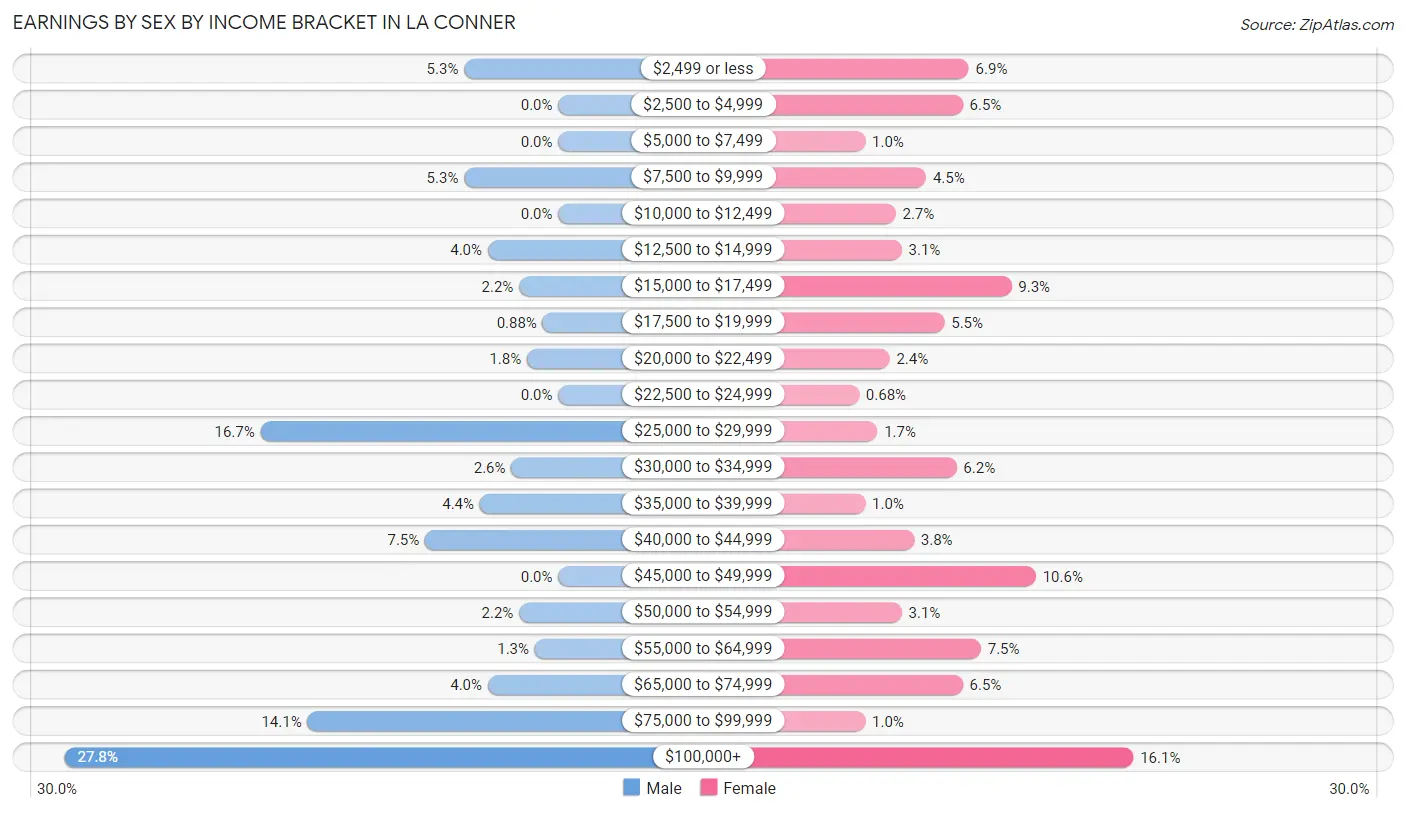
Earnings by Sex by Income Bracket in La Conner
The most common earnings brackets in La Conner are $100,000+ for men (63 | 27.8%) and $100,000+ for women (47 | 16.1%).
| Income | Male | Female |
| $2,499 or less | 12 (5.3%) | 20 (6.9%) |
| $2,500 to $4,999 | 0 (0.0%) | 19 (6.5%) |
| $5,000 to $7,499 | 0 (0.0%) | 3 (1.0%) |
| $7,500 to $9,999 | 12 (5.3%) | 13 (4.4%) |
| $10,000 to $12,499 | 0 (0.0%) | 8 (2.7%) |
| $12,500 to $14,999 | 9 (4.0%) | 9 (3.1%) |
| $15,000 to $17,499 | 5 (2.2%) | 27 (9.2%) |
| $17,500 to $19,999 | 2 (0.9%) | 16 (5.5%) |
| $20,000 to $22,499 | 4 (1.8%) | 7 (2.4%) |
| $22,500 to $24,999 | 0 (0.0%) | 2 (0.7%) |
| $25,000 to $29,999 | 38 (16.7%) | 5 (1.7%) |
| $30,000 to $34,999 | 6 (2.6%) | 18 (6.2%) |
| $35,000 to $39,999 | 10 (4.4%) | 3 (1.0%) |
| $40,000 to $44,999 | 17 (7.5%) | 11 (3.8%) |
| $45,000 to $49,999 | 0 (0.0%) | 31 (10.6%) |
| $50,000 to $54,999 | 5 (2.2%) | 9 (3.1%) |
| $55,000 to $64,999 | 3 (1.3%) | 22 (7.5%) |
| $65,000 to $74,999 | 9 (4.0%) | 19 (6.5%) |
| $75,000 to $99,999 | 32 (14.1%) | 3 (1.0%) |
| $100,000+ | 63 (27.8%) | 47 (16.1%) |
| Total | 227 (100.0%) | 292 (100.0%) |
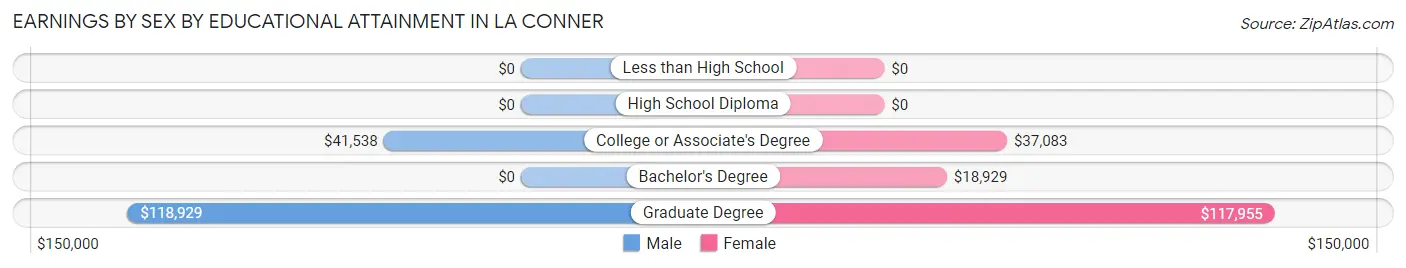
Earnings by Sex by Educational Attainment in La Conner
Average earnings in La Conner are $54,750 for men and $41,591 for women, a difference of 24.0%. Men with an educational attainment of graduate degree enjoy the highest average annual earnings of $118,929, while those with college or associate's degree education earn the least with $41,538. Women with an educational attainment of graduate degree earn the most with the average annual earnings of $117,955, while those with bachelor's degree education have the smallest earnings of $18,929.
| Educational Attainment | Male Income | Female Income |
| Less than High School | - | - |
| High School Diploma | - | - |
| College or Associate's Degree | $41,538 | $37,083 |
| Bachelor's Degree | - | - |
| Graduate Degree | $118,929 | $117,955 |
| Total | $54,750 | $41,591 |
Family Income in La Conner
Family Income Brackets in La Conner
According to the La Conner family income data, there are 62 families falling into the $150,000 to $199,999 income range, which is the most common income bracket and makes up 23.0% of all families.
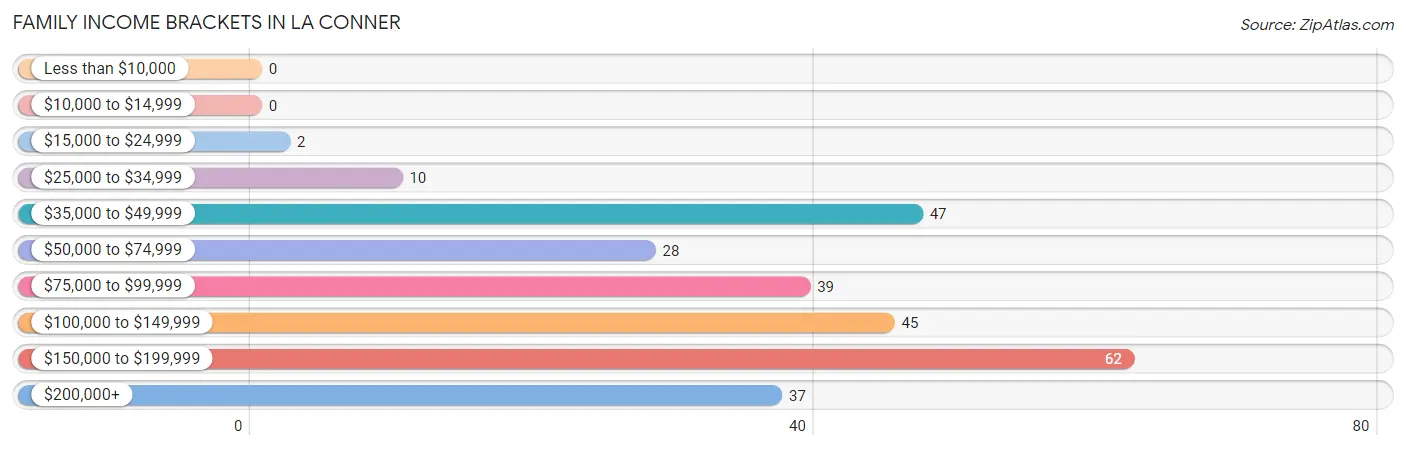
| Income Bracket | # Families | % Families |
| Less than $10,000 | 0 | 0.0% |
| $10,000 to $14,999 | 0 | 0.0% |
| $15,000 to $24,999 | 2 | 0.7% |
| $25,000 to $34,999 | 10 | 3.7% |
| $35,000 to $49,999 | 47 | 17.4% |
| $50,000 to $74,999 | 28 | 10.4% |
| $75,000 to $99,999 | 39 | 14.4% |
| $100,000 to $149,999 | 45 | 16.7% |
| $150,000 to $199,999 | 62 | 23.0% |
| $200,000+ | 37 | 13.7% |
Family Income by Famaliy Size in La Conner
3-person families (22 | 8.2%) account for the highest median family income in La Conner with $140,000 per family, while 2-person families (189 | 70.0%) have the highest median income of $54,532 per family member.
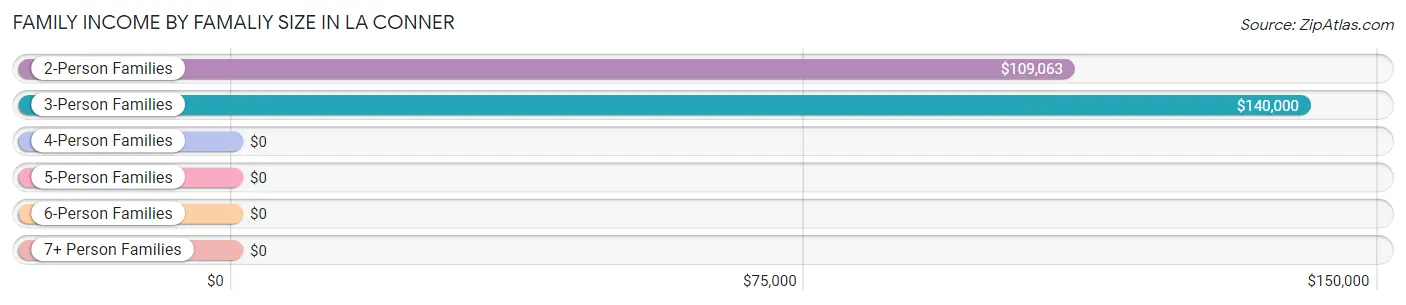
| Income Bracket | # Families | Median Income |
| 2-Person Families | 189 (70.0%) | $109,063 |
| 3-Person Families | 22 (8.2%) | $140,000 |
| 4-Person Families | 47 (17.4%) | $0 |
| 5-Person Families | 9 (3.3%) | $0 |
| 6-Person Families | 0 (0.0%) | $0 |
| 7+ Person Families | 3 (1.1%) | $0 |
| Total | 270 (100.0%) | $117,708 |
Family Income by Number of Earners in La Conner
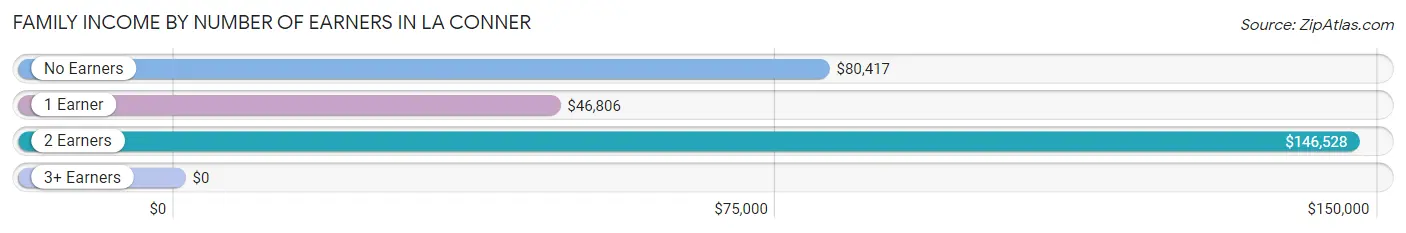
| Number of Earners | # Families | Median Income |
| No Earners | 29 (10.7%) | $80,417 |
| 1 Earner | 87 (32.2%) | $46,806 |
| 2 Earners | 135 (50.0%) | $146,528 |
| 3+ Earners | 19 (7.0%) | $0 |
| Total | 270 (100.0%) | $117,708 |
Household Income in La Conner
Household Income Brackets in La Conner
With 82 households falling in the category, the $35,000 to $49,999 income range is the most frequent in La Conner, accounting for 16.8% of all households. In contrast, only 13 households (2.7%) fall into the $15,000 to $24,999 income bracket, making it the least populous group.
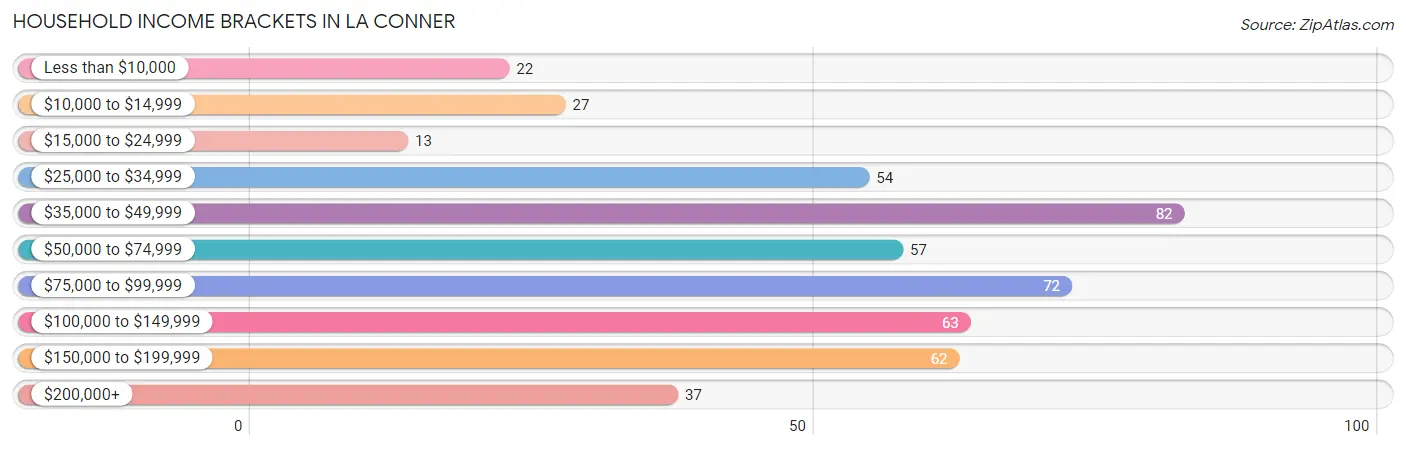
| Income Bracket | # Households | % Households |
| Less than $10,000 | 22 | 4.5% |
| $10,000 to $14,999 | 27 | 5.5% |
| $15,000 to $24,999 | 13 | 2.7% |
| $25,000 to $34,999 | 54 | 11.0% |
| $35,000 to $49,999 | 82 | 16.8% |
| $50,000 to $74,999 | 57 | 11.7% |
| $75,000 to $99,999 | 72 | 14.7% |
| $100,000 to $149,999 | 63 | 12.9% |
| $150,000 to $199,999 | 62 | 12.7% |
| $200,000+ | 37 | 7.6% |
Household Income by Householder Age in La Conner
The median household income in La Conner is $72,981, with the highest median household income of $90,625 found in the 45 to 64 years age bracket for the primary householder. A total of 162 households (33.1%) fall into this category.
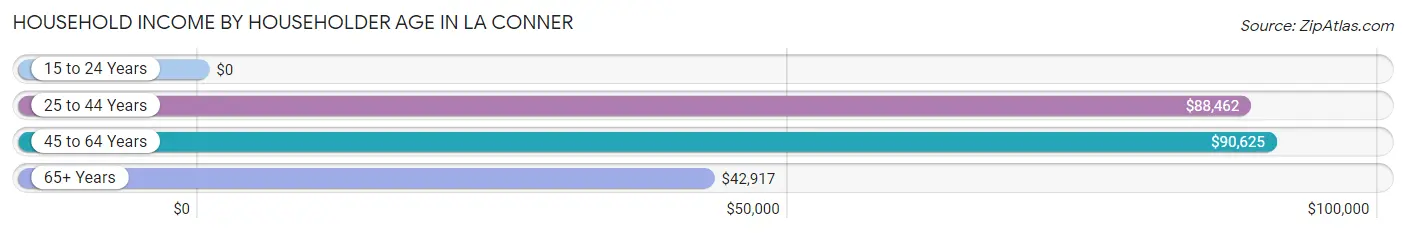
| Income Bracket | # Households | Median Income |
| 15 to 24 Years | 0 (0.0%) | $0 |
| 25 to 44 Years | 68 (13.9%) | $88,462 |
| 45 to 64 Years | 162 (33.1%) | $90,625 |
| 65+ Years | 259 (53.0%) | $42,917 |
| Total | 489 (100.0%) | $72,981 |
Poverty in La Conner
Income Below Poverty by Sex and Age in La Conner
With 2.4% poverty level for males and 13.5% for females among the residents of La Conner, 12 to 14 year old males and 6 to 11 year old females are the most vulnerable to poverty, with 2 males (11.8%) and 4 females (100.0%) in their respective age groups living below the poverty level.
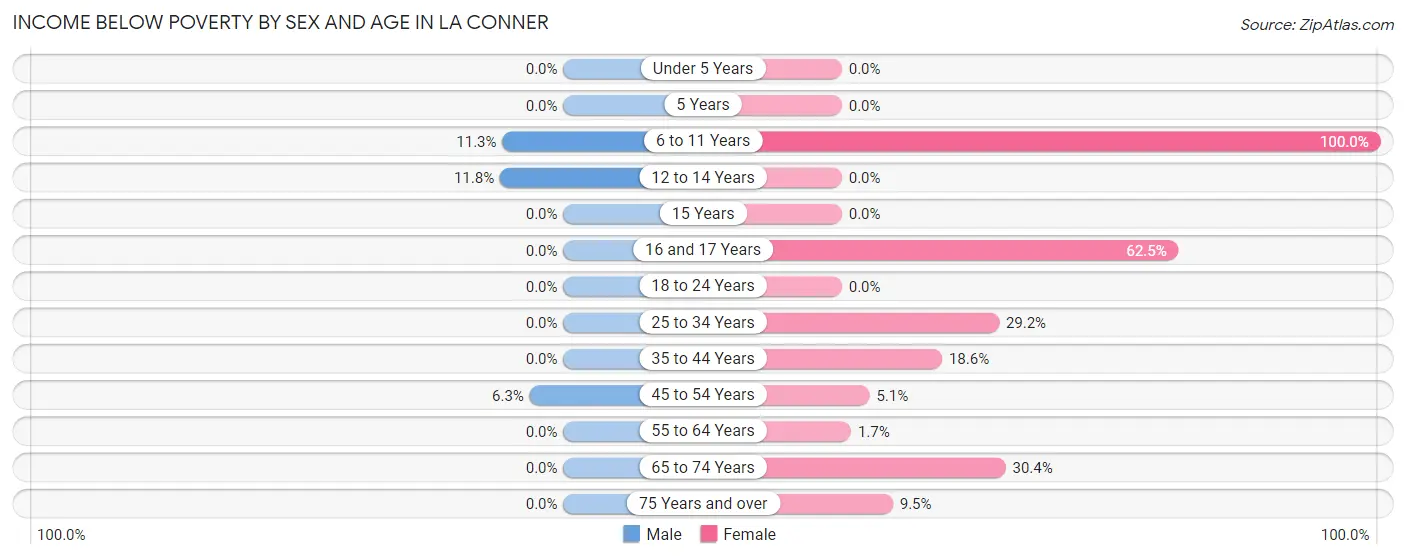
| Age Bracket | Male | Female |
| Under 5 Years | 0 (0.0%) | 0 (0.0%) |
| 5 Years | 0 (0.0%) | 0 (0.0%) |
| 6 to 11 Years | 6 (11.3%) | 4 (100.0%) |
| 12 to 14 Years | 2 (11.8%) | 0 (0.0%) |
| 15 Years | 0 (0.0%) | 0 (0.0%) |
| 16 and 17 Years | 0 (0.0%) | 5 (62.5%) |
| 18 to 24 Years | 0 (0.0%) | 0 (0.0%) |
| 25 to 34 Years | 0 (0.0%) | 7 (29.2%) |
| 35 to 44 Years | 0 (0.0%) | 8 (18.6%) |
| 45 to 54 Years | 4 (6.2%) | 2 (5.1%) |
| 55 to 64 Years | 0 (0.0%) | 3 (1.7%) |
| 65 to 74 Years | 0 (0.0%) | 31 (30.4%) |
| 75 Years and over | 0 (0.0%) | 7 (9.5%) |
| Total | 12 (2.4%) | 67 (13.5%) |
Income Above Poverty by Sex and Age in La Conner
According to the poverty statistics in La Conner, males aged under 5 years and females aged under 5 years are the age groups that are most secure financially, with 100.0% of males and 100.0% of females in these age groups living above the poverty line.
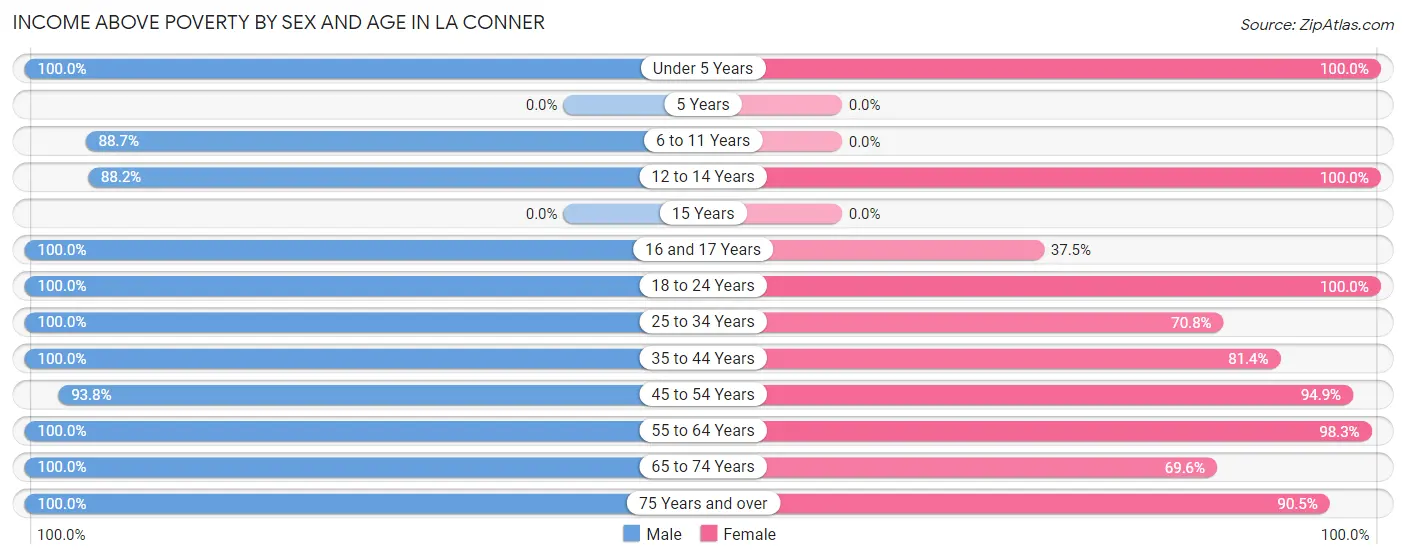
| Age Bracket | Male | Female |
| Under 5 Years | 12 (100.0%) | 6 (100.0%) |
| 5 Years | 0 (0.0%) | 0 (0.0%) |
| 6 to 11 Years | 47 (88.7%) | 0 (0.0%) |
| 12 to 14 Years | 15 (88.2%) | 7 (100.0%) |
| 15 Years | 0 (0.0%) | 0 (0.0%) |
| 16 and 17 Years | 29 (100.0%) | 3 (37.5%) |
| 18 to 24 Years | 16 (100.0%) | 14 (100.0%) |
| 25 to 34 Years | 23 (100.0%) | 17 (70.8%) |
| 35 to 44 Years | 39 (100.0%) | 35 (81.4%) |
| 45 to 54 Years | 60 (93.8%) | 37 (94.9%) |
| 55 to 64 Years | 75 (100.0%) | 173 (98.3%) |
| 65 to 74 Years | 72 (100.0%) | 71 (69.6%) |
| 75 Years and over | 103 (100.0%) | 67 (90.5%) |
| Total | 491 (97.6%) | 430 (86.5%) |
Income Below Poverty Among Married-Couple Families in La Conner
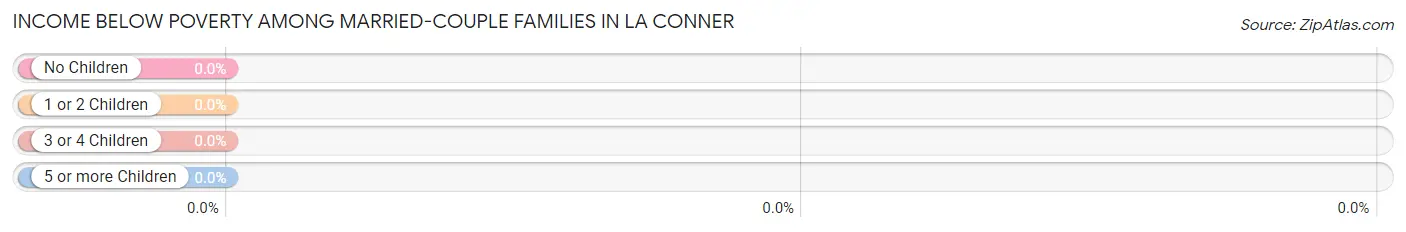
| Children | Above Poverty | Below Poverty |
| No Children | 175 (100.0%) | 0 (0.0%) |
| 1 or 2 Children | 47 (100.0%) | 0 (0.0%) |
| 3 or 4 Children | 12 (100.0%) | 0 (0.0%) |
| 5 or more Children | 0 (0.0%) | 0 (0.0%) |
| Total | 234 (100.0%) | 0 (0.0%) |
Income Below Poverty Among Single-Parent Households in La Conner
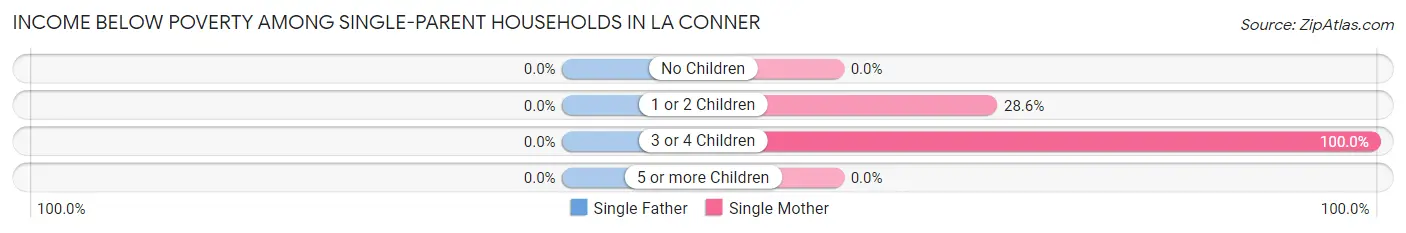
| Children | Single Father | Single Mother |
| No Children | 0 (0.0%) | 0 (0.0%) |
| 1 or 2 Children | 0 (0.0%) | 2 (28.6%) |
| 3 or 4 Children | 0 (0.0%) | 5 (100.0%) |
| 5 or more Children | 0 (0.0%) | 0 (0.0%) |
| Total | 0 (0.0%) | 7 (22.6%) |
Income Below Poverty Among Married-Couple vs Single-Parent Households in La Conner
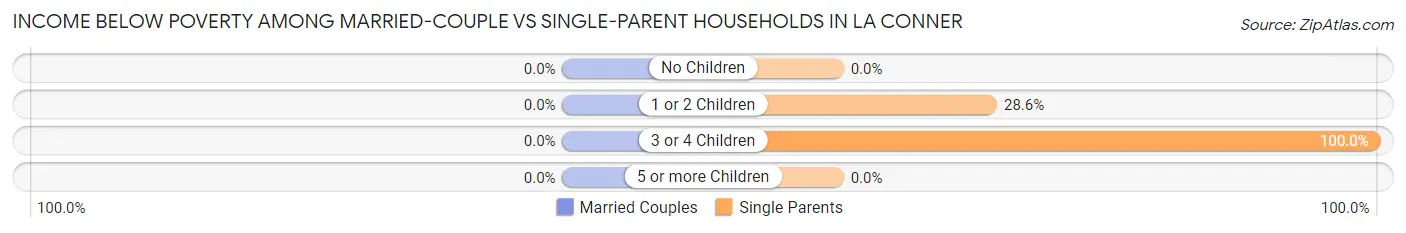
| Children | Married-Couple Families | Single-Parent Households |
| No Children | 0 (0.0%) | 0 (0.0%) |
| 1 or 2 Children | 0 (0.0%) | 2 (28.6%) |
| 3 or 4 Children | 0 (0.0%) | 5 (100.0%) |
| 5 or more Children | 0 (0.0%) | 0 (0.0%) |
| Total | 0 (0.0%) | 7 (19.4%) |
Race in La Conner
The most populous races in La Conner are White / Caucasian (753 | 75.3%), Hispanic or Latino (129 | 12.9%), and Native / Alaskan (88 | 8.8%).
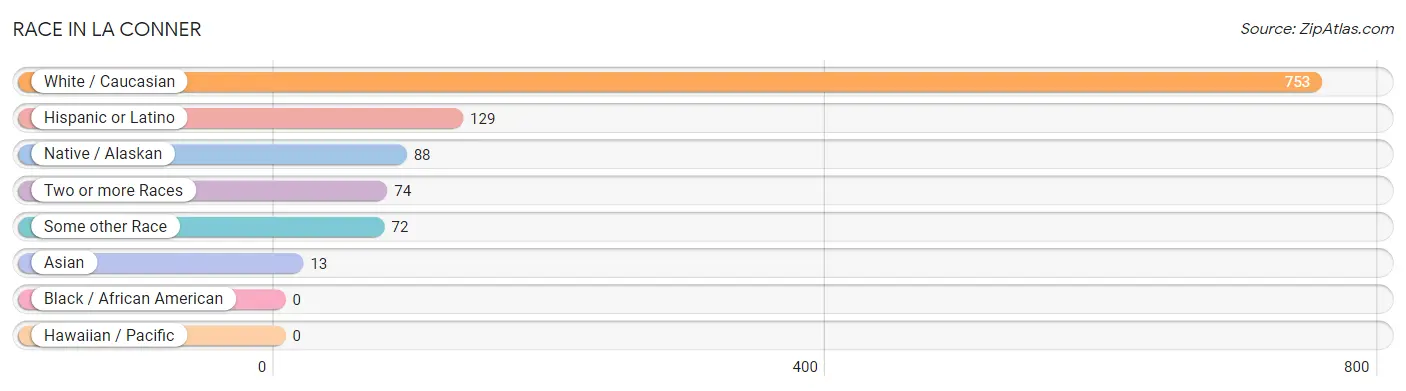
| Race | # Population | % Population |
| Asian | 13 | 1.3% |
| Black / African American | 0 | 0.0% |
| Hawaiian / Pacific | 0 | 0.0% |
| Hispanic or Latino | 129 | 12.9% |
| Native / Alaskan | 88 | 8.8% |
| White / Caucasian | 753 | 75.3% |
| Two or more Races | 74 | 7.4% |
| Some other Race | 72 | 7.2% |
| Total | 1,000 | 100.0% |
Ancestry in La Conner
The most populous ancestries reported in La Conner are English (170 | 17.0%), German (164 | 16.4%), Irish (158 | 15.8%), Norwegian (158 | 15.8%), and Mexican (129 | 12.9%), together accounting for 77.9% of all La Conner residents.
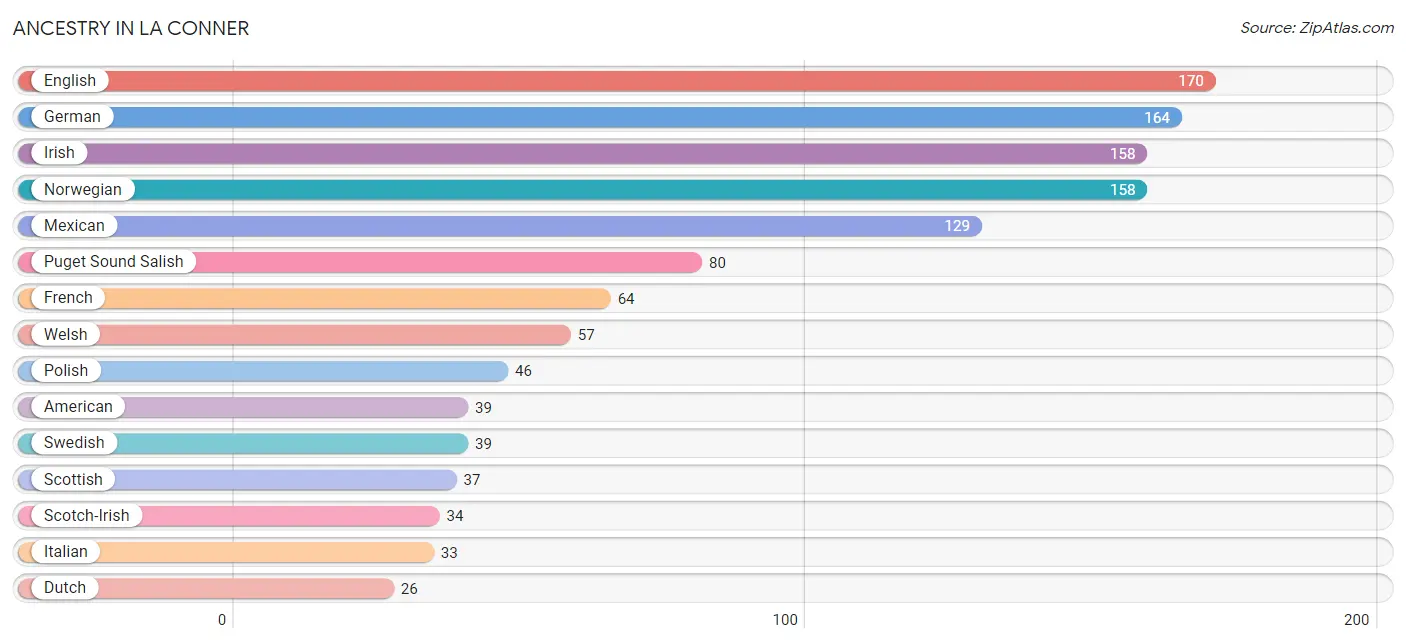
| Ancestry | # Population | % Population |
| American | 39 | 3.9% |
| Bhutanese | 4 | 0.4% |
| British | 7 | 0.7% |
| Chippewa | 3 | 0.3% |
| Danish | 9 | 0.9% |
| Dutch | 26 | 2.6% |
| English | 170 | 17.0% |
| European | 16 | 1.6% |
| Finnish | 10 | 1.0% |
| French | 64 | 6.4% |
| French Canadian | 3 | 0.3% |
| German | 164 | 16.4% |
| Guamanian / Chamorro | 4 | 0.4% |
| Inupiat | 3 | 0.3% |
| Irish | 158 | 15.8% |
| Italian | 33 | 3.3% |
| Korean | 16 | 1.6% |
| Laotian | 7 | 0.7% |
| Mexican | 129 | 12.9% |
| Norwegian | 158 | 15.8% |
| Polish | 46 | 4.6% |
| Portuguese | 2 | 0.2% |
| Puget Sound Salish | 80 | 8.0% |
| Russian | 14 | 1.4% |
| Scandinavian | 9 | 0.9% |
| Scotch-Irish | 34 | 3.4% |
| Scottish | 37 | 3.7% |
| Swedish | 39 | 3.9% |
| Swiss | 7 | 0.7% |
| Thai | 2 | 0.2% |
| Tlingit-Haida | 4 | 0.4% |
| Ukrainian | 3 | 0.3% |
| Welsh | 57 | 5.7% |
| Yakama | 1 | 0.1% | View All 34 Rows |
Immigrants in La Conner
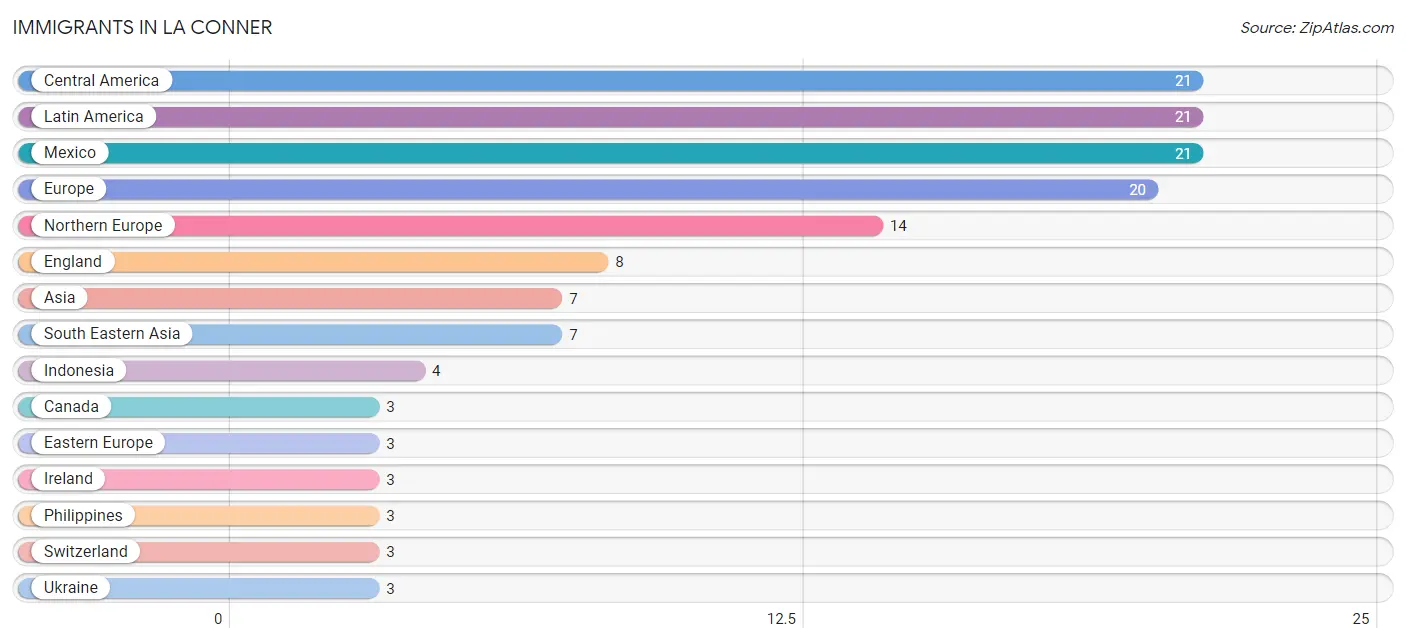
The most numerous immigrant groups reported in La Conner came from Central America (21 | 2.1%), Latin America (21 | 2.1%), Mexico (21 | 2.1%), Europe (20 | 2.0%), and Northern Europe (14 | 1.4%), together accounting for 9.7% of all La Conner residents.
| Immigration Origin | # Population | % Population |
| Asia | 7 | 0.7% |
| Canada | 3 | 0.3% |
| Central America | 21 | 2.1% |
| Eastern Europe | 3 | 0.3% |
| England | 8 | 0.8% |
| Europe | 20 | 2.0% |
| Indonesia | 4 | 0.4% |
| Ireland | 3 | 0.3% |
| Latin America | 21 | 2.1% |
| Mexico | 21 | 2.1% |
| Northern Europe | 14 | 1.4% |
| Philippines | 3 | 0.3% |
| South Eastern Asia | 7 | 0.7% |
| Switzerland | 3 | 0.3% |
| Ukraine | 3 | 0.3% |
| Western Europe | 3 | 0.3% | View All 16 Rows |
Sex and Age in La Conner
Sex and Age in La Conner
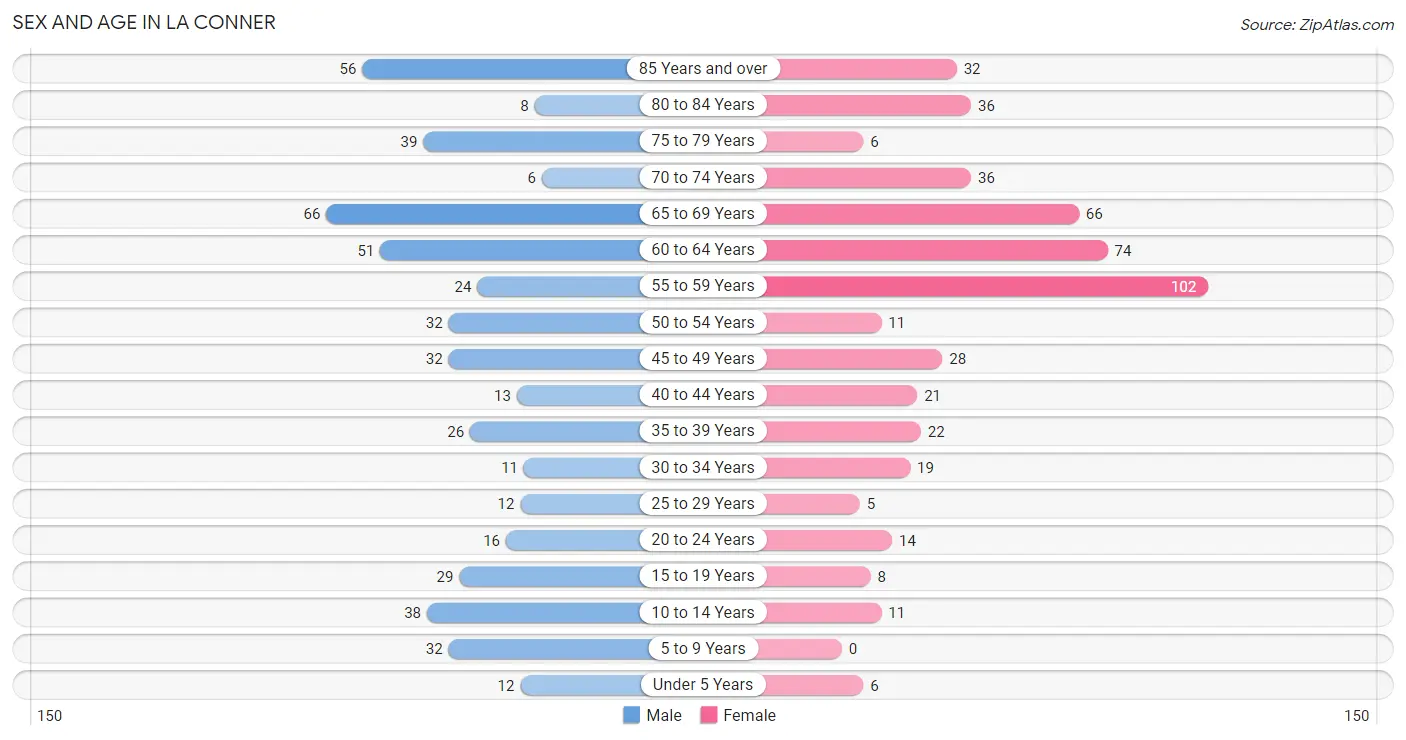
The most populous age groups in La Conner are 65 to 69 Years (66 | 13.1%) for men and 55 to 59 Years (102 | 20.5%) for women.
| Age Bracket | Male | Female |
| Under 5 Years | 12 (2.4%) | 6 (1.2%) |
| 5 to 9 Years | 32 (6.4%) | 0 (0.0%) |
| 10 to 14 Years | 38 (7.5%) | 11 (2.2%) |
| 15 to 19 Years | 29 (5.8%) | 8 (1.6%) |
| 20 to 24 Years | 16 (3.2%) | 14 (2.8%) |
| 25 to 29 Years | 12 (2.4%) | 5 (1.0%) |
| 30 to 34 Years | 11 (2.2%) | 19 (3.8%) |
| 35 to 39 Years | 26 (5.2%) | 22 (4.4%) |
| 40 to 44 Years | 13 (2.6%) | 21 (4.2%) |
| 45 to 49 Years | 32 (6.4%) | 28 (5.6%) |
| 50 to 54 Years | 32 (6.4%) | 11 (2.2%) |
| 55 to 59 Years | 24 (4.8%) | 102 (20.5%) |
| 60 to 64 Years | 51 (10.1%) | 74 (14.9%) |
| 65 to 69 Years | 66 (13.1%) | 66 (13.3%) |
| 70 to 74 Years | 6 (1.2%) | 36 (7.2%) |
| 75 to 79 Years | 39 (7.7%) | 6 (1.2%) |
| 80 to 84 Years | 8 (1.6%) | 36 (7.2%) |
| 85 Years and over | 56 (11.1%) | 32 (6.4%) |
| Total | 503 (100.0%) | 497 (100.0%) |
Families and Households in La Conner
Median Family Size in La Conner
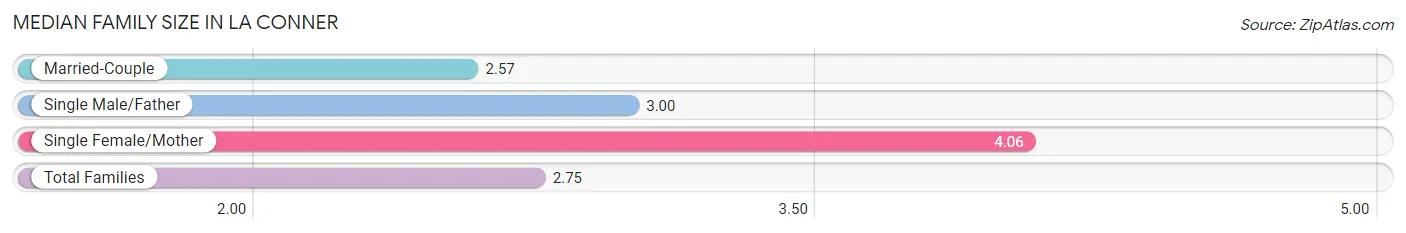
The median family size in La Conner is 2.75 persons per family, with single female/mother families (31 | 11.5%) accounting for the largest median family size of 4.06 persons per family. On the other hand, married-couple families (234 | 86.7%) represent the smallest median family size with 2.57 persons per family.
| Family Type | # Families | Family Size |
| Married-Couple | 234 (86.7%) | 2.57 |
| Single Male/Father | 5 (1.8%) | 3.00 |
| Single Female/Mother | 31 (11.5%) | 4.06 |
| Total Families | 270 (100.0%) | 2.75 |
Median Household Size in La Conner
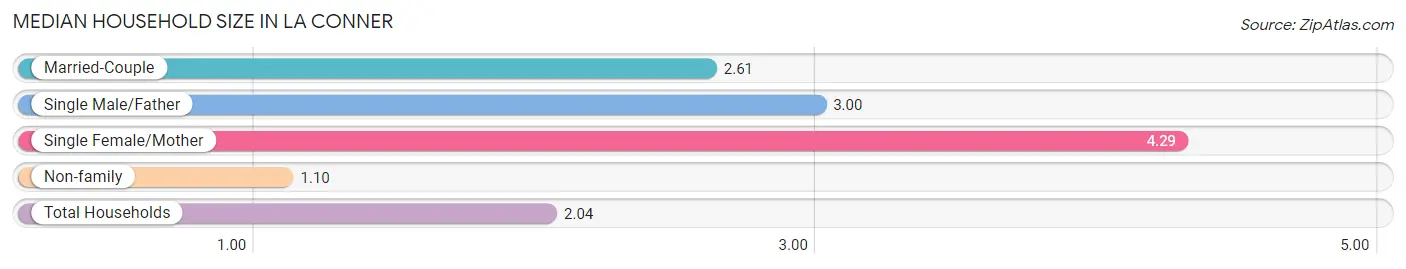
The median household size in La Conner is 2.04 persons per household, with single female/mother households (31 | 6.3%) accounting for the largest median household size of 4.29 persons per household. non-family households (219 | 44.8%) represent the smallest median household size with 1.10 persons per household.
| Household Type | # Households | Household Size |
| Married-Couple | 234 (47.8%) | 2.61 |
| Single Male/Father | 5 (1.0%) | 3.00 |
| Single Female/Mother | 31 (6.3%) | 4.29 |
| Non-family | 219 (44.8%) | 1.10 |
| Total Households | 489 (100.0%) | 2.04 |
Household Size by Marriage Status in La Conner
Out of a total of 489 households in La Conner, 270 (55.2%) are family households, while 219 (44.8%) are nonfamily households. The most numerous type of family households are 2-person households, comprising 177, and the most common type of nonfamily households are 1-person households, comprising 200.
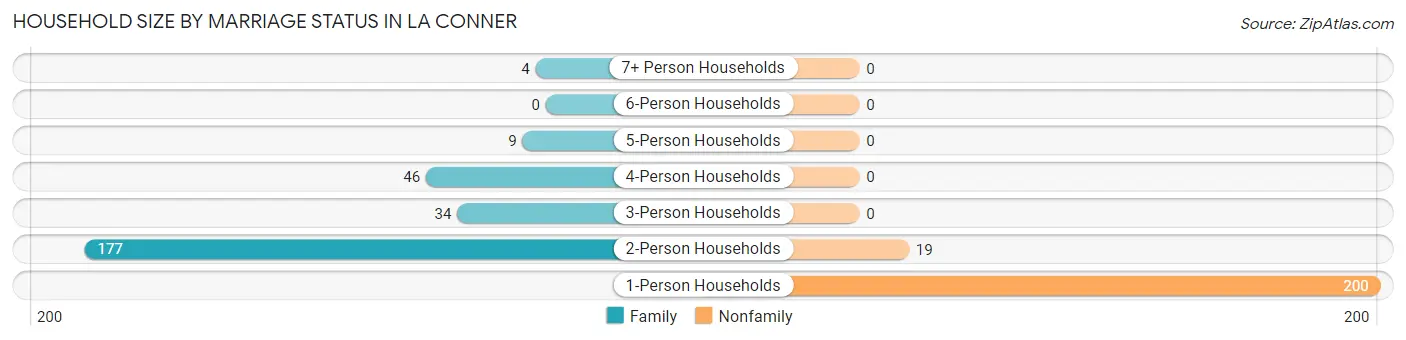
| Household Size | Family Households | Nonfamily Households |
| 1-Person Households | - | 200 (40.9%) |
| 2-Person Households | 177 (36.2%) | 19 (3.9%) |
| 3-Person Households | 34 (7.0%) | 0 (0.0%) |
| 4-Person Households | 46 (9.4%) | 0 (0.0%) |
| 5-Person Households | 9 (1.8%) | 0 (0.0%) |
| 6-Person Households | 0 (0.0%) | 0 (0.0%) |
| 7+ Person Households | 4 (0.8%) | 0 (0.0%) |
| Total | 270 (55.2%) | 219 (44.8%) |
Female Fertility in La Conner
Fertility by Age in La Conner
Average fertility rate in La Conner is 23.0 births per 1,000 women. Women in the age bracket of 20 to 34 years have the highest fertility rate with 79.0 births per 1,000 women. Women in the age bracket of 20 to 34 years acount for 100.0% of all women with births.
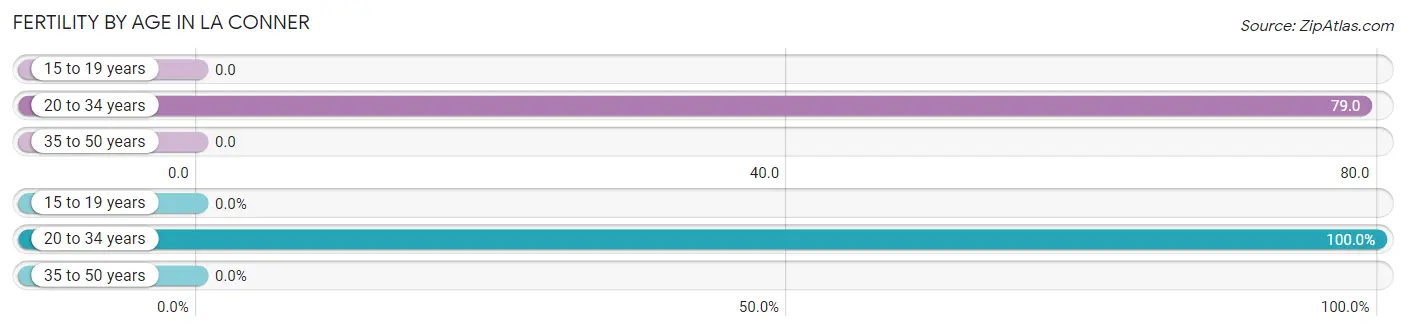
| Age Bracket | Women with Births | Births / 1,000 Women |
| 15 to 19 years | 0 (0.0%) | 0.0 |
| 20 to 34 years | 3 (100.0%) | 79.0 |
| 35 to 50 years | 0 (0.0%) | 0.0 |
| Total | 3 (100.0%) | 23.0 |
Fertility by Age by Marriage Status in La Conner
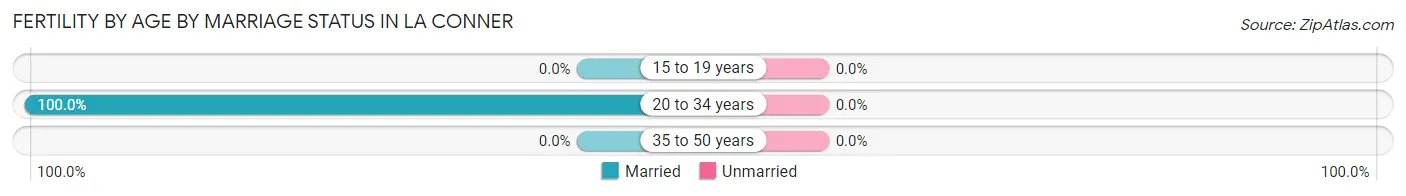
| Age Bracket | Married | Unmarried |
| 15 to 19 years | 0 (0.0%) | 0 (0.0%) |
| 20 to 34 years | 3 (100.0%) | 0 (0.0%) |
| 35 to 50 years | 0 (0.0%) | 0 (0.0%) |
| Total | 3 (100.0%) | 0 (0.0%) |
Fertility by Education in La Conner
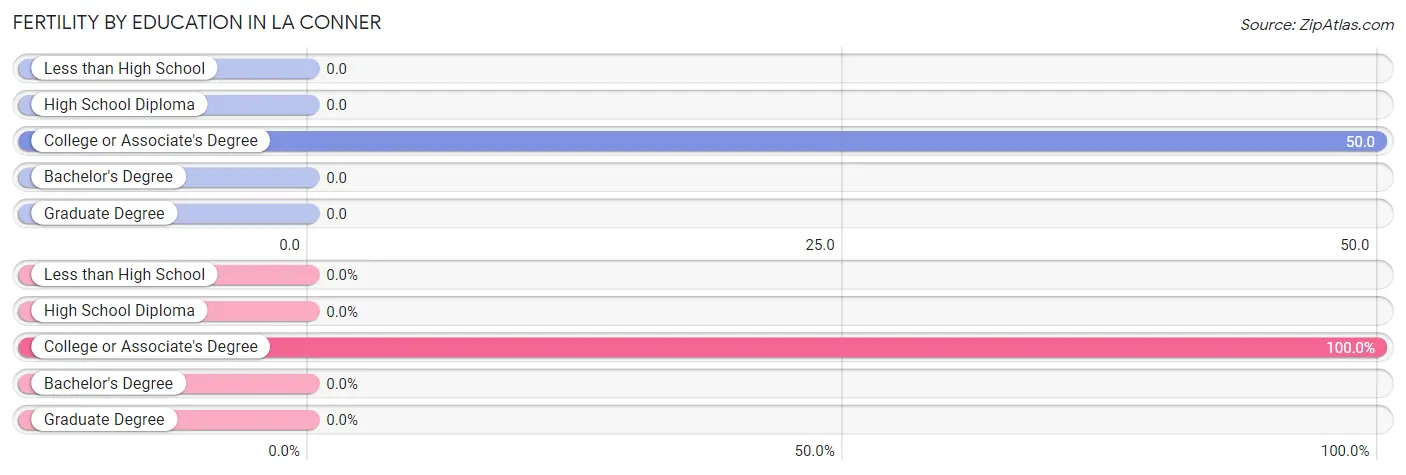
| Educational Attainment | Women with Births | Births / 1,000 Women |
| Less than High School | 0 (0.0%) | 0.0 |
| High School Diploma | 0 (0.0%) | 0.0 |
| College or Associate's Degree | 3 (100.0%) | 50.0 |
| Bachelor's Degree | 0 (0.0%) | 0.0 |
| Graduate Degree | 0 (0.0%) | 0.0 |
| Total | 3 (100.0%) | 23.0 |
Fertility by Education by Marriage Status in La Conner
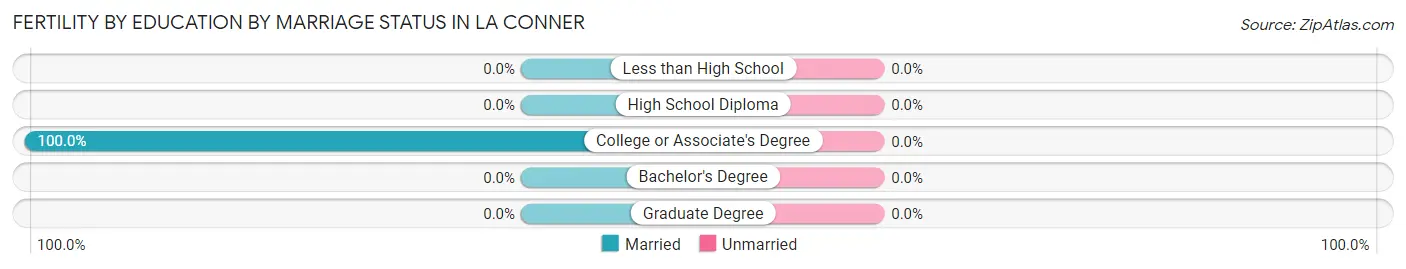
| Educational Attainment | Married | Unmarried |
| Less than High School | 0 (0.0%) | 0 (0.0%) |
| High School Diploma | 0 (0.0%) | 0 (0.0%) |
| College or Associate's Degree | 3 (100.0%) | 0 (0.0%) |
| Bachelor's Degree | 0 (0.0%) | 0 (0.0%) |
| Graduate Degree | 0 (0.0%) | 0 (0.0%) |
| Total | 3 (100.0%) | 0 (0.0%) |
Employment Characteristics in La Conner
Employment by Class of Employer in La Conner
Among the 447 employed individuals in La Conner, private company employees (209 | 46.8%), local government employees (73 | 16.3%), and self-employed (incorporated) (50 | 11.2%) make up the most common classes of employment.
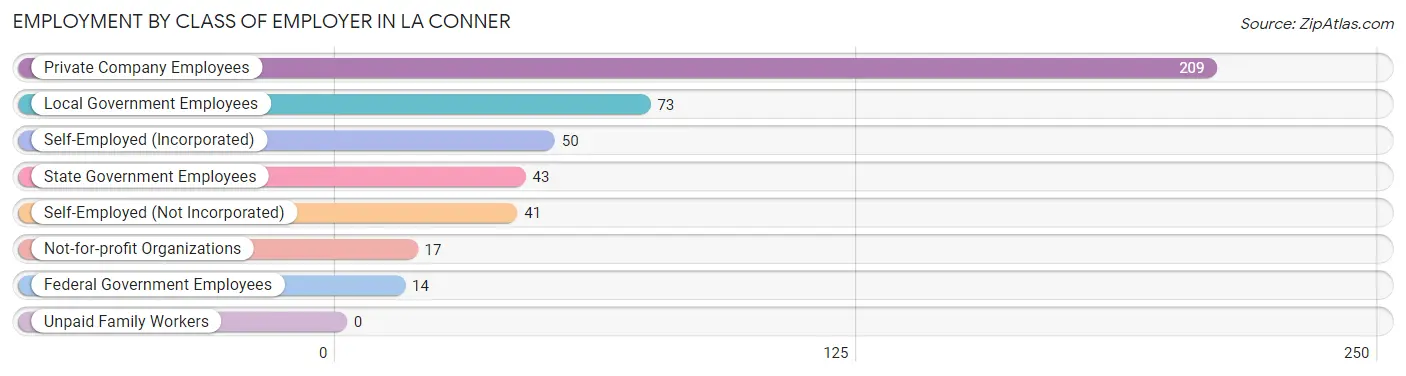
| Employer Class | # Employees | % Employees |
| Private Company Employees | 209 | 46.8% |
| Self-Employed (Incorporated) | 50 | 11.2% |
| Self-Employed (Not Incorporated) | 41 | 9.2% |
| Not-for-profit Organizations | 17 | 3.8% |
| Local Government Employees | 73 | 16.3% |
| State Government Employees | 43 | 9.6% |
| Federal Government Employees | 14 | 3.1% |
| Unpaid Family Workers | 0 | 0.0% |
| Total | 447 | 100.0% |
Employment Status by Age in La Conner
According to the labor force statistics for La Conner, out of the total population over 16 years of age (901), 51.3% or 462 individuals are in the labor force, with 0.4% or 2 of them unemployed. The age group with the highest labor force participation rate is 35 to 44 years, with 97.6% or 80 individuals in the labor force. Within the labor force, the 45 to 54 years age range has the highest percentage of unemployed individuals, with 2.3% or 2 of them being unemployed.
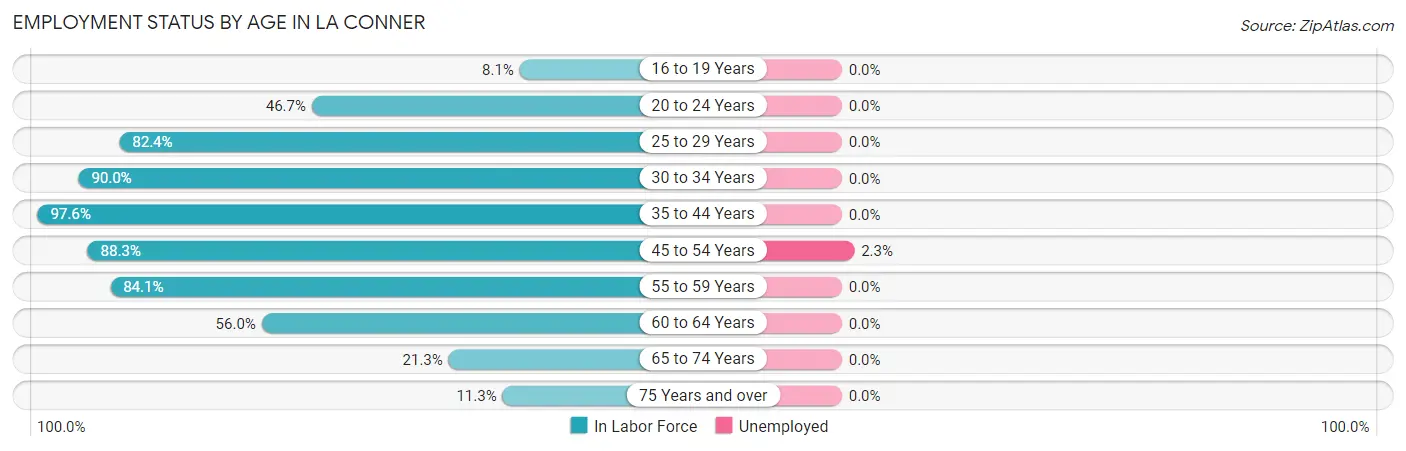
| Age Bracket | In Labor Force | Unemployed |
| 16 to 19 Years | 3 (8.1%) | 0 (0.0%) |
| 20 to 24 Years | 14 (46.7%) | 0 (0.0%) |
| 25 to 29 Years | 14 (82.4%) | 0 (0.0%) |
| 30 to 34 Years | 27 (90.0%) | 0 (0.0%) |
| 35 to 44 Years | 80 (97.6%) | 0 (0.0%) |
| 45 to 54 Years | 91 (88.3%) | 2 (2.3%) |
| 55 to 59 Years | 106 (84.1%) | 0 (0.0%) |
| 60 to 64 Years | 70 (56.0%) | 0 (0.0%) |
| 65 to 74 Years | 37 (21.3%) | 0 (0.0%) |
| 75 Years and over | 20 (11.3%) | 0 (0.0%) |
| Total | 462 (51.3%) | 2 (0.4%) |
Employment Status by Educational Attainment in La Conner
According to labor force statistics for La Conner, 80.3% of individuals (388) out of the total population between 25 and 64 years of age (483) are in the labor force, with 0.5% or 2 of them being unemployed. The group with the highest labor force participation rate are those with the educational attainment of bachelor's degree or higher, with 93.2% or 179 individuals in the labor force. Within the labor force, individuals with college / associate degree education have the highest percentage of unemployment, with 1.5% or 2 of them being unemployed.
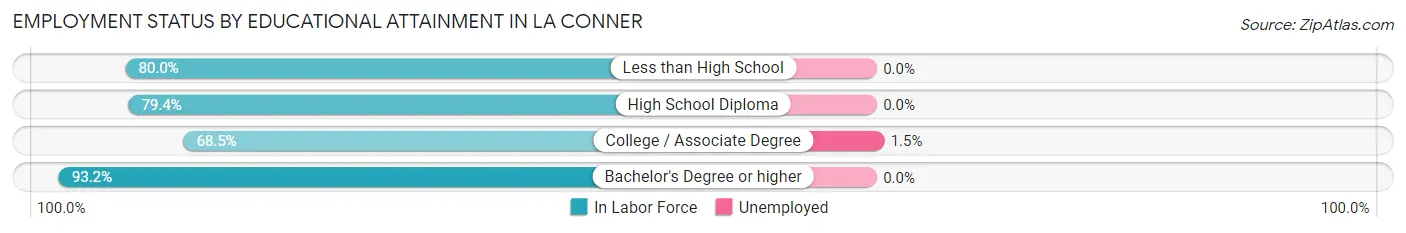
| Educational Attainment | In Labor Force | Unemployed |
| Less than High School | 20 (80.0%) | 0 (0.0%) |
| High School Diploma | 50 (79.4%) | 0 (0.0%) |
| College / Associate Degree | 139 (68.5%) | 3 (1.5%) |
| Bachelor's Degree or higher | 179 (93.2%) | 0 (0.0%) |
| Total | 388 (80.3%) | 2 (0.5%) |
Employment Occupations by Sex in La Conner
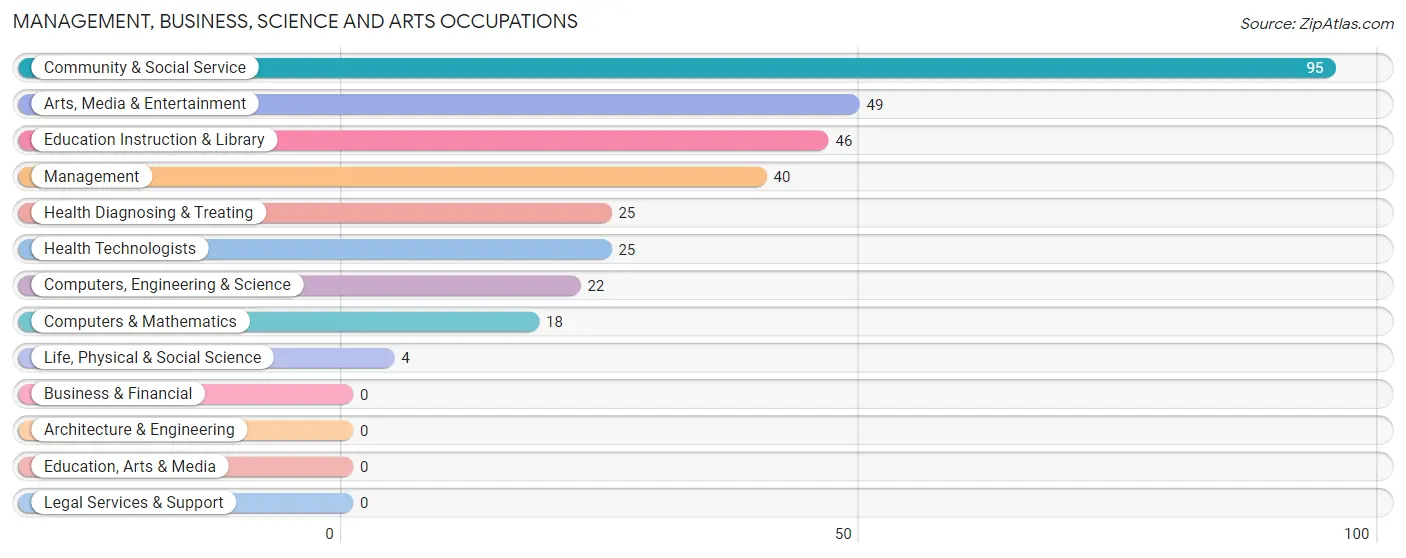
Management, Business, Science and Arts Occupations
The most common Management, Business, Science and Arts occupations in La Conner are Community & Social Service (95 | 21.0%), Arts, Media & Entertainment (49 | 10.8%), Education Instruction & Library (46 | 10.2%), Management (40 | 8.8%), and Health Diagnosing & Treating (25 | 5.5%).
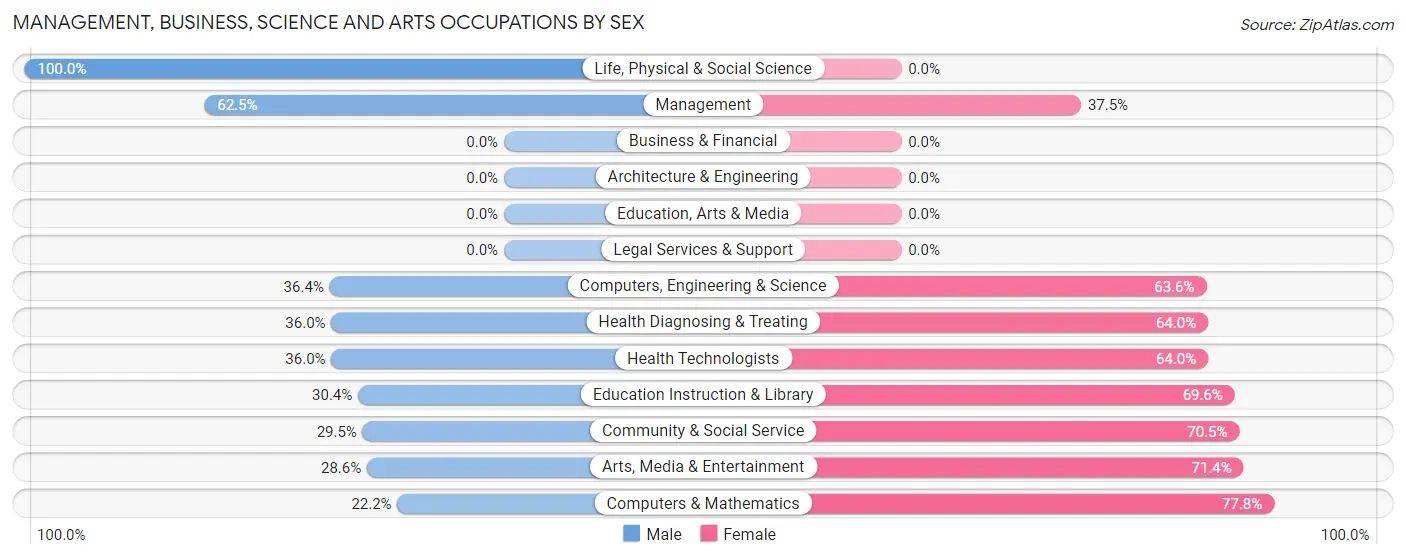
Management, Business, Science and Arts Occupations by Sex
Within the Management, Business, Science and Arts occupations in La Conner, the most male-oriented occupations are Life, Physical & Social Science (100.0%), Management (62.5%), and Computers, Engineering & Science (36.4%), while the most female-oriented occupations are Computers & Mathematics (77.8%), Arts, Media & Entertainment (71.4%), and Community & Social Service (70.5%).
| Occupation | Male | Female |
| Management | 25 (62.5%) | 15 (37.5%) |
| Business & Financial | 0 (0.0%) | 0 (0.0%) |
| Computers, Engineering & Science | 8 (36.4%) | 14 (63.6%) |
| Computers & Mathematics | 4 (22.2%) | 14 (77.8%) |
| Architecture & Engineering | 0 (0.0%) | 0 (0.0%) |
| Life, Physical & Social Science | 4 (100.0%) | 0 (0.0%) |
| Community & Social Service | 28 (29.5%) | 67 (70.5%) |
| Education, Arts & Media | 0 (0.0%) | 0 (0.0%) |
| Legal Services & Support | 0 (0.0%) | 0 (0.0%) |
| Education Instruction & Library | 14 (30.4%) | 32 (69.6%) |
| Arts, Media & Entertainment | 14 (28.6%) | 35 (71.4%) |
| Health Diagnosing & Treating | 9 (36.0%) | 16 (64.0%) |
| Health Technologists | 9 (36.0%) | 16 (64.0%) |
| Total (Category) | 70 (38.5%) | 112 (61.5%) |
| Total (Overall) | 194 (42.9%) | 258 (57.1%) |
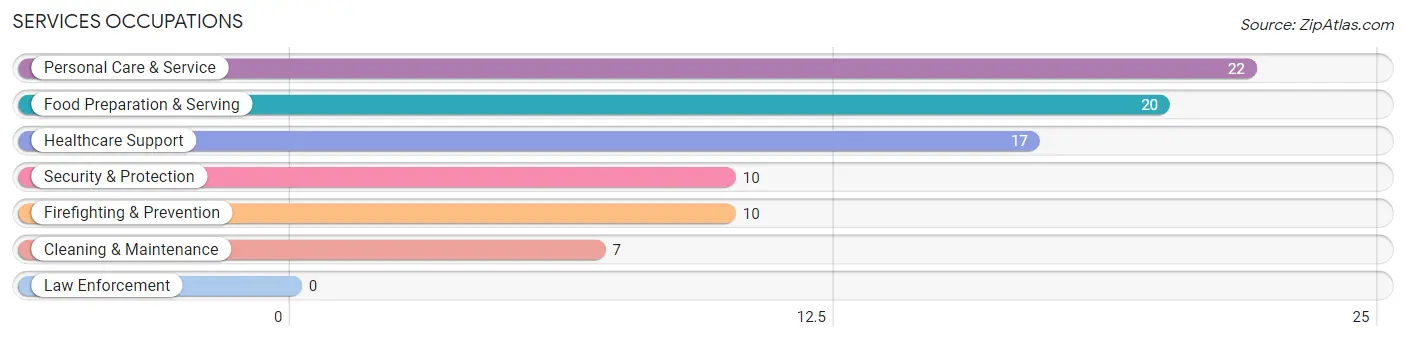
Services Occupations
The most common Services occupations in La Conner are Personal Care & Service (22 | 4.9%), Food Preparation & Serving (20 | 4.4%), Healthcare Support (17 | 3.8%), Security & Protection (10 | 2.2%), and Firefighting & Prevention (10 | 2.2%).
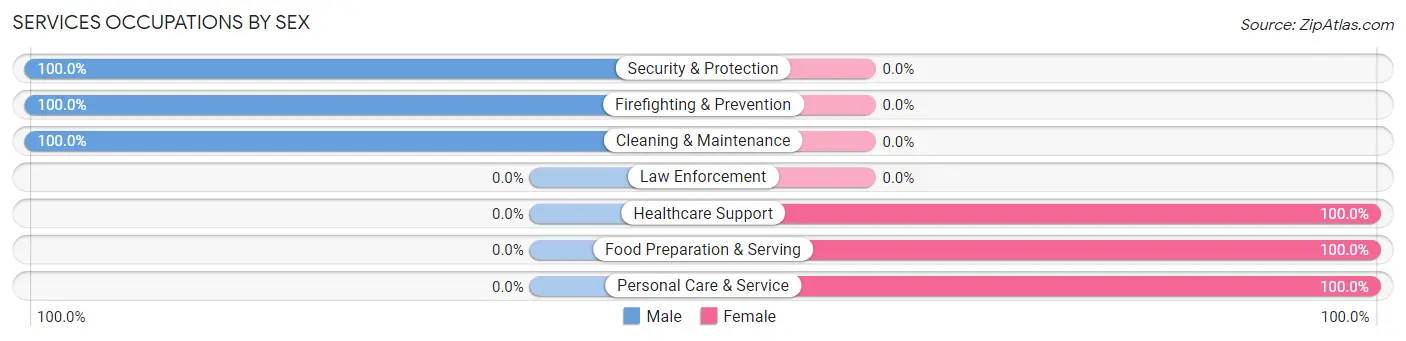
Services Occupations by Sex
Within the Services occupations in La Conner, the most male-oriented occupations are Security & Protection (100.0%), Firefighting & Prevention (100.0%), and Cleaning & Maintenance (100.0%), while the most female-oriented occupations are Healthcare Support (100.0%), Food Preparation & Serving (100.0%), and Personal Care & Service (100.0%).
| Occupation | Male | Female |
| Healthcare Support | 0 (0.0%) | 17 (100.0%) |
| Security & Protection | 10 (100.0%) | 0 (0.0%) |
| Firefighting & Prevention | 10 (100.0%) | 0 (0.0%) |
| Law Enforcement | 0 (0.0%) | 0 (0.0%) |
| Food Preparation & Serving | 0 (0.0%) | 20 (100.0%) |
| Cleaning & Maintenance | 7 (100.0%) | 0 (0.0%) |
| Personal Care & Service | 0 (0.0%) | 22 (100.0%) |
| Total (Category) | 17 (22.4%) | 59 (77.6%) |
| Total (Overall) | 194 (42.9%) | 258 (57.1%) |
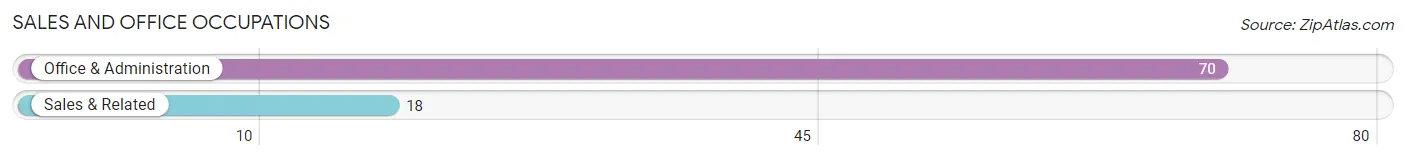
Sales and Office Occupations
The most common Sales and Office occupations in La Conner are Office & Administration (70 | 15.5%), and Sales & Related (18 | 4.0%).
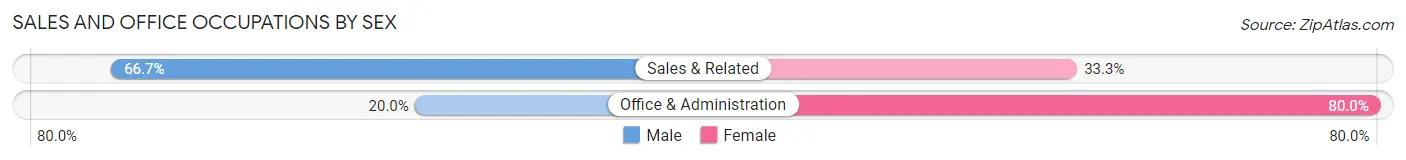
Sales and Office Occupations by Sex
| Occupation | Male | Female |
| Sales & Related | 12 (66.7%) | 6 (33.3%) |
| Office & Administration | 14 (20.0%) | 56 (80.0%) |
| Total (Category) | 26 (29.5%) | 62 (70.5%) |
| Total (Overall) | 194 (42.9%) | 258 (57.1%) |
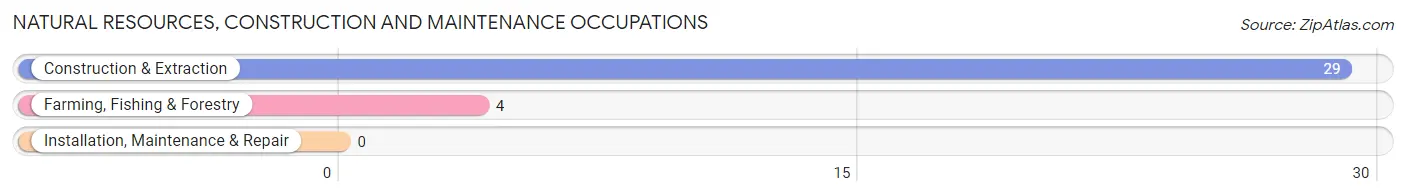
Natural Resources, Construction and Maintenance Occupations
The most common Natural Resources, Construction and Maintenance occupations in La Conner are Construction & Extraction (29 | 6.4%), and Farming, Fishing & Forestry (4 | 0.9%).
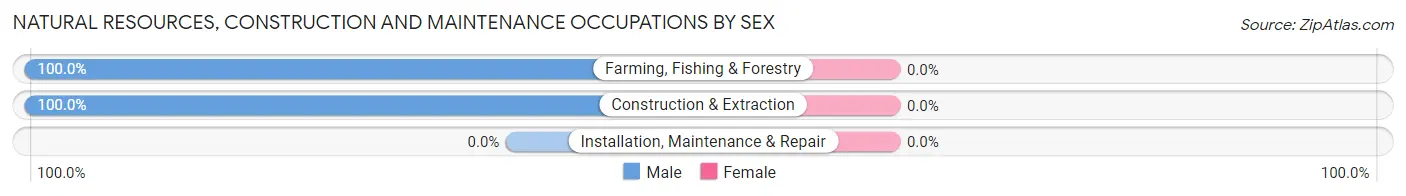
Natural Resources, Construction and Maintenance Occupations by Sex
| Occupation | Male | Female |
| Farming, Fishing & Forestry | 4 (100.0%) | 0 (0.0%) |
| Construction & Extraction | 29 (100.0%) | 0 (0.0%) |
| Installation, Maintenance & Repair | 0 (0.0%) | 0 (0.0%) |
| Total (Category) | 33 (100.0%) | 0 (0.0%) |
| Total (Overall) | 194 (42.9%) | 258 (57.1%) |
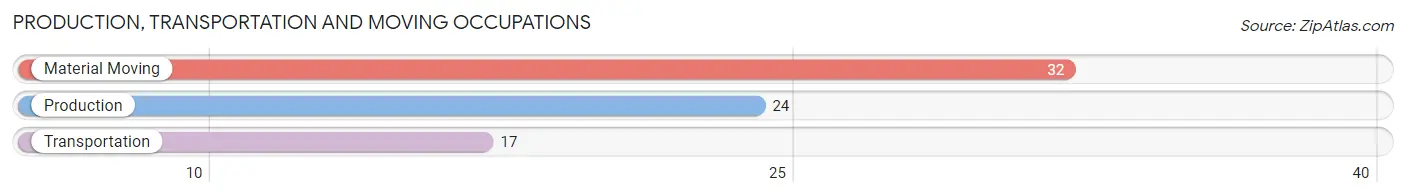
Production, Transportation and Moving Occupations
The most common Production, Transportation and Moving occupations in La Conner are Material Moving (32 | 7.1%), Production (24 | 5.3%), and Transportation (17 | 3.8%).
Production, Transportation and Moving Occupations by Sex
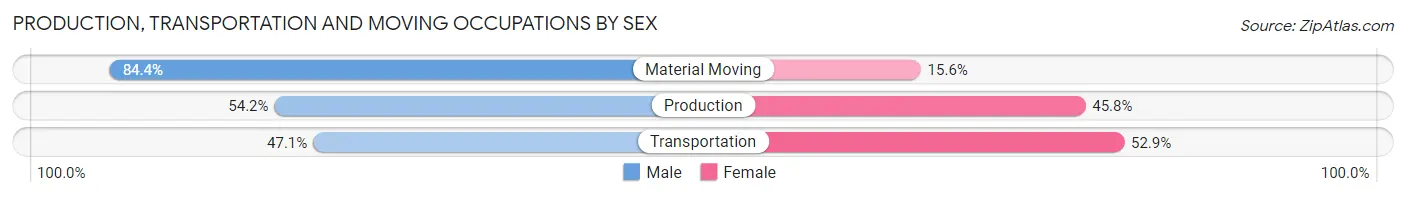
| Occupation | Male | Female |
| Production | 13 (54.2%) | 11 (45.8%) |
| Transportation | 8 (47.1%) | 9 (52.9%) |
| Material Moving | 27 (84.4%) | 5 (15.6%) |
| Total (Category) | 48 (65.7%) | 25 (34.3%) |
| Total (Overall) | 194 (42.9%) | 258 (57.1%) |
Employment Industries by Sex in La Conner
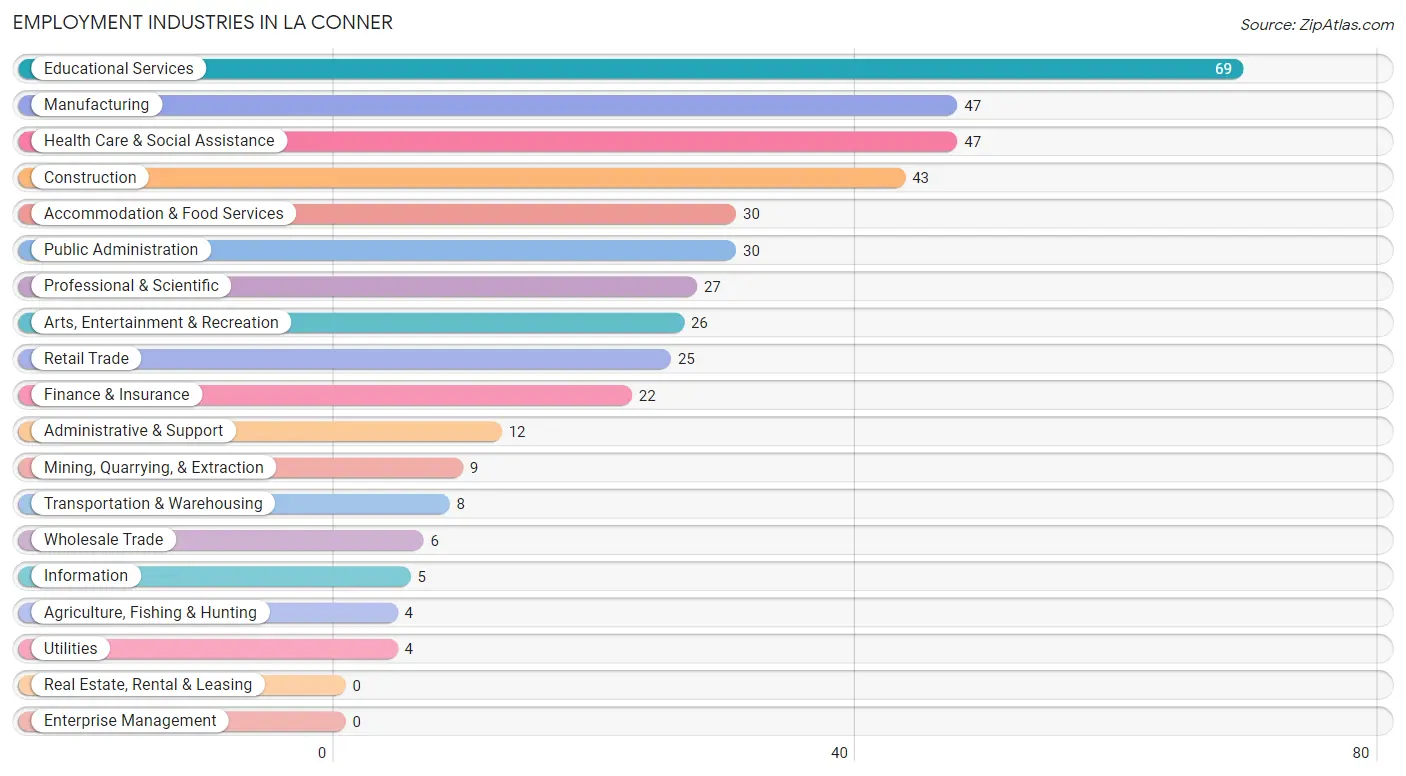
Employment Industries in La Conner
The major employment industries in La Conner include Educational Services (69 | 15.3%), Manufacturing (47 | 10.4%), Health Care & Social Assistance (47 | 10.4%), Construction (43 | 9.5%), and Accommodation & Food Services (30 | 6.6%).
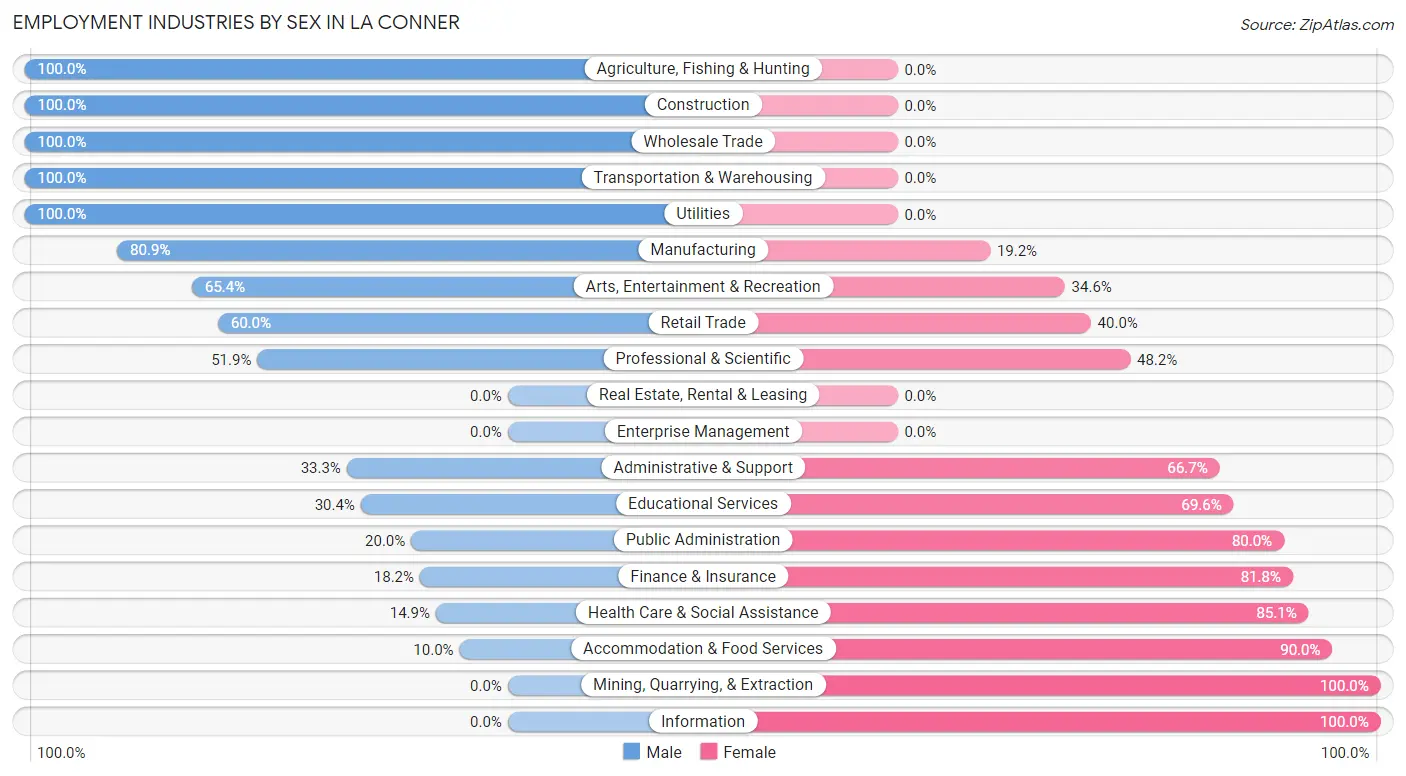
Employment Industries by Sex in La Conner
The La Conner industries that see more men than women are Agriculture, Fishing & Hunting (100.0%), Construction (100.0%), and Wholesale Trade (100.0%), whereas the industries that tend to have a higher number of women are Mining, Quarrying, & Extraction (100.0%), Information (100.0%), and Accommodation & Food Services (90.0%).
| Industry | Male | Female |
| Agriculture, Fishing & Hunting | 4 (100.0%) | 0 (0.0%) |
| Mining, Quarrying, & Extraction | 0 (0.0%) | 9 (100.0%) |
| Construction | 43 (100.0%) | 0 (0.0%) |
| Manufacturing | 38 (80.8%) | 9 (19.2%) |
| Wholesale Trade | 6 (100.0%) | 0 (0.0%) |
| Retail Trade | 15 (60.0%) | 10 (40.0%) |
| Transportation & Warehousing | 8 (100.0%) | 0 (0.0%) |
| Utilities | 4 (100.0%) | 0 (0.0%) |
| Information | 0 (0.0%) | 5 (100.0%) |
| Finance & Insurance | 4 (18.2%) | 18 (81.8%) |
| Real Estate, Rental & Leasing | 0 (0.0%) | 0 (0.0%) |
| Professional & Scientific | 14 (51.8%) | 13 (48.1%) |
| Enterprise Management | 0 (0.0%) | 0 (0.0%) |
| Administrative & Support | 4 (33.3%) | 8 (66.7%) |
| Educational Services | 21 (30.4%) | 48 (69.6%) |
| Health Care & Social Assistance | 7 (14.9%) | 40 (85.1%) |
| Arts, Entertainment & Recreation | 17 (65.4%) | 9 (34.6%) |
| Accommodation & Food Services | 3 (10.0%) | 27 (90.0%) |
| Public Administration | 6 (20.0%) | 24 (80.0%) |
| Total | 194 (42.9%) | 258 (57.1%) |
Education in La Conner
School Enrollment in La Conner
The most common levels of schooling among the 150 students in La Conner are high school (44 | 29.3%), middle school (42 | 28.0%), and college / undergraduate (32 | 21.3%).
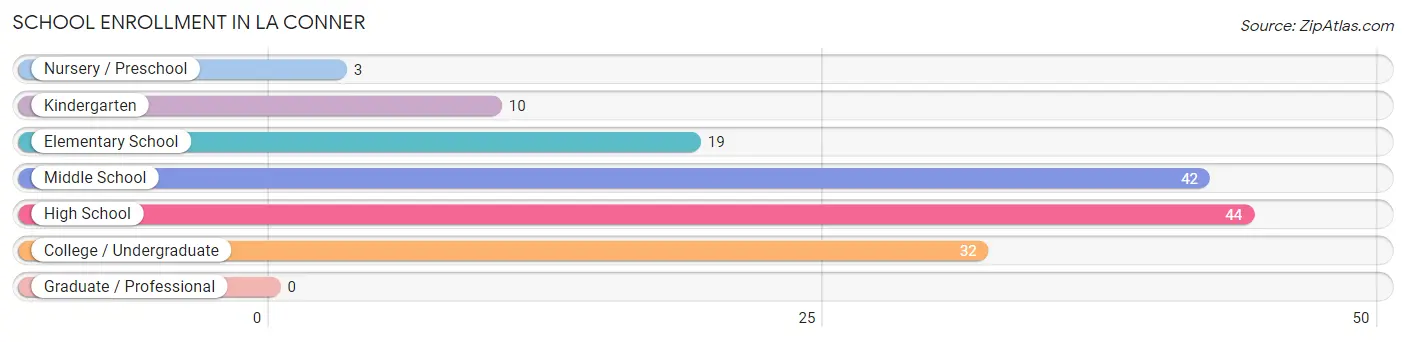
| School Level | # Students | % Students |
| Nursery / Preschool | 3 | 2.0% |
| Kindergarten | 10 | 6.7% |
| Elementary School | 19 | 12.7% |
| Middle School | 42 | 28.0% |
| High School | 44 | 29.3% |
| College / Undergraduate | 32 | 21.3% |
| Graduate / Professional | 0 | 0.0% |
| Total | 150 | 100.0% |
School Enrollment by Age by Funding Source in La Conner
Out of a total of 150 students who are enrolled in schools in La Conner, 6 (4.0%) attend a private institution, while the remaining 144 (96.0%) are enrolled in public schools. The age group of 5 to 9 year old has the highest likelihood of being enrolled in private schools, with 6 (18.8% in the age bracket) enrolled. Conversely, the age group of 10 to 14 year olds has the lowest likelihood of being enrolled in a private school, with 49 (100.0% in the age bracket) attending a public institution.
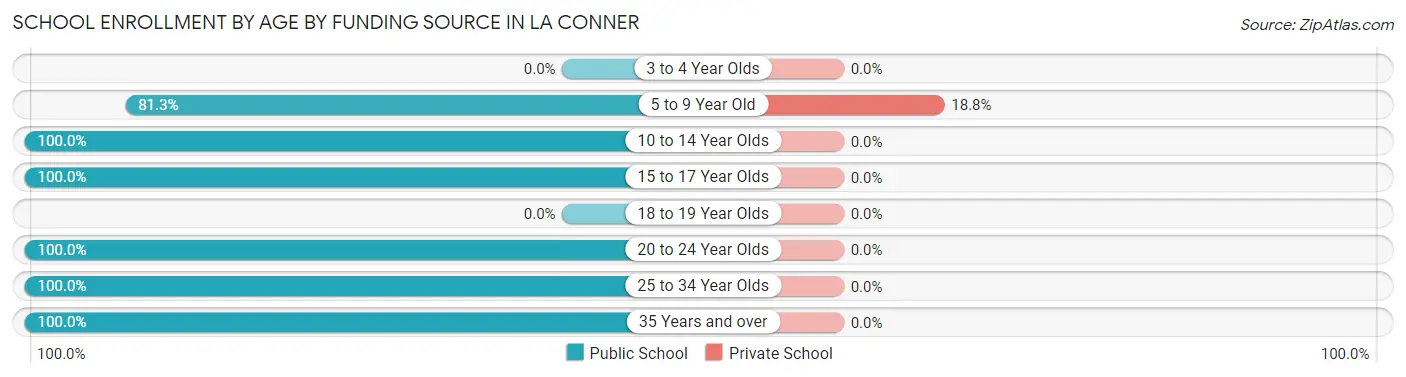
| Age Bracket | Public School | Private School |
| 3 to 4 Year Olds | 0 (0.0%) | 0 (0.0%) |
| 5 to 9 Year Old | 26 (81.2%) | 6 (18.8%) |
| 10 to 14 Year Olds | 49 (100.0%) | 0 (0.0%) |
| 15 to 17 Year Olds | 37 (100.0%) | 0 (0.0%) |
| 18 to 19 Year Olds | 0 (0.0%) | 0 (0.0%) |
| 20 to 24 Year Olds | 14 (100.0%) | 0 (0.0%) |
| 25 to 34 Year Olds | 2 (100.0%) | 0 (0.0%) |
| 35 Years and over | 16 (100.0%) | 0 (0.0%) |
| Total | 144 (96.0%) | 6 (4.0%) |
Educational Attainment by Field of Study in La Conner
Psychology (50 | 13.2%), science & technology (48 | 12.7%), business (47 | 12.4%), literature & languages (45 | 11.9%), and education (42 | 11.1%) are the most common fields of study among 379 individuals in La Conner who have obtained a bachelor's degree or higher.
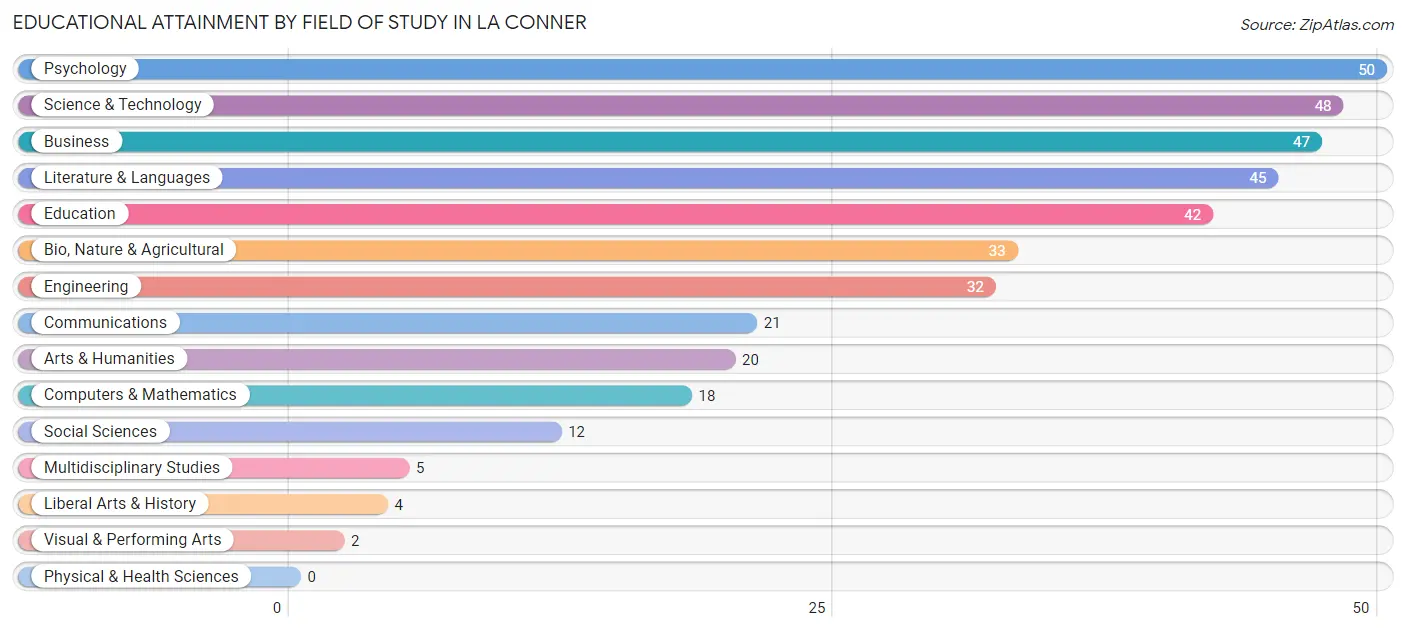
| Field of Study | # Graduates | % Graduates |
| Computers & Mathematics | 18 | 4.8% |
| Bio, Nature & Agricultural | 33 | 8.7% |
| Physical & Health Sciences | 0 | 0.0% |
| Psychology | 50 | 13.2% |
| Social Sciences | 12 | 3.2% |
| Engineering | 32 | 8.4% |
| Multidisciplinary Studies | 5 | 1.3% |
| Science & Technology | 48 | 12.7% |
| Business | 47 | 12.4% |
| Education | 42 | 11.1% |
| Literature & Languages | 45 | 11.9% |
| Liberal Arts & History | 4 | 1.1% |
| Visual & Performing Arts | 2 | 0.5% |
| Communications | 21 | 5.5% |
| Arts & Humanities | 20 | 5.3% |
| Total | 379 | 100.0% |
Transportation & Commute in La Conner
Vehicle Availability by Sex in La Conner
The most prevalent vehicle ownership categories in La Conner are males with 2 vehicles (87, accounting for 44.9%) and females with 2 vehicles (110, making up 34.4%).
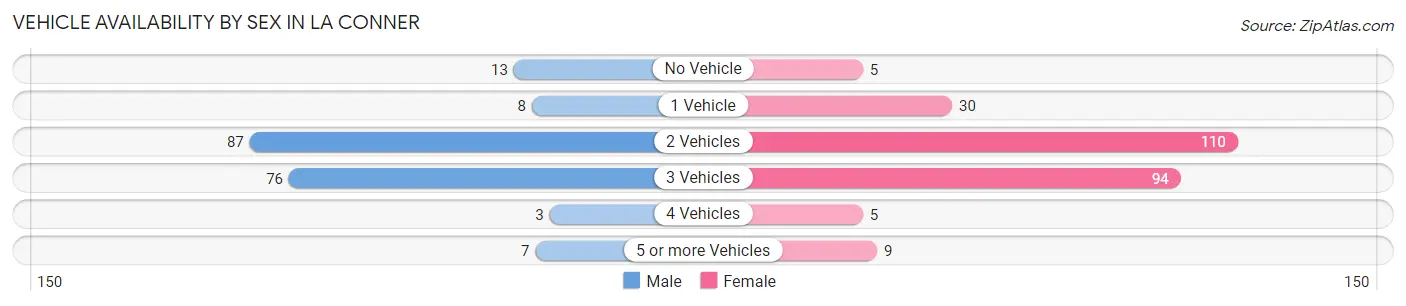
| Vehicles Available | Male | Female |
| No Vehicle | 13 (6.7%) | 5 (2.0%) |
| 1 Vehicle | 8 (4.1%) | 30 (11.9%) |
| 2 Vehicles | 87 (44.9%) | 110 (43.5%) |
| 3 Vehicles | 76 (39.2%) | 94 (37.1%) |
| 4 Vehicles | 3 (1.5%) | 5 (2.0%) |
| 5 or more Vehicles | 7 (3.6%) | 9 (3.6%) |
| Total | 194 (100.0%) | 253 (100.0%) |
Commute Time in La Conner
The most frequently occuring commute durations in La Conner are 10 to 14 minutes (71 commuters, 18.2%), less than 5 minutes (58 commuters, 14.9%), and 60 to 89 minutes (44 commuters, 11.3%).
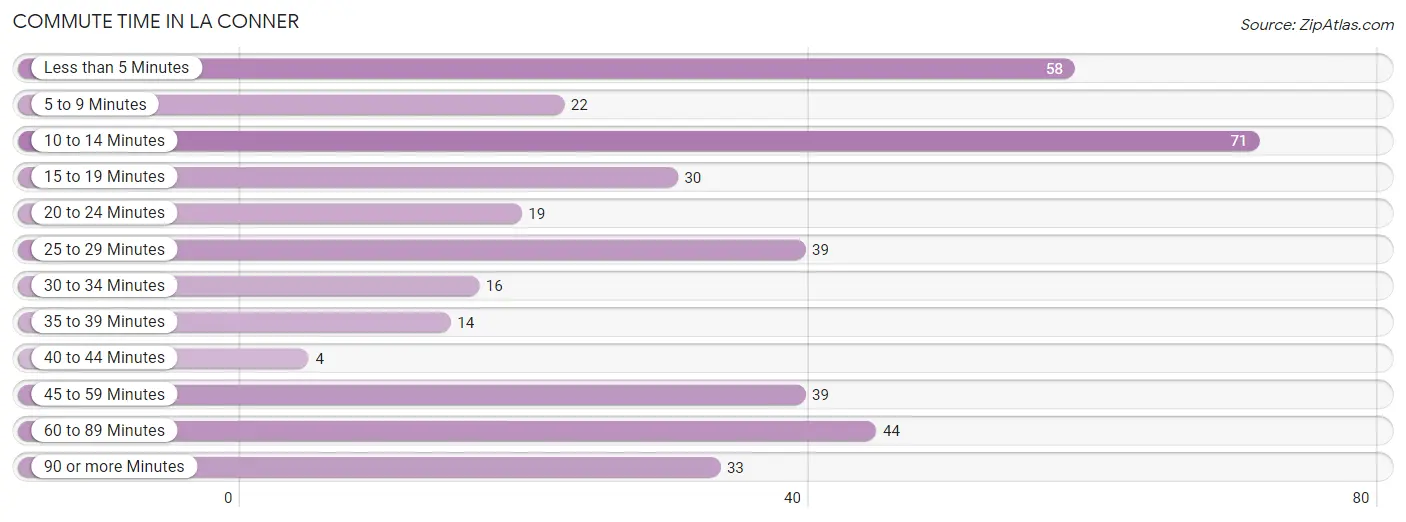
| Commute Time | # Commuters | % Commuters |
| Less than 5 Minutes | 58 | 14.9% |
| 5 to 9 Minutes | 22 | 5.7% |
| 10 to 14 Minutes | 71 | 18.2% |
| 15 to 19 Minutes | 30 | 7.7% |
| 20 to 24 Minutes | 19 | 4.9% |
| 25 to 29 Minutes | 39 | 10.0% |
| 30 to 34 Minutes | 16 | 4.1% |
| 35 to 39 Minutes | 14 | 3.6% |
| 40 to 44 Minutes | 4 | 1.0% |
| 45 to 59 Minutes | 39 | 10.0% |
| 60 to 89 Minutes | 44 | 11.3% |
| 90 or more Minutes | 33 | 8.5% |
Commute Time by Sex in La Conner
The most common commute times in La Conner are 60 to 89 minutes (34 commuters, 19.1%) for males and 10 to 14 minutes (58 commuters, 27.5%) for females.
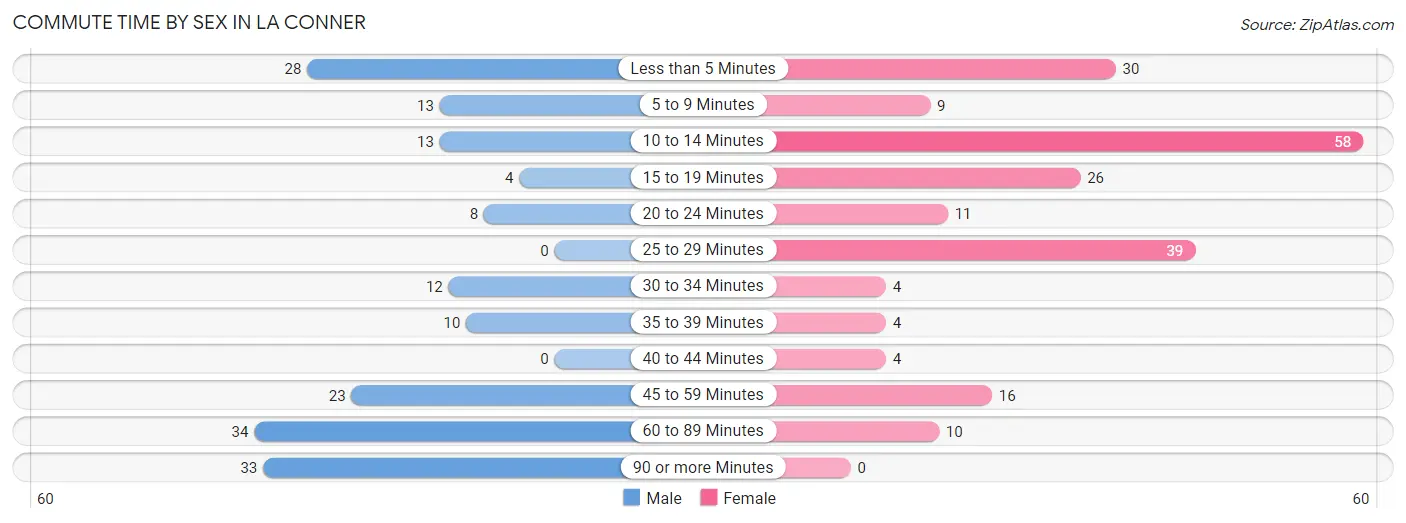
| Commute Time | Male | Female |
| Less than 5 Minutes | 28 (15.7%) | 30 (14.2%) |
| 5 to 9 Minutes | 13 (7.3%) | 9 (4.3%) |
| 10 to 14 Minutes | 13 (7.3%) | 58 (27.5%) |
| 15 to 19 Minutes | 4 (2.2%) | 26 (12.3%) |
| 20 to 24 Minutes | 8 (4.5%) | 11 (5.2%) |
| 25 to 29 Minutes | 0 (0.0%) | 39 (18.5%) |
| 30 to 34 Minutes | 12 (6.7%) | 4 (1.9%) |
| 35 to 39 Minutes | 10 (5.6%) | 4 (1.9%) |
| 40 to 44 Minutes | 0 (0.0%) | 4 (1.9%) |
| 45 to 59 Minutes | 23 (12.9%) | 16 (7.6%) |
| 60 to 89 Minutes | 34 (19.1%) | 10 (4.7%) |
| 90 or more Minutes | 33 (18.5%) | 0 (0.0%) |
Time of Departure to Work by Sex in La Conner
The most frequent times of departure to work in La Conner are 5:00 AM to 5:29 AM (33, 18.5%) for males and 6:30 AM to 6:59 AM (53, 25.1%) for females.
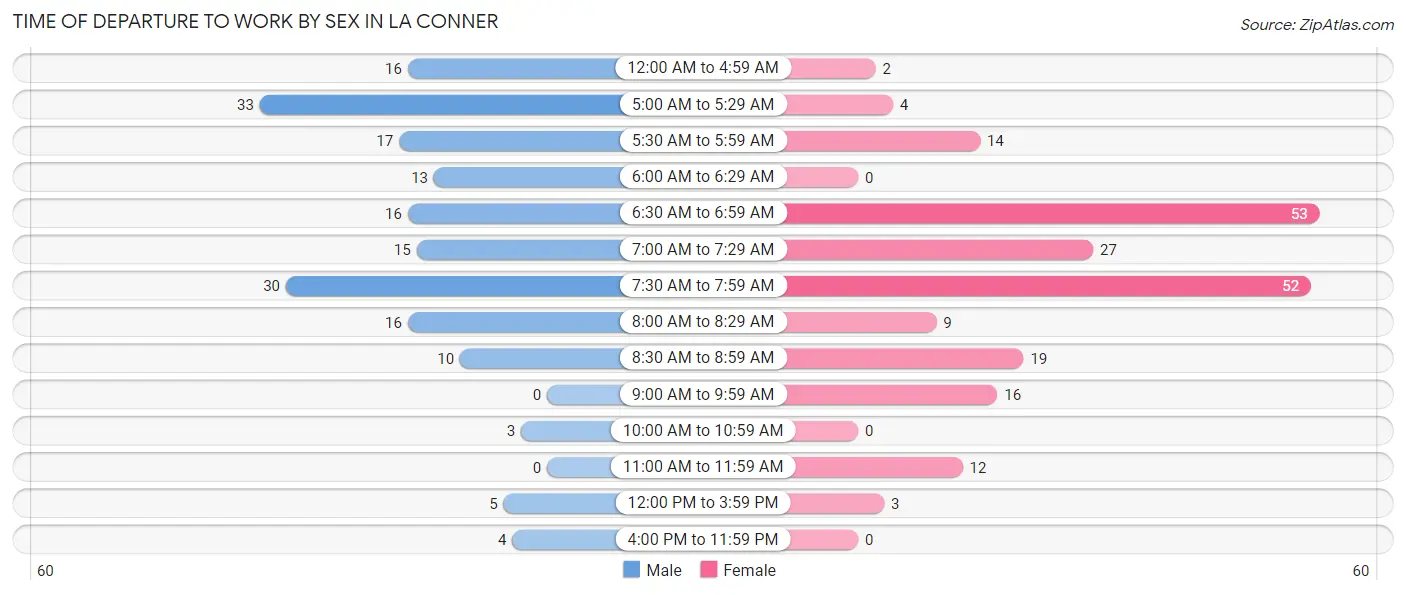
| Time of Departure | Male | Female |
| 12:00 AM to 4:59 AM | 16 (9.0%) | 2 (0.9%) |
| 5:00 AM to 5:29 AM | 33 (18.5%) | 4 (1.9%) |
| 5:30 AM to 5:59 AM | 17 (9.6%) | 14 (6.6%) |
| 6:00 AM to 6:29 AM | 13 (7.3%) | 0 (0.0%) |
| 6:30 AM to 6:59 AM | 16 (9.0%) | 53 (25.1%) |
| 7:00 AM to 7:29 AM | 15 (8.4%) | 27 (12.8%) |
| 7:30 AM to 7:59 AM | 30 (16.9%) | 52 (24.6%) |
| 8:00 AM to 8:29 AM | 16 (9.0%) | 9 (4.3%) |
| 8:30 AM to 8:59 AM | 10 (5.6%) | 19 (9.0%) |
| 9:00 AM to 9:59 AM | 0 (0.0%) | 16 (7.6%) |
| 10:00 AM to 10:59 AM | 3 (1.7%) | 0 (0.0%) |
| 11:00 AM to 11:59 AM | 0 (0.0%) | 12 (5.7%) |
| 12:00 PM to 3:59 PM | 5 (2.8%) | 3 (1.4%) |
| 4:00 PM to 11:59 PM | 4 (2.2%) | 0 (0.0%) |
| Total | 178 (100.0%) | 211 (100.0%) |
Housing Occupancy in La Conner
Occupancy by Ownership in La Conner
Of the total 489 dwellings in La Conner, owner-occupied units account for 298 (60.9%), while renter-occupied units make up 191 (39.1%).
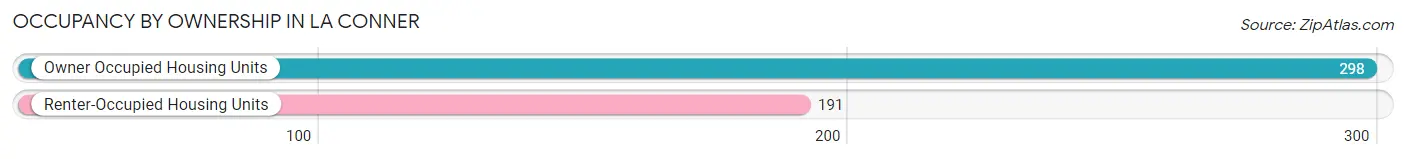
| Occupancy | # Housing Units | % Housing Units |
| Owner Occupied Housing Units | 298 | 60.9% |
| Renter-Occupied Housing Units | 191 | 39.1% |
| Total Occupied Housing Units | 489 | 100.0% |
Occupancy by Household Size in La Conner
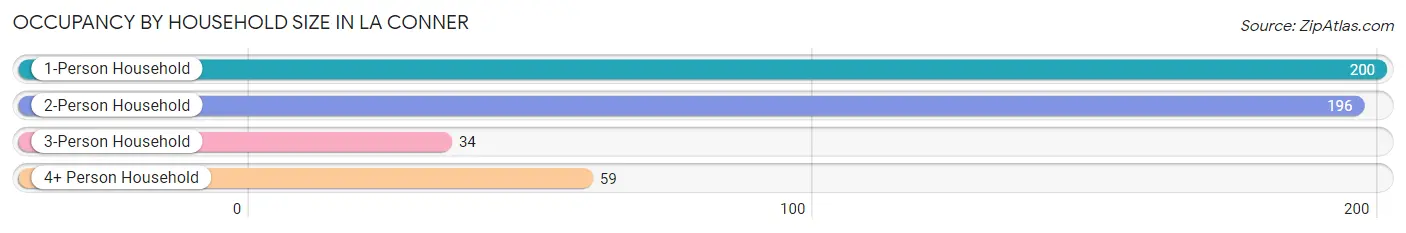
| Household Size | # Housing Units | % Housing Units |
| 1-Person Household | 200 | 40.9% |
| 2-Person Household | 196 | 40.1% |
| 3-Person Household | 34 | 7.0% |
| 4+ Person Household | 59 | 12.1% |
| Total Housing Units | 489 | 100.0% |
Occupancy by Ownership by Household Size in La Conner
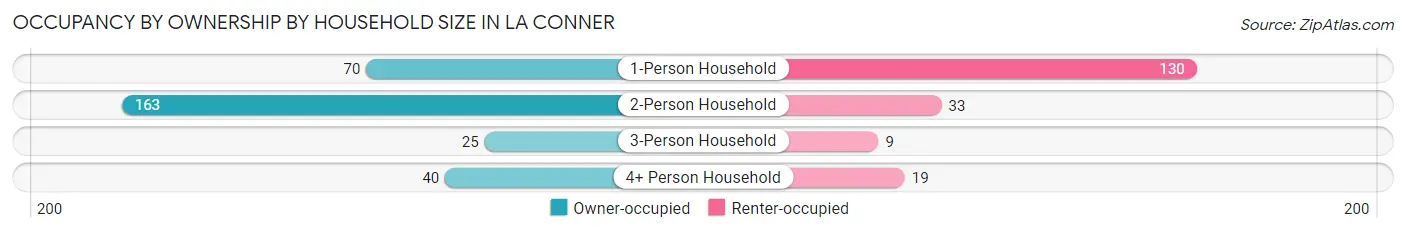
| Household Size | Owner-occupied | Renter-occupied |
| 1-Person Household | 70 (35.0%) | 130 (65.0%) |
| 2-Person Household | 163 (83.2%) | 33 (16.8%) |
| 3-Person Household | 25 (73.5%) | 9 (26.5%) |
| 4+ Person Household | 40 (67.8%) | 19 (32.2%) |
| Total Housing Units | 298 (60.9%) | 191 (39.1%) |
Occupancy by Educational Attainment in La Conner
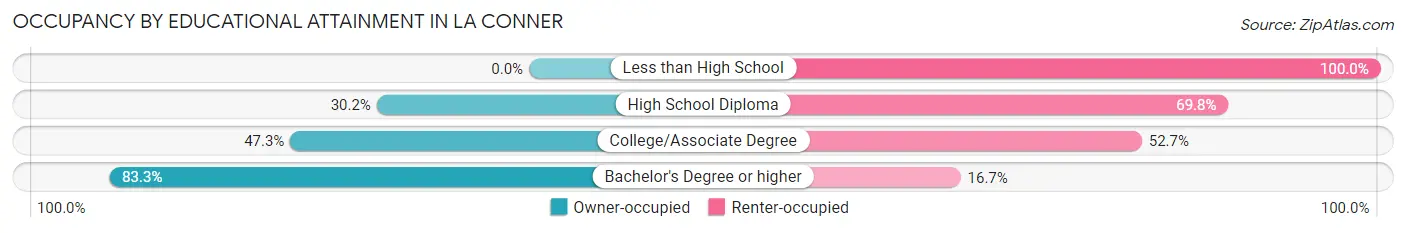
| Household Size | Owner-occupied | Renter-occupied |
| Less than High School | 0 (0.0%) | 8 (100.0%) |
| High School Diploma | 16 (30.2%) | 37 (69.8%) |
| College/Associate Degree | 98 (47.3%) | 109 (52.7%) |
| Bachelor's Degree or higher | 184 (83.3%) | 37 (16.7%) |
Occupancy by Age of Householder in La Conner
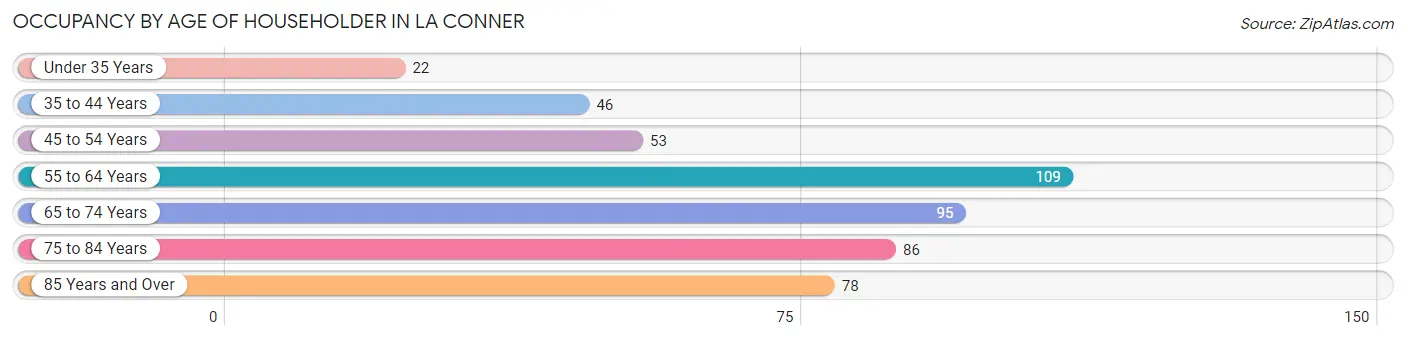
| Age Bracket | # Households | % Households |
| Under 35 Years | 22 | 4.5% |
| 35 to 44 Years | 46 | 9.4% |
| 45 to 54 Years | 53 | 10.8% |
| 55 to 64 Years | 109 | 22.3% |
| 65 to 74 Years | 95 | 19.4% |
| 75 to 84 Years | 86 | 17.6% |
| 85 Years and Over | 78 | 16.0% |
| Total | 489 | 100.0% |
Housing Finances in La Conner
Median Income by Occupancy in La Conner
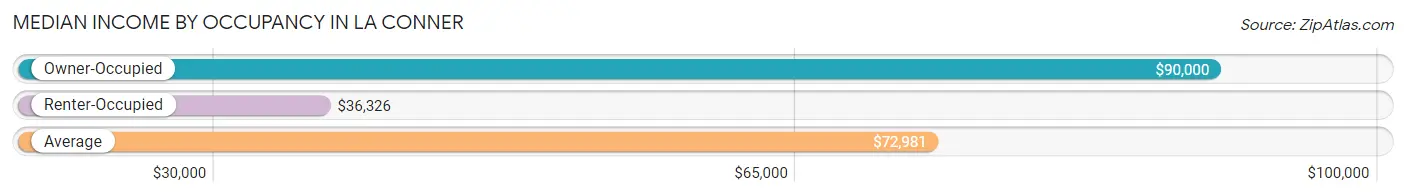
| Occupancy Type | # Households | Median Income |
| Owner-Occupied | 298 (60.9%) | $90,000 |
| Renter-Occupied | 191 (39.1%) | $36,326 |
| Average | 489 (100.0%) | $72,981 |
Occupancy by Householder Income Bracket in La Conner
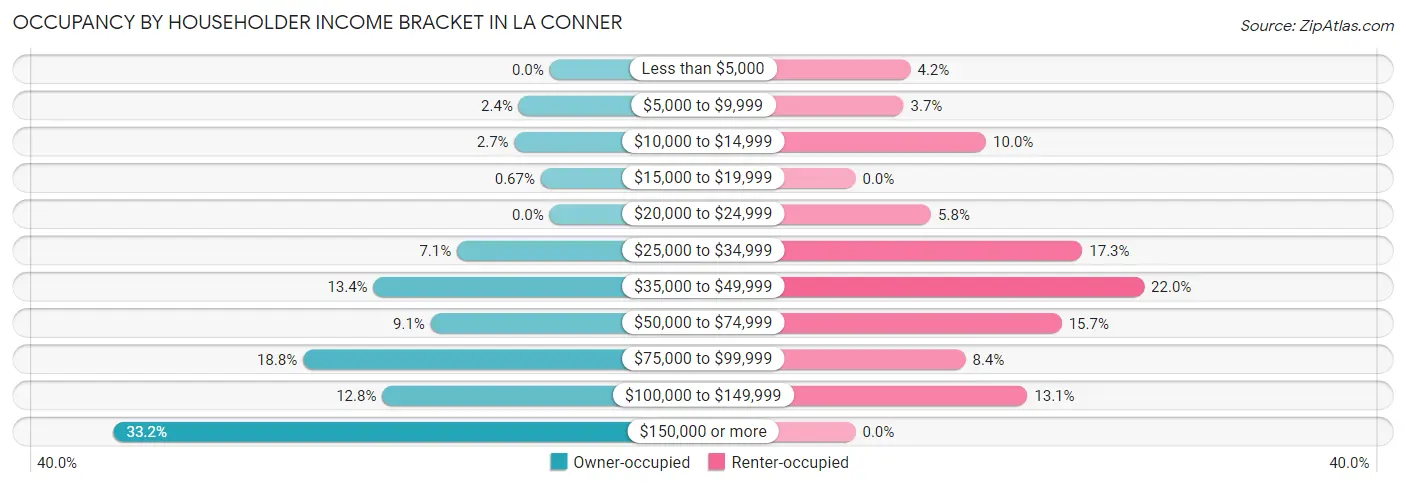
| Income Bracket | Owner-occupied | Renter-occupied |
| Less than $5,000 | 0 (0.0%) | 8 (4.2%) |
| $5,000 to $9,999 | 7 (2.4%) | 7 (3.7%) |
| $10,000 to $14,999 | 8 (2.7%) | 19 (10.0%) |
| $15,000 to $19,999 | 2 (0.7%) | 0 (0.0%) |
| $20,000 to $24,999 | 0 (0.0%) | 11 (5.8%) |
| $25,000 to $34,999 | 21 (7.0%) | 33 (17.3%) |
| $35,000 to $49,999 | 40 (13.4%) | 42 (22.0%) |
| $50,000 to $74,999 | 27 (9.1%) | 30 (15.7%) |
| $75,000 to $99,999 | 56 (18.8%) | 16 (8.4%) |
| $100,000 to $149,999 | 38 (12.8%) | 25 (13.1%) |
| $150,000 or more | 99 (33.2%) | 0 (0.0%) |
| Total | 298 (100.0%) | 191 (100.0%) |
Monthly Housing Cost Tiers in La Conner
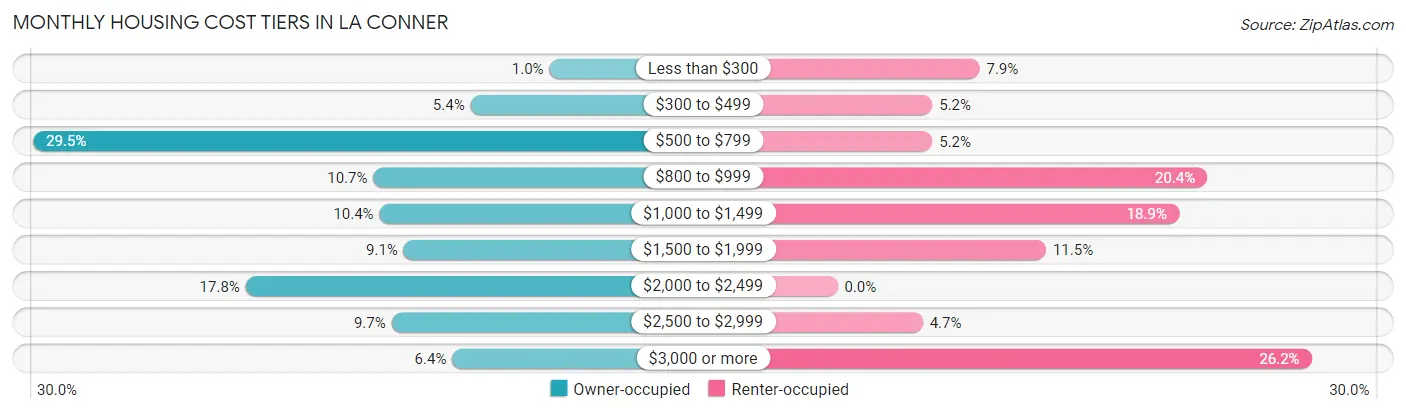
| Monthly Cost | Owner-occupied | Renter-occupied |
| Less than $300 | 3 (1.0%) | 15 (7.9%) |
| $300 to $499 | 16 (5.4%) | 10 (5.2%) |
| $500 to $799 | 88 (29.5%) | 10 (5.2%) |
| $800 to $999 | 32 (10.7%) | 39 (20.4%) |
| $1,000 to $1,499 | 31 (10.4%) | 36 (18.9%) |
| $1,500 to $1,999 | 27 (9.1%) | 22 (11.5%) |
| $2,000 to $2,499 | 53 (17.8%) | 0 (0.0%) |
| $2,500 to $2,999 | 29 (9.7%) | 9 (4.7%) |
| $3,000 or more | 19 (6.4%) | 50 (26.2%) |
| Total | 298 (100.0%) | 191 (100.0%) |
Physical Housing Characteristics in La Conner
Housing Structures in La Conner
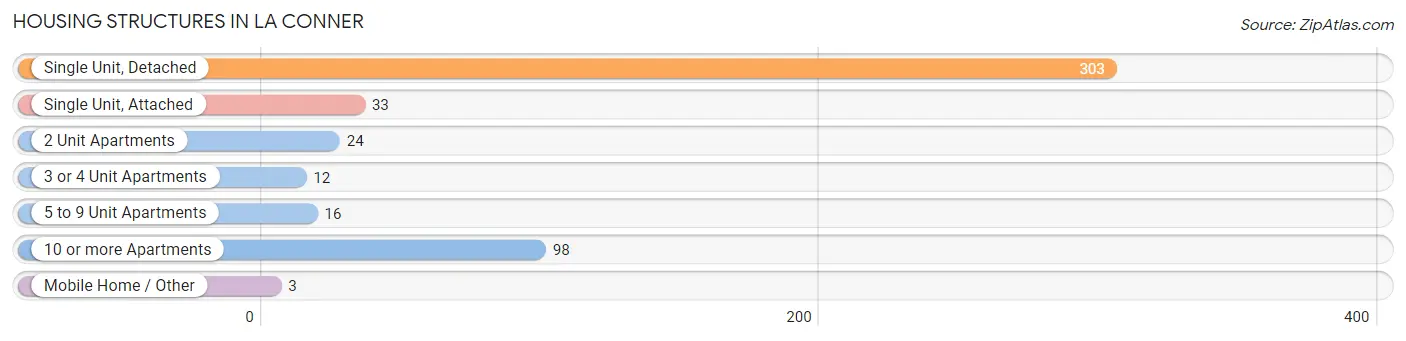
| Structure Type | # Housing Units | % Housing Units |
| Single Unit, Detached | 303 | 62.0% |
| Single Unit, Attached | 33 | 6.8% |
| 2 Unit Apartments | 24 | 4.9% |
| 3 or 4 Unit Apartments | 12 | 2.5% |
| 5 to 9 Unit Apartments | 16 | 3.3% |
| 10 or more Apartments | 98 | 20.0% |
| Mobile Home / Other | 3 | 0.6% |
| Total | 489 | 100.0% |
Housing Structures by Occupancy in La Conner
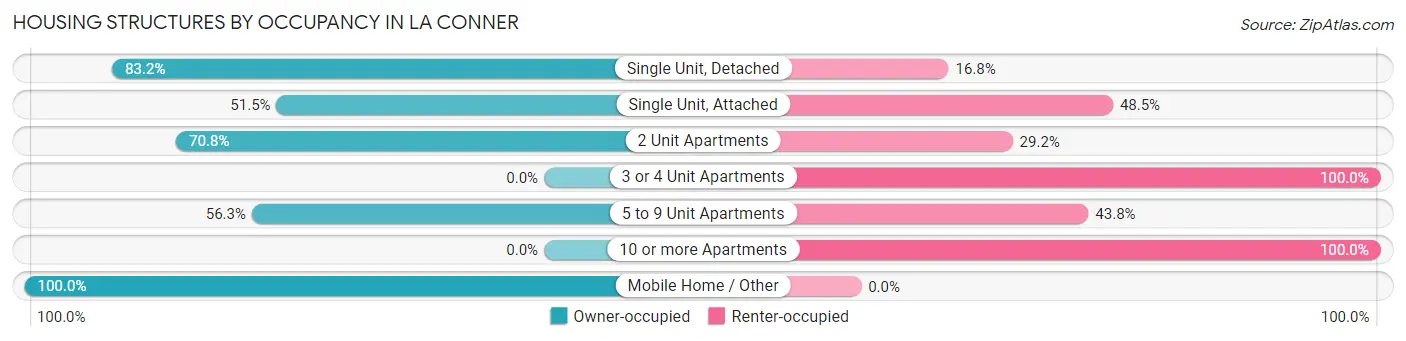
| Structure Type | Owner-occupied | Renter-occupied |
| Single Unit, Detached | 252 (83.2%) | 51 (16.8%) |
| Single Unit, Attached | 17 (51.5%) | 16 (48.5%) |
| 2 Unit Apartments | 17 (70.8%) | 7 (29.2%) |
| 3 or 4 Unit Apartments | 0 (0.0%) | 12 (100.0%) |
| 5 to 9 Unit Apartments | 9 (56.2%) | 7 (43.8%) |
| 10 or more Apartments | 0 (0.0%) | 98 (100.0%) |
| Mobile Home / Other | 3 (100.0%) | 0 (0.0%) |
| Total | 298 (60.9%) | 191 (39.1%) |
Housing Structures by Number of Rooms in La Conner
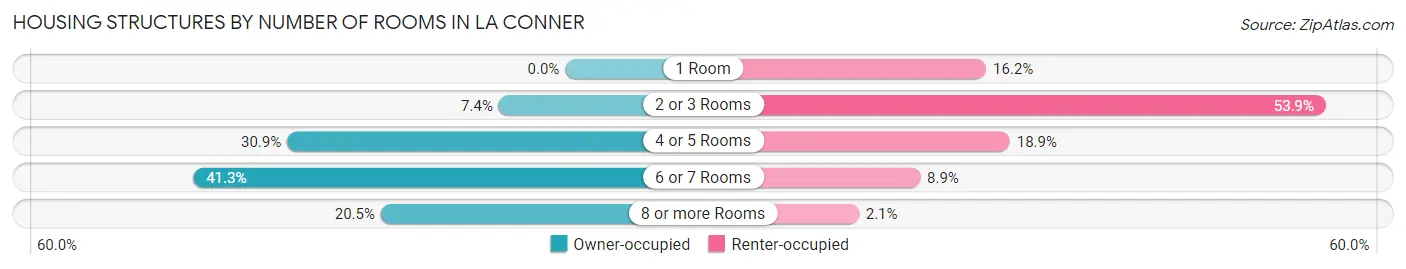
| Number of Rooms | Owner-occupied | Renter-occupied |
| 1 Room | 0 (0.0%) | 31 (16.2%) |
| 2 or 3 Rooms | 22 (7.4%) | 103 (53.9%) |
| 4 or 5 Rooms | 92 (30.9%) | 36 (18.9%) |
| 6 or 7 Rooms | 123 (41.3%) | 17 (8.9%) |
| 8 or more Rooms | 61 (20.5%) | 4 (2.1%) |
| Total | 298 (100.0%) | 191 (100.0%) |
Housing Structure by Heating Type in La Conner
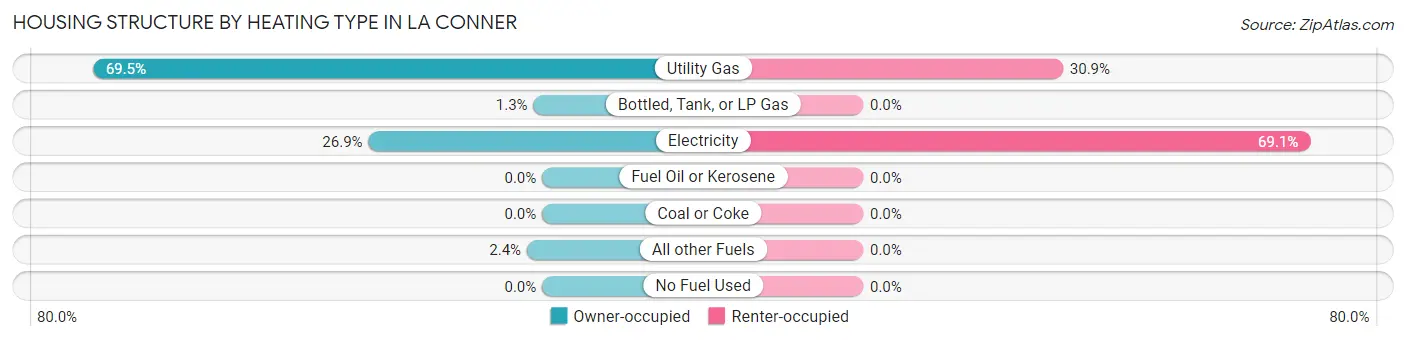
| Heating Type | Owner-occupied | Renter-occupied |
| Utility Gas | 207 (69.5%) | 59 (30.9%) |
| Bottled, Tank, or LP Gas | 4 (1.3%) | 0 (0.0%) |
| Electricity | 80 (26.9%) | 132 (69.1%) |
| Fuel Oil or Kerosene | 0 (0.0%) | 0 (0.0%) |
| Coal or Coke | 0 (0.0%) | 0 (0.0%) |
| All other Fuels | 7 (2.4%) | 0 (0.0%) |
| No Fuel Used | 0 (0.0%) | 0 (0.0%) |
| Total | 298 (100.0%) | 191 (100.0%) |
Household Vehicle Usage in La Conner
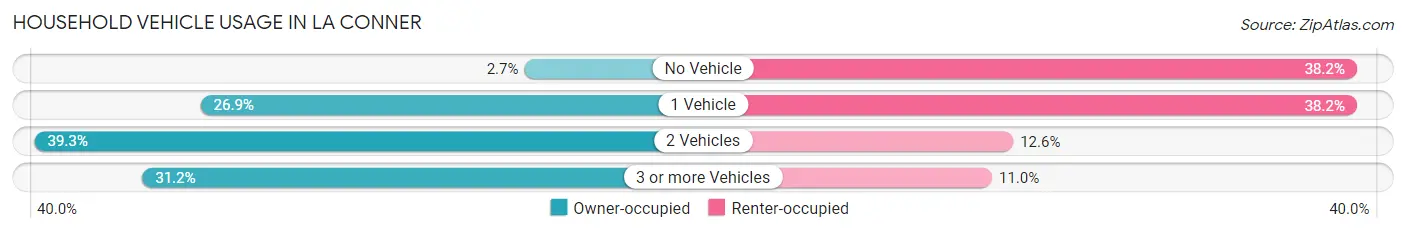
| Vehicles per Household | Owner-occupied | Renter-occupied |
| No Vehicle | 8 (2.7%) | 73 (38.2%) |
| 1 Vehicle | 80 (26.9%) | 73 (38.2%) |
| 2 Vehicles | 117 (39.3%) | 24 (12.6%) |
| 3 or more Vehicles | 93 (31.2%) | 21 (11.0%) |
| Total | 298 (100.0%) | 191 (100.0%) |
Real Estate & Mortgages in La Conner
Real Estate and Mortgage Overview in La Conner
| Characteristic | Without Mortgage | With Mortgage |
| Housing Units | 136 | 162 |
| Median Property Value | $364,300 | $471,900 |
| Median Household Income | $77,159 | $60 |
| Monthly Housing Costs | $713 | $19 |
| Real Estate Taxes | $3,756 | $0 |
Property Value by Mortgage Status in La Conner
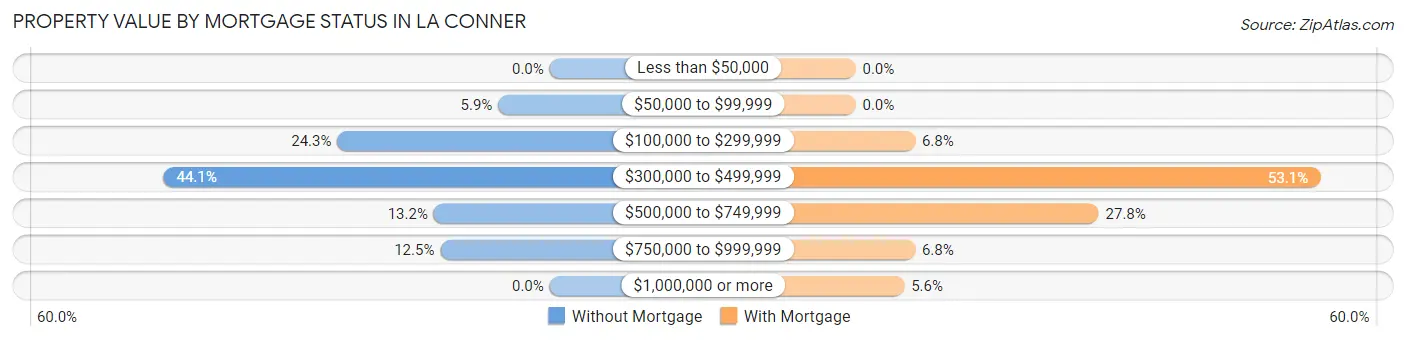
| Property Value | Without Mortgage | With Mortgage |
| Less than $50,000 | 0 (0.0%) | 0 (0.0%) |
| $50,000 to $99,999 | 8 (5.9%) | 0 (0.0%) |
| $100,000 to $299,999 | 33 (24.3%) | 11 (6.8%) |
| $300,000 to $499,999 | 60 (44.1%) | 86 (53.1%) |
| $500,000 to $749,999 | 18 (13.2%) | 45 (27.8%) |
| $750,000 to $999,999 | 17 (12.5%) | 11 (6.8%) |
| $1,000,000 or more | 0 (0.0%) | 9 (5.6%) |
| Total | 136 (100.0%) | 162 (100.0%) |
Household Income by Mortgage Status in La Conner
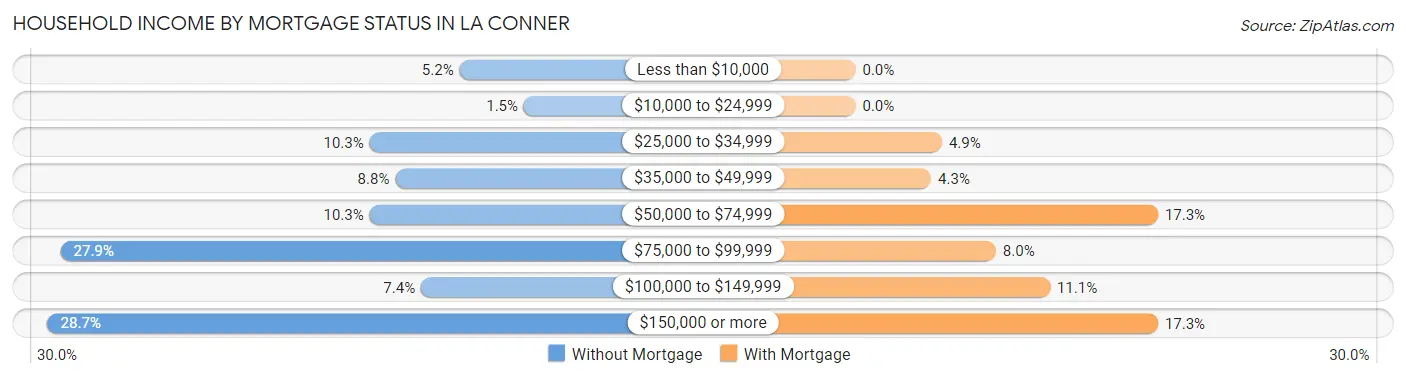
| Household Income | Without Mortgage | With Mortgage |
| Less than $10,000 | 7 (5.1%) | 0 (0.0%) |
| $10,000 to $24,999 | 2 (1.5%) | 0 (0.0%) |
| $25,000 to $34,999 | 14 (10.3%) | 8 (4.9%) |
| $35,000 to $49,999 | 12 (8.8%) | 7 (4.3%) |
| $50,000 to $74,999 | 14 (10.3%) | 28 (17.3%) |
| $75,000 to $99,999 | 38 (27.9%) | 13 (8.0%) |
| $100,000 to $149,999 | 10 (7.3%) | 18 (11.1%) |
| $150,000 or more | 39 (28.7%) | 28 (17.3%) |
| Total | 136 (100.0%) | 162 (100.0%) |
Property Value to Household Income Ratio in La Conner
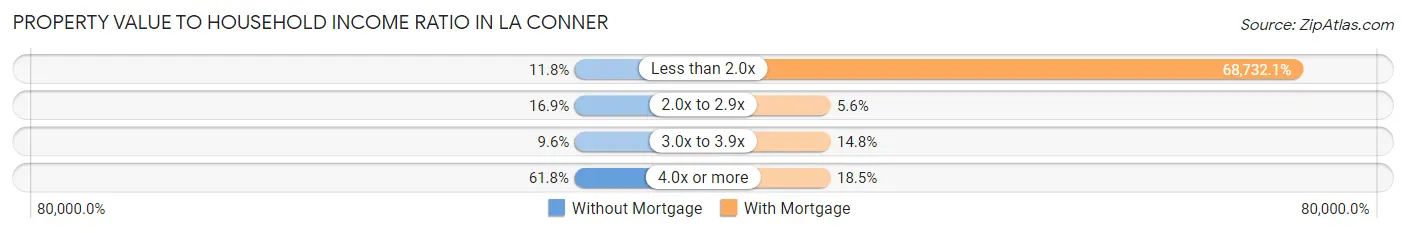
| Value-to-Income Ratio | Without Mortgage | With Mortgage |
| Less than 2.0x | 16 (11.8%) | 111,346 (68,732.1%) |
| 2.0x to 2.9x | 23 (16.9%) | 9 (5.6%) |
| 3.0x to 3.9x | 13 (9.6%) | 24 (14.8%) |
| 4.0x or more | 84 (61.8%) | 30 (18.5%) |
| Total | 136 (100.0%) | 162 (100.0%) |
Real Estate Taxes by Mortgage Status in La Conner
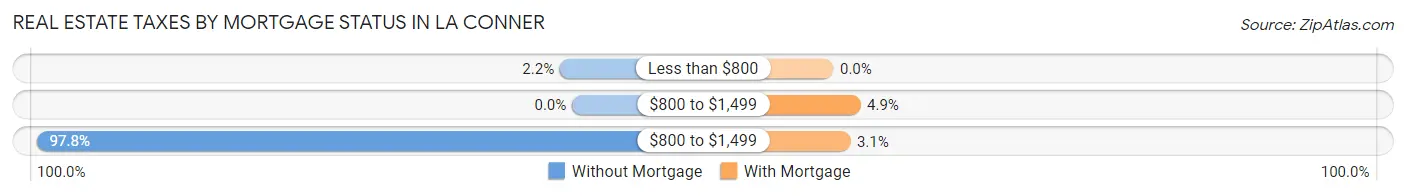
| Property Taxes | Without Mortgage | With Mortgage |
| Less than $800 | 3 (2.2%) | 0 (0.0%) |
| $800 to $1,499 | 0 (0.0%) | 8 (4.9%) |
| $800 to $1,499 | 133 (97.8%) | 5 (3.1%) |
| Total | 136 (100.0%) | 162 (100.0%) |
Health & Disability in La Conner
Health Insurance Coverage by Age in La Conner
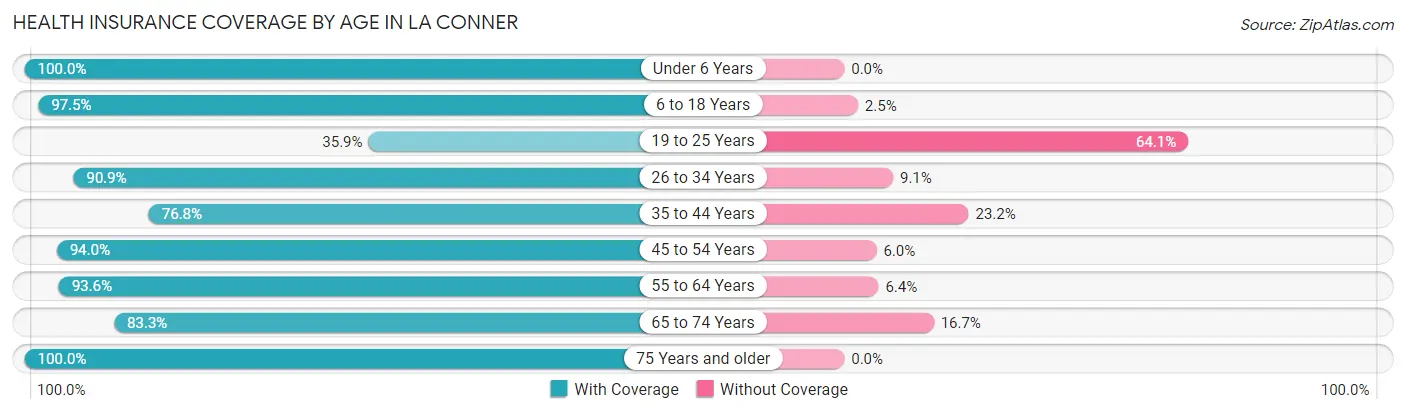
| Age Bracket | With Coverage | Without Coverage |
| Under 6 Years | 18 (100.0%) | 0 (0.0%) |
| 6 to 18 Years | 115 (97.5%) | 3 (2.5%) |
| 19 to 25 Years | 14 (35.9%) | 25 (64.1%) |
| 26 to 34 Years | 30 (90.9%) | 3 (9.1%) |
| 35 to 44 Years | 63 (76.8%) | 19 (23.2%) |
| 45 to 54 Years | 94 (94.0%) | 6 (6.0%) |
| 55 to 64 Years | 235 (93.6%) | 16 (6.4%) |
| 65 to 74 Years | 145 (83.3%) | 29 (16.7%) |
| 75 Years and older | 177 (100.0%) | 0 (0.0%) |
| Total | 891 (89.8%) | 101 (10.2%) |
Health Insurance Coverage by Citizenship Status in La Conner
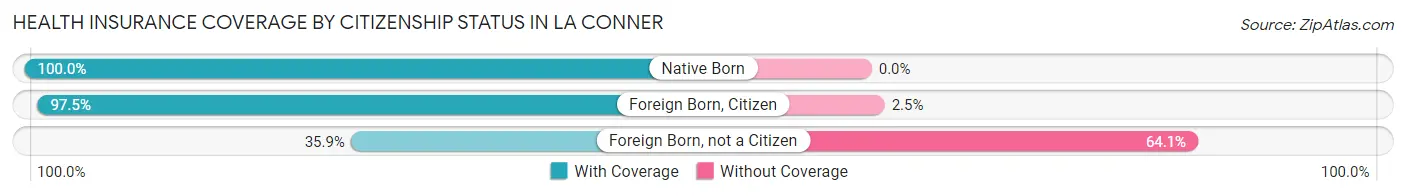
| Citizenship Status | With Coverage | Without Coverage |
| Native Born | 18 (100.0%) | 0 (0.0%) |
| Foreign Born, Citizen | 115 (97.5%) | 3 (2.5%) |
| Foreign Born, not a Citizen | 14 (35.9%) | 25 (64.1%) |
Health Insurance Coverage by Household Income in La Conner
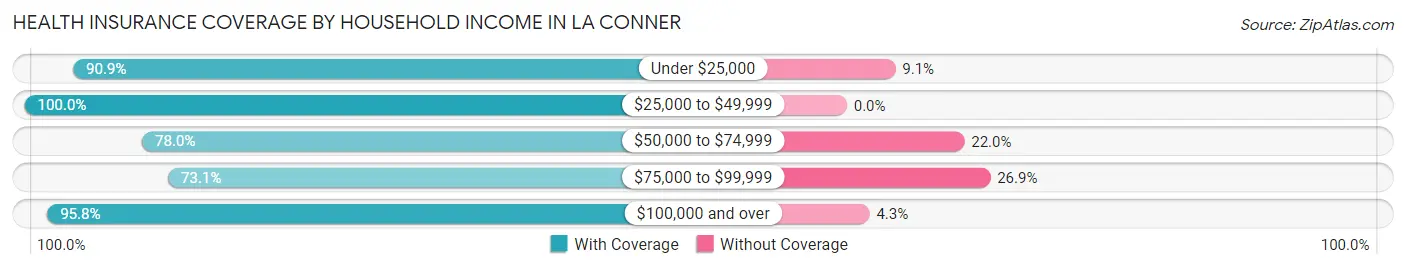
| Household Income | With Coverage | Without Coverage |
| Under $25,000 | 60 (90.9%) | 6 (9.1%) |
| $25,000 to $49,999 | 216 (100.0%) | 0 (0.0%) |
| $50,000 to $74,999 | 85 (78.0%) | 24 (22.0%) |
| $75,000 to $99,999 | 147 (73.1%) | 54 (26.9%) |
| $100,000 and over | 383 (95.8%) | 17 (4.3%) |
Public vs Private Health Insurance Coverage by Age in La Conner
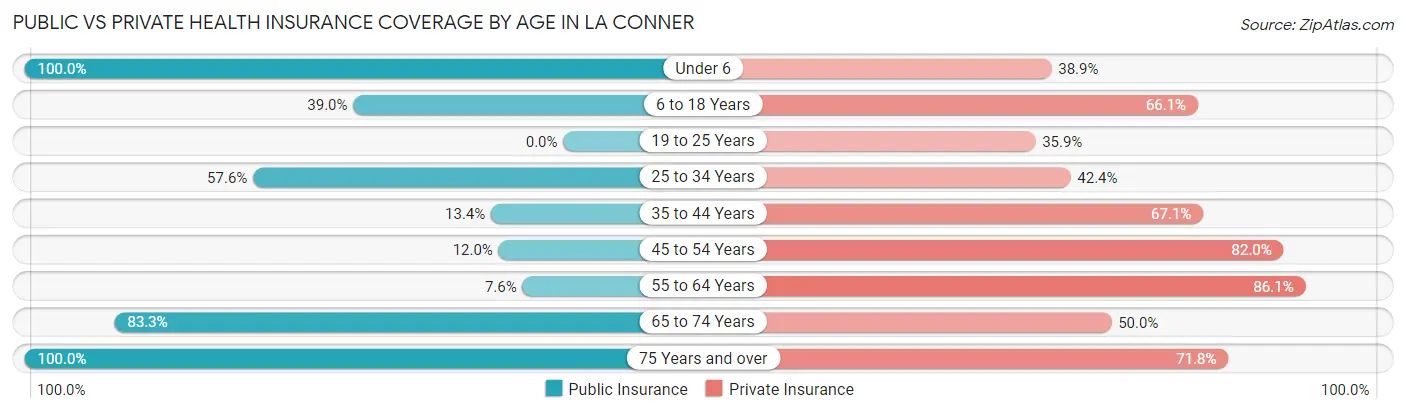
| Age Bracket | Public Insurance | Private Insurance |
| Under 6 | 18 (100.0%) | 7 (38.9%) |
| 6 to 18 Years | 46 (39.0%) | 78 (66.1%) |
| 19 to 25 Years | 0 (0.0%) | 14 (35.9%) |
| 25 to 34 Years | 19 (57.6%) | 14 (42.4%) |
| 35 to 44 Years | 11 (13.4%) | 55 (67.1%) |
| 45 to 54 Years | 12 (12.0%) | 82 (82.0%) |
| 55 to 64 Years | 19 (7.6%) | 216 (86.1%) |
| 65 to 74 Years | 145 (83.3%) | 87 (50.0%) |
| 75 Years and over | 177 (100.0%) | 127 (71.8%) |
| Total | 447 (45.1%) | 680 (68.5%) |
Disability Status by Sex by Age in La Conner
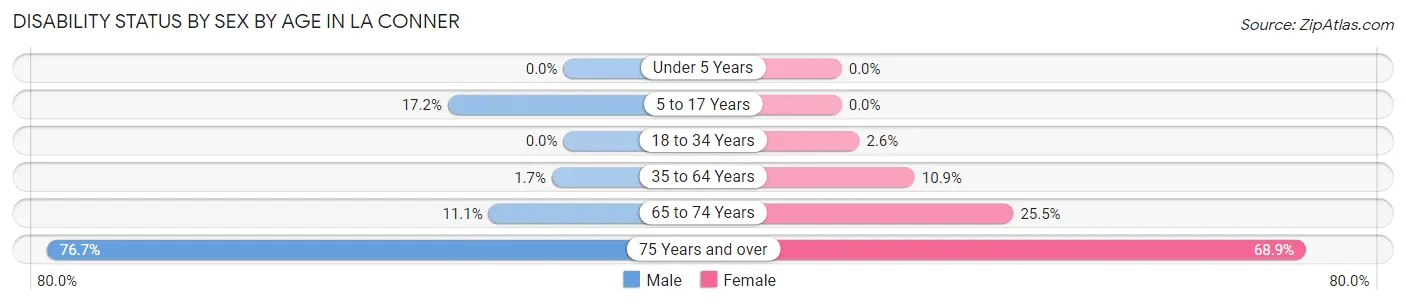
| Age Bracket | Male | Female |
| Under 5 Years | 0 (0.0%) | 0 (0.0%) |
| 5 to 17 Years | 17 (17.2%) | 0 (0.0%) |
| 18 to 34 Years | 0 (0.0%) | 1 (2.6%) |
| 35 to 64 Years | 3 (1.7%) | 28 (10.8%) |
| 65 to 74 Years | 8 (11.1%) | 26 (25.5%) |
| 75 Years and over | 79 (76.7%) | 51 (68.9%) |
Disability Class by Sex by Age in La Conner
Disability Class: Hearing Difficulty
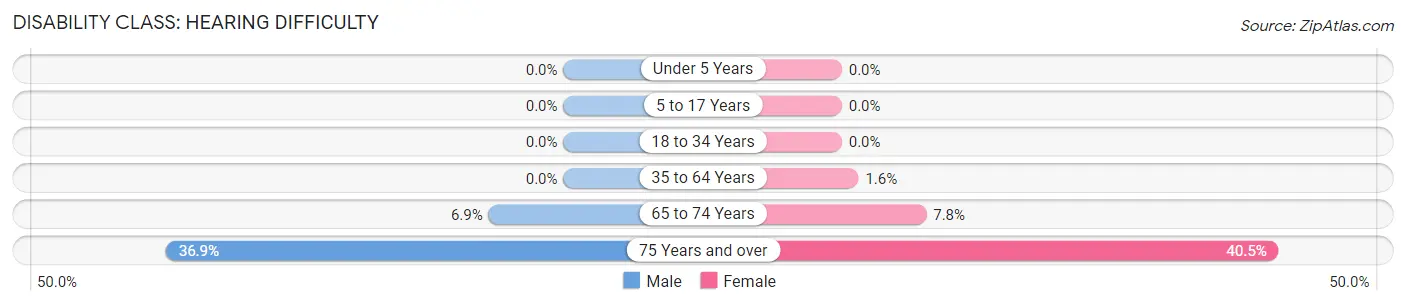
| Age Bracket | Male | Female |
| Under 5 Years | 0 (0.0%) | 0 (0.0%) |
| 5 to 17 Years | 0 (0.0%) | 0 (0.0%) |
| 18 to 34 Years | 0 (0.0%) | 0 (0.0%) |
| 35 to 64 Years | 0 (0.0%) | 4 (1.5%) |
| 65 to 74 Years | 5 (6.9%) | 8 (7.8%) |
| 75 Years and over | 38 (36.9%) | 30 (40.5%) |
Disability Class: Vision Difficulty
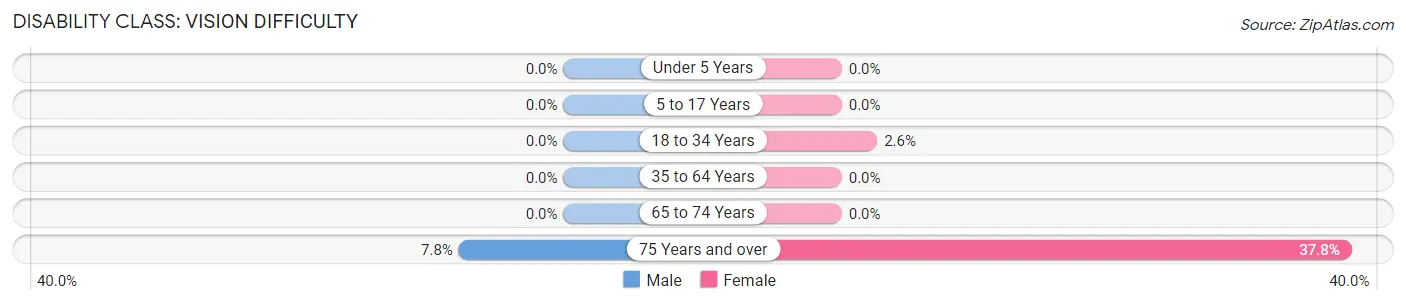
| Age Bracket | Male | Female |
| Under 5 Years | 0 (0.0%) | 0 (0.0%) |
| 5 to 17 Years | 0 (0.0%) | 0 (0.0%) |
| 18 to 34 Years | 0 (0.0%) | 1 (2.6%) |
| 35 to 64 Years | 0 (0.0%) | 0 (0.0%) |
| 65 to 74 Years | 0 (0.0%) | 0 (0.0%) |
| 75 Years and over | 8 (7.8%) | 28 (37.8%) |
Disability Class: Cognitive Difficulty
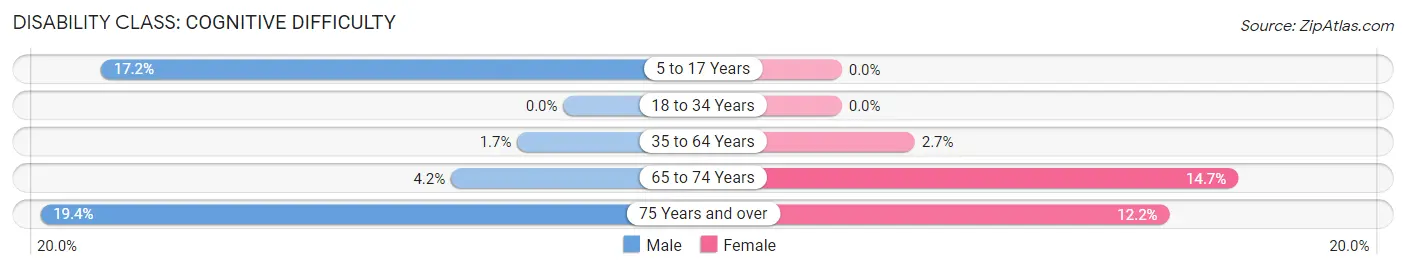
| Age Bracket | Male | Female |
| 5 to 17 Years | 17 (17.2%) | 0 (0.0%) |
| 18 to 34 Years | 0 (0.0%) | 0 (0.0%) |
| 35 to 64 Years | 3 (1.7%) | 7 (2.7%) |
| 65 to 74 Years | 3 (4.2%) | 15 (14.7%) |
| 75 Years and over | 20 (19.4%) | 9 (12.2%) |
Disability Class: Ambulatory Difficulty
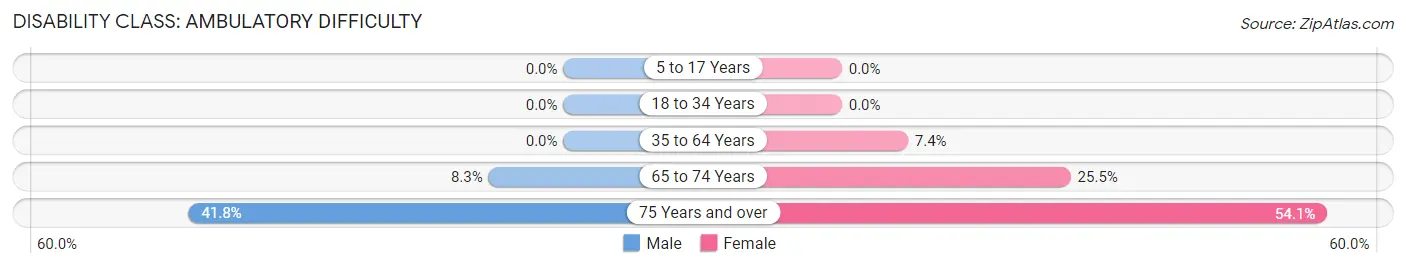
| Age Bracket | Male | Female |
| 5 to 17 Years | 0 (0.0%) | 0 (0.0%) |
| 18 to 34 Years | 0 (0.0%) | 0 (0.0%) |
| 35 to 64 Years | 0 (0.0%) | 19 (7.4%) |
| 65 to 74 Years | 6 (8.3%) | 26 (25.5%) |
| 75 Years and over | 43 (41.7%) | 40 (54.0%) |
Disability Class: Self-Care Difficulty
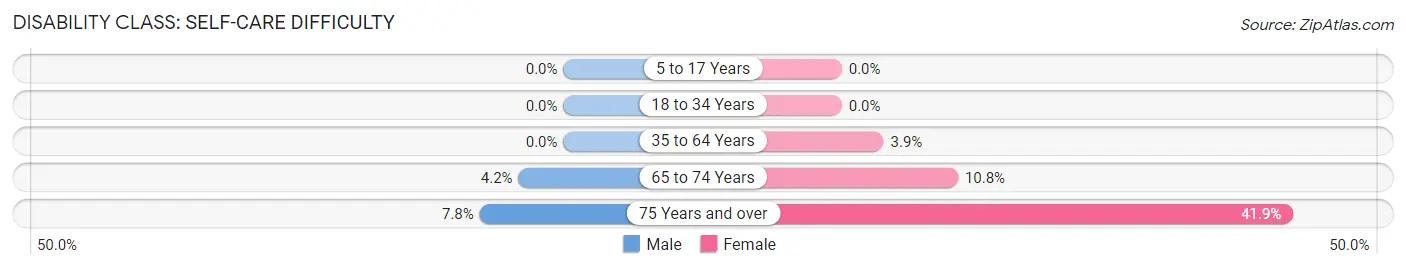
| Age Bracket | Male | Female |
| 5 to 17 Years | 0 (0.0%) | 0 (0.0%) |
| 18 to 34 Years | 0 (0.0%) | 0 (0.0%) |
| 35 to 64 Years | 0 (0.0%) | 10 (3.9%) |
| 65 to 74 Years | 3 (4.2%) | 11 (10.8%) |
| 75 Years and over | 8 (7.8%) | 31 (41.9%) |
Technology Access in La Conner
Computing Device Access in La Conner
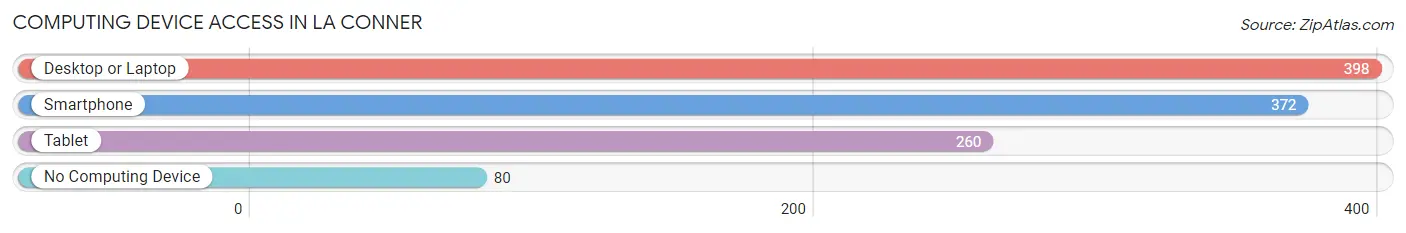
| Device Type | # Households | % Households |
| Desktop or Laptop | 398 | 81.4% |
| Smartphone | 372 | 76.1% |
| Tablet | 260 | 53.2% |
| No Computing Device | 80 | 16.4% |
| Total | 489 | 100.0% |
Internet Access in La Conner
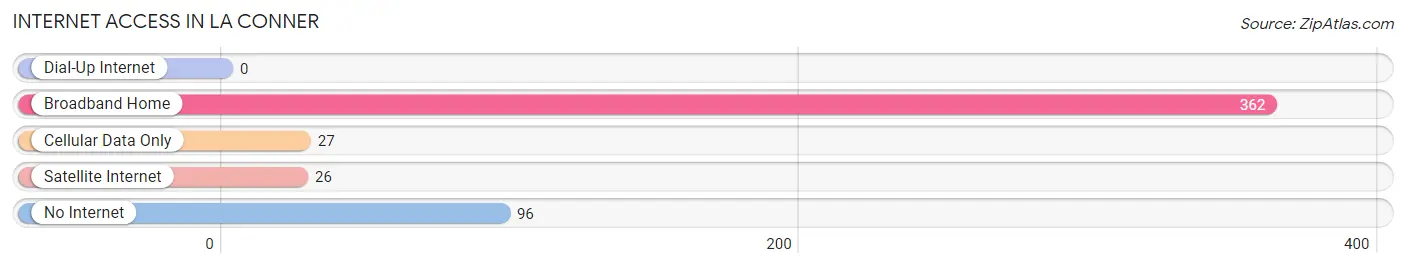
| Internet Type | # Households | % Households |
| Dial-Up Internet | 0 | 0.0% |
| Broadband Home | 362 | 74.0% |
| Cellular Data Only | 27 | 5.5% |
| Satellite Internet | 26 | 5.3% |
| No Internet | 96 | 19.6% |
| Total | 489 | 100.0% |
La Conner Summary
Conner, Washington is a small town located in Skagit County, Washington, United States. It is situated on the Swinomish Channel, which is part of the Salish Sea. The town is known for its picturesque waterfront, historic buildings, and vibrant art scene. The population of Conner was 1,062 at the 2010 census.
History
The area that is now Conner was first inhabited by the Swinomish people, who were part of the Coast Salish tribe. The Swinomish people lived in the area for thousands of years before the arrival of European settlers.
The first European settlers arrived in the area in the late 1800s. The town was originally called Swinomish, but was later changed to Conner in honor of the first postmaster, William Conner. The town was officially incorporated in 1890.
In the early 1900s, Conner was a thriving fishing and logging town. The town was home to several canneries, which processed salmon and other fish caught in the area. The logging industry also provided jobs for many of the town’s residents.
In the 1950s, the town began to decline as the logging and fishing industries declined. The town’s population decreased and many of the businesses closed.
In the 1970s, the town began to experience a resurgence as artists and other creative types moved to the area. The town’s waterfront was revitalized and the town began to attract tourists.
Geography
Conner is located in Skagit County, Washington, United States. It is situated on the Swinomish Channel, which is part of the Salish Sea. The town is located on the east side of the channel, across from the town of La Conner.
The town is located at the intersection of State Route 20 and State Route 536. It is approximately 60 miles north of Seattle and 30 miles south of Bellingham.
The town has a total area of 1.2 square miles, all of which is land. The town is located in a temperate rainforest climate, with mild temperatures and abundant rainfall.
Economy
The economy of Conner is largely based on tourism. The town is known for its picturesque waterfront, historic buildings, and vibrant art scene. The town is home to several art galleries, restaurants, and shops.
The town is also home to several marinas, which provide services to boaters. The town is also home to several boatyards, which provide services to boat owners.
The town is also home to several businesses, including a grocery store, a hardware store, and a pharmacy.
Demographics
As of the 2010 census, the population of Conner was 1,062. The racial makeup of the town was 94.2% White, 0.7% African American, 0.7% Native American, 0.7% Asian, 0.2% Pacific Islander, 0.7% from other races, and 2.5% from two or more races. Hispanic or Latino of any race were 3.2% of the population.
The median income for a household in the town was $41,250, and the median income for a family was $50,000. The per capita income for the town was $20,945. About 10.2% of families and 13.2% of the population were below the poverty line, including 17.2% of those under age 18 and 8.3% of those age 65 or over.
Common Questions
What is Per Capita Income in La Conner?
Per Capita income in La Conner is $47,466.
What is the Median Family Income in La Conner?
Median Family Income in La Conner is $117,708.
What is the Median Household income in La Conner?
Median Household Income in La Conner is $72,981.
What is Income or Wage Gap in La Conner?
Income or Wage Gap in La Conner is 17.7%.
Women in La Conner earn 82.3 cents for every dollar earned by a man.
What is Inequality or Gini Index in La Conner?
Inequality or Gini Index in La Conner is 0.47.
What is the Total Population of La Conner?
Total Population of La Conner is 1,000.
What is the Total Male Population of La Conner?
Total Male Population of La Conner is 503.
What is the Total Female Population of La Conner?
Total Female Population of La Conner is 497.
What is the Ratio of Males per 100 Females in La Conner?
There are 101.21 Males per 100 Females in La Conner.
What is the Ratio of Females per 100 Males in La Conner?
There are 98.81 Females per 100 Males in La Conner.
What is the Median Population Age in La Conner?
Median Population Age in La Conner is 59.5 Years.
What is the Average Family Size in La Conner
Average Family Size in La Conner is 2.8 People.
What is the Average Household Size in La Conner
Average Household Size in La Conner is 2.0 People.
How Large is the Labor Force in La Conner?
There are 462 People in the Labor Forcein in La Conner.
What is the Percentage of People in the Labor Force in La Conner?
51.3% of People are in the Labor Force in La Conner.
What is the Unemployment Rate in La Conner?
Unemployment Rate in La Conner is 0.4%.