Cities with the Highest Percentage of Births to Unmarried Women over the Age of 35 in Ohio
RELATED REPORTS & OPTIONS
Highest Illegitimacy | Women 35+
Ohio
Compare Cities
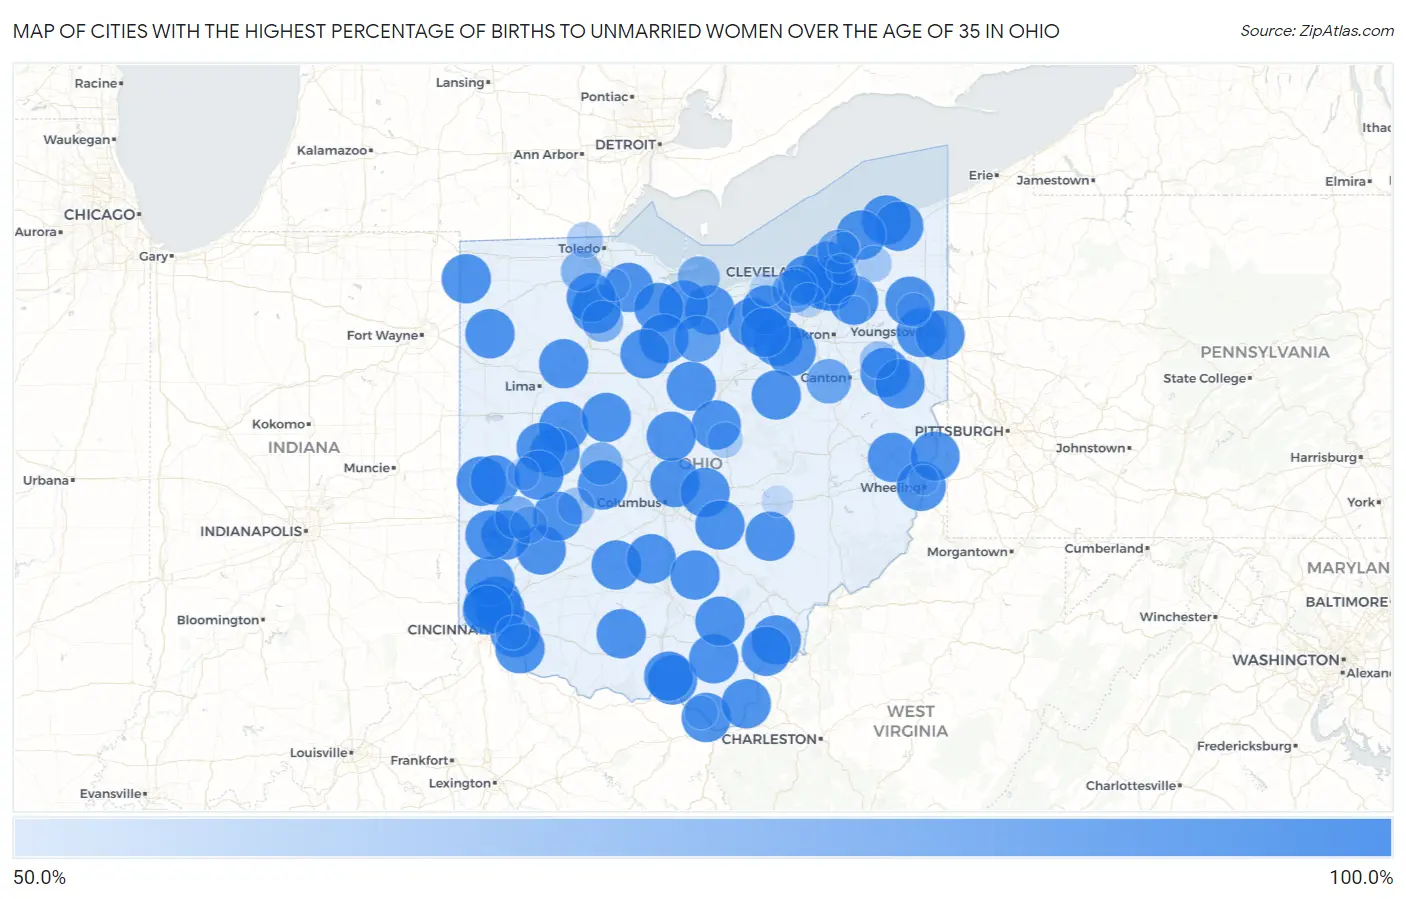
Map of Cities with the Highest Percentage of Births to Unmarried Women over the Age of 35 in Ohio
0.0%
100.0%
Cities with the Highest Percentage of Births to Unmarried Women over the Age of 35 in Ohio
| City | % Unmarried | vs State | vs National | |
| 1. | Austintown | 100.0% | 20.4%(+79.6)#1 | 20.1%(+79.9)#12 |
| 2. | Garfield Heights | 100.0% | 20.4%(+79.6)#2 | 20.1%(+79.9)#13 |
| 3. | Maple Heights | 100.0% | 20.4%(+79.6)#3 | 20.1%(+79.9)#27 |
| 4. | Aurora | 100.0% | 20.4%(+79.6)#4 | 20.1%(+79.9)#56 |
| 5. | Norwalk | 100.0% | 20.4%(+79.6)#5 | 20.1%(+79.9)#57 |
| 6. | Washington Court House | 100.0% | 20.4%(+79.6)#6 | 20.1%(+79.9)#88 |
| 7. | East Cleveland | 100.0% | 20.4%(+79.6)#7 | 20.1%(+79.9)#101 |
| 8. | Warrensville Heights | 100.0% | 20.4%(+79.6)#8 | 20.1%(+79.9)#106 |
| 9. | Greenville | 100.0% | 20.4%(+79.6)#9 | 20.1%(+79.9)#117 |
| 10. | Brooklyn | 100.0% | 20.4%(+79.6)#10 | 20.1%(+79.9)#146 |
| 11. | Springdale | 100.0% | 20.4%(+79.6)#11 | 20.1%(+79.9)#153 |
| 12. | Galion | 100.0% | 20.4%(+79.6)#12 | 20.1%(+79.9)#174 |
| 13. | North Madison | 100.0% | 20.4%(+79.6)#13 | 20.1%(+79.9)#231 |
| 14. | Bellevue | 100.0% | 20.4%(+79.6)#14 | 20.1%(+79.9)#234 |
| 15. | Campbell | 100.0% | 20.4%(+79.6)#15 | 20.1%(+79.9)#247 |
| 16. | Bellbrook | 100.0% | 20.4%(+79.6)#16 | 20.1%(+79.9)#264 |
| 17. | Champion Heights | 100.0% | 20.4%(+79.6)#17 | 20.1%(+79.9)#296 |
| 18. | Geneva | 100.0% | 20.4%(+79.6)#18 | 20.1%(+79.9)#322 |
| 19. | New Burlington | 100.0% | 20.4%(+79.6)#19 | 20.1%(+79.9)#367 |
| 20. | Wellington | 100.0% | 20.4%(+79.6)#20 | 20.1%(+79.9)#431 |
| 21. | Huber Ridge | 100.0% | 20.4%(+79.6)#21 | 20.1%(+79.9)#433 |
| 22. | Cherry Grove | 100.0% | 20.4%(+79.6)#22 | 20.1%(+79.9)#443 |
| 23. | New Lebanon | 100.0% | 20.4%(+79.6)#23 | 20.1%(+79.9)#449 |
| 24. | Bluffton | 100.0% | 20.4%(+79.6)#24 | 20.1%(+79.9)#491 |
| 25. | Lockland | 100.0% | 20.4%(+79.6)#25 | 20.1%(+79.9)#493 |
| 26. | Cadiz | 100.0% | 20.4%(+79.6)#26 | 20.1%(+79.9)#537 |
| 27. | Beechwood Trails | 100.0% | 20.4%(+79.6)#27 | 20.1%(+79.9)#553 |
| 28. | Lodi | 100.0% | 20.4%(+79.6)#28 | 20.1%(+79.9)#578 |
| 29. | New Richmond | 100.0% | 20.4%(+79.6)#29 | 20.1%(+79.9)#581 |
| 30. | Lagrange | 100.0% | 20.4%(+79.6)#30 | 20.1%(+79.9)#604 |
| 31. | Fredericktown | 100.0% | 20.4%(+79.6)#31 | 20.1%(+79.9)#608 |
| 32. | Gibsonburg | 100.0% | 20.4%(+79.6)#32 | 20.1%(+79.9)#621 |
| 33. | New Boston | 100.0% | 20.4%(+79.6)#33 | 20.1%(+79.9)#622 |
| 34. | New Miami | 100.0% | 20.4%(+79.6)#34 | 20.1%(+79.9)#649 |
| 35. | Green Meadows | 100.0% | 20.4%(+79.6)#35 | 20.1%(+79.9)#672 |
| 36. | Creston | 100.0% | 20.4%(+79.6)#36 | 20.1%(+79.9)#696 |
| 37. | Coal Grove | 100.0% | 20.4%(+79.6)#37 | 20.1%(+79.9)#703 |
| 38. | Rosemount | 100.0% | 20.4%(+79.6)#38 | 20.1%(+79.9)#712 |
| 39. | Edgerton | 100.0% | 20.4%(+79.6)#39 | 20.1%(+79.9)#713 |
| 40. | Mechanicsburg | 100.0% | 20.4%(+79.6)#40 | 20.1%(+79.9)#743 |
| 41. | Oak Hill | 100.0% | 20.4%(+79.6)#41 | 20.1%(+79.9)#780 |
| 42. | Shreve | 100.0% | 20.4%(+79.6)#42 | 20.1%(+79.9)#784 |
| 43. | Pomeroy | 100.0% | 20.4%(+79.6)#43 | 20.1%(+79.9)#807 |
| 44. | Ashley | 100.0% | 20.4%(+79.6)#44 | 20.1%(+79.9)#830 |
| 45. | Bridgeport | 100.0% | 20.4%(+79.6)#45 | 20.1%(+79.9)#843 |
| 46. | West Alexandria | 100.0% | 20.4%(+79.6)#46 | 20.1%(+79.9)#846 |
| 47. | Green Springs | 100.0% | 20.4%(+79.6)#47 | 20.1%(+79.9)#879 |
| 48. | Russells Point | 100.0% | 20.4%(+79.6)#48 | 20.1%(+79.9)#901 |
| 49. | Skyline Acres | 100.0% | 20.4%(+79.6)#49 | 20.1%(+79.9)#914 |
| 50. | Brilliant | 100.0% | 20.4%(+79.6)#50 | 20.1%(+79.9)#953 |
| 51. | Williamsport | 100.0% | 20.4%(+79.6)#51 | 20.1%(+79.9)#989 |
| 52. | Bloomville | 100.0% | 20.4%(+79.6)#52 | 20.1%(+79.9)#1,030 |
| 53. | Pleasantville | 100.0% | 20.4%(+79.6)#53 | 20.1%(+79.9)#1,073 |
| 54. | Sycamore | 100.0% | 20.4%(+79.6)#54 | 20.1%(+79.9)#1,095 |
| 55. | Hamden | 100.0% | 20.4%(+79.6)#55 | 20.1%(+79.9)#1,117 |
| 56. | Grand River | 100.0% | 20.4%(+79.6)#56 | 20.1%(+79.9)#1,119 |
| 57. | Homeworth | 100.0% | 20.4%(+79.6)#57 | 20.1%(+79.9)#1,128 |
| 58. | Mount Victory | 100.0% | 20.4%(+79.6)#58 | 20.1%(+79.9)#1,135 |
| 59. | Laurelville | 100.0% | 20.4%(+79.6)#59 | 20.1%(+79.9)#1,155 |
| 60. | Gettysburg | 100.0% | 20.4%(+79.6)#60 | 20.1%(+79.9)#1,163 |
| 61. | Spencer | 100.0% | 20.4%(+79.6)#61 | 20.1%(+79.9)#1,173 |
| 62. | Jerry City | 100.0% | 20.4%(+79.6)#62 | 20.1%(+79.9)#1,193 |
| 63. | Crown City | 100.0% | 20.4%(+79.6)#63 | 20.1%(+79.9)#1,204 |
| 64. | Portage | 100.0% | 20.4%(+79.6)#64 | 20.1%(+79.9)#1,239 |
| 65. | Quincy | 100.0% | 20.4%(+79.6)#65 | 20.1%(+79.9)#1,265 |
| 66. | Port Jefferson | 100.0% | 20.4%(+79.6)#66 | 20.1%(+79.9)#1,275 |
| 67. | Fletcher | 100.0% | 20.4%(+79.6)#67 | 20.1%(+79.9)#1,276 |
| 68. | Hanoverton | 100.0% | 20.4%(+79.6)#68 | 20.1%(+79.9)#1,297 |
| 69. | Sinking Spring | 100.0% | 20.4%(+79.6)#69 | 20.1%(+79.9)#1,334 |
| 70. | Cheshire | 100.0% | 20.4%(+79.6)#70 | 20.1%(+79.9)#1,423 |
| 71. | Rose Farm | 100.0% | 20.4%(+79.6)#71 | 20.1%(+79.9)#1,432 |
| 72. | Broughton | 100.0% | 20.4%(+79.6)#72 | 20.1%(+79.9)#1,436 |
| 73. | Willard | 92.0% | 20.4%(+71.6)#73 | 20.1%(+71.9)#1,469 |
| 74. | Massillon | 87.9% | 20.4%(+67.5)#74 | 20.1%(+67.8)#1,496 |
| 75. | Berea | 84.6% | 20.4%(+64.2)#75 | 20.1%(+64.5)#1,514 |
| 76. | Willowick | 84.6% | 20.4%(+64.2)#76 | 20.1%(+64.5)#1,515 |
| 77. | Englewood | 83.7% | 20.4%(+63.3)#77 | 20.1%(+63.6)#1,525 |
| 78. | North Lewisburg | 83.3% | 20.4%(+62.9)#78 | 20.1%(+63.2)#1,531 |
| 79. | Sandusky | 81.8% | 20.4%(+61.4)#79 | 20.1%(+61.7)#1,540 |
| 80. | Bloomdale | 80.0% | 20.4%(+59.6)#80 | 20.1%(+59.9)#1,563 |
| 81. | Waterville | 78.3% | 20.4%(+57.9)#81 | 20.1%(+58.2)#1,575 |
| 82. | Brook Park | 76.6% | 20.4%(+56.2)#82 | 20.1%(+56.5)#1,594 |
| 83. | Alliance | 71.0% | 20.4%(+50.6)#83 | 20.1%(+50.9)#1,669 |
| 84. | Dayton | 70.1% | 20.4%(+49.7)#84 | 20.1%(+50.0)#1,674 |
| 85. | Springfield | 69.4% | 20.4%(+49.0)#85 | 20.1%(+49.3)#1,685 |
| 86. | Sylvania | 66.7% | 20.4%(+46.3)#86 | 20.1%(+46.6)#1,719 |
| 87. | Aquilla | 66.7% | 20.4%(+46.3)#87 | 20.1%(+46.6)#1,746 |
| 88. | Mount Vernon | 65.7% | 20.4%(+45.3)#88 | 20.1%(+45.6)#1,753 |
| 89. | North Royalton | 62.6% | 20.4%(+42.2)#89 | 20.1%(+42.5)#1,821 |
| 90. | Forestville | 62.5% | 20.4%(+42.1)#90 | 20.1%(+42.4)#1,824 |
| 91. | Warren | 62.0% | 20.4%(+41.6)#91 | 20.1%(+41.9)#1,842 |
| 92. | Elyria | 61.5% | 20.4%(+41.1)#92 | 20.1%(+41.4)#1,854 |
| 93. | Ironton | 60.9% | 20.4%(+40.5)#93 | 20.1%(+40.8)#1,868 |
| 94. | Piqua | 58.5% | 20.4%(+38.1)#94 | 20.1%(+38.4)#1,919 |
| 95. | Pemberville | 57.1% | 20.4%(+36.7)#95 | 20.1%(+37.0)#1,956 |
| 96. | Zanesville | 56.0% | 20.4%(+35.6)#96 | 20.1%(+35.9)#1,977 |
| 97. | Eastlake | 55.6% | 20.4%(+35.2)#97 | 20.1%(+35.5)#1,984 |
| 98. | Martins Ferry | 53.8% | 20.4%(+33.4)#98 | 20.1%(+33.7)#2,023 |
| 99. | Streetsboro | 53.2% | 20.4%(+32.8)#99 | 20.1%(+33.1)#2,035 |
| 100. | Mayfield Heights | 52.4% | 20.4%(+32.0)#100 | 20.1%(+32.3)#2,055 |
Common Questions
What are the Top 10 Cities with the Highest Percentage of Births to Unmarried Women over the Age of 35 in Ohio?
Top 10 Cities with the Highest Percentage of Births to Unmarried Women over the Age of 35 in Ohio are:
#1
100.0%
#2
100.0%
#3
100.0%
#4
100.0%
#5
100.0%
#6
100.0%
#7
100.0%
#8
100.0%
#9
100.0%
#10
100.0%
What city has the Highest Percentage of Births to Unmarried Women over the Age of 35 in Ohio?
Austintown has the Highest Percentage of Births to Unmarried Women over the Age of 35 in Ohio with 100.0%.
What is the Percentage of Births to Unmarried Women over the Age of 35 in the State of Ohio?
Percentage of Births to Unmarried Women over the Age of 35 in Ohio is 20.4%.
What is the Percentage of Births to Unmarried Women over the Age of 35 in the United States?
Percentage of Births to Unmarried Women over the Age of 35 in the United States is 20.1%.