Yakima, WA Map & Demographics
Yakima Map
Yakima Overview
$27,253
PER CAPITA INCOME
$67,644
AVG FAMILY INCOME
$55,734
AVG HOUSEHOLD INCOME
15.3%
WAGE / INCOME GAP [ % ]
84.7¢/ $1
WAGE / INCOME GAP [ $ ]
$9,805
FAMILY INCOME DEFICIT
0.44
INEQUALITY / GINI INDEX
96,764
TOTAL POPULATION
48,341
MALE POPULATION
48,423
FEMALE POPULATION
99.83
MALES / 100 FEMALES
100.17
FEMALES / 100 MALES
33.9
MEDIAN AGE
3.4
AVG FAMILY SIZE
2.7
AVG HOUSEHOLD SIZE
42,706
LABOR FORCE [ PEOPLE ]
58.9%
PERCENT IN LABOR FORCE
8.1%
UNEMPLOYMENT RATE
Yakima Area Codes
Income in Yakima
Income Overview in Yakima
Per Capita Income in Yakima is $27,253, while median incomes of families and households are $67,644 and $55,734 respectively.
| Characteristic | Number | Measure |
| Per Capita Income | 96,764 | $27,253 |
| Median Family Income | 22,231 | $67,644 |
| Mean Family Income | 22,231 | $83,814 |
| Median Household Income | 34,830 | $55,734 |
| Mean Household Income | 34,830 | $73,999 |
| Income Deficit | 22,231 | $9,805 |
| Wage / Income Gap (%) | 96,764 | 15.33% |
| Wage / Income Gap ($) | 96,764 | 84.67¢ per $1 |
| Gini / Inequality Index | 96,764 | 0.44 |
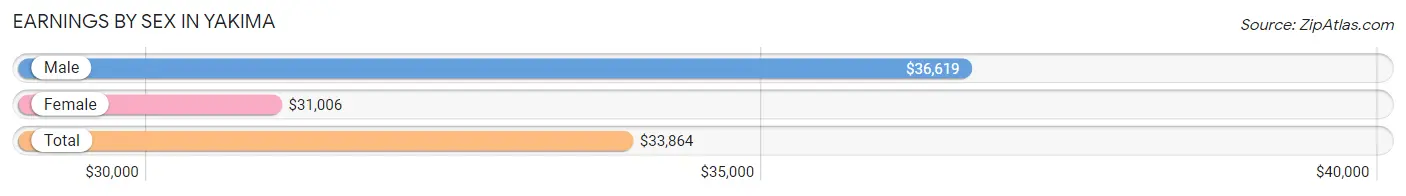
Earnings by Sex in Yakima
Average Earnings in Yakima are $33,864, $36,619 for men and $31,006 for women, a difference of 15.3%.
| Sex | Number | Average Earnings |
| Male | 23,878 (53.1%) | $36,619 |
| Female | 21,084 (46.9%) | $31,006 |
| Total | 44,962 (100.0%) | $33,864 |
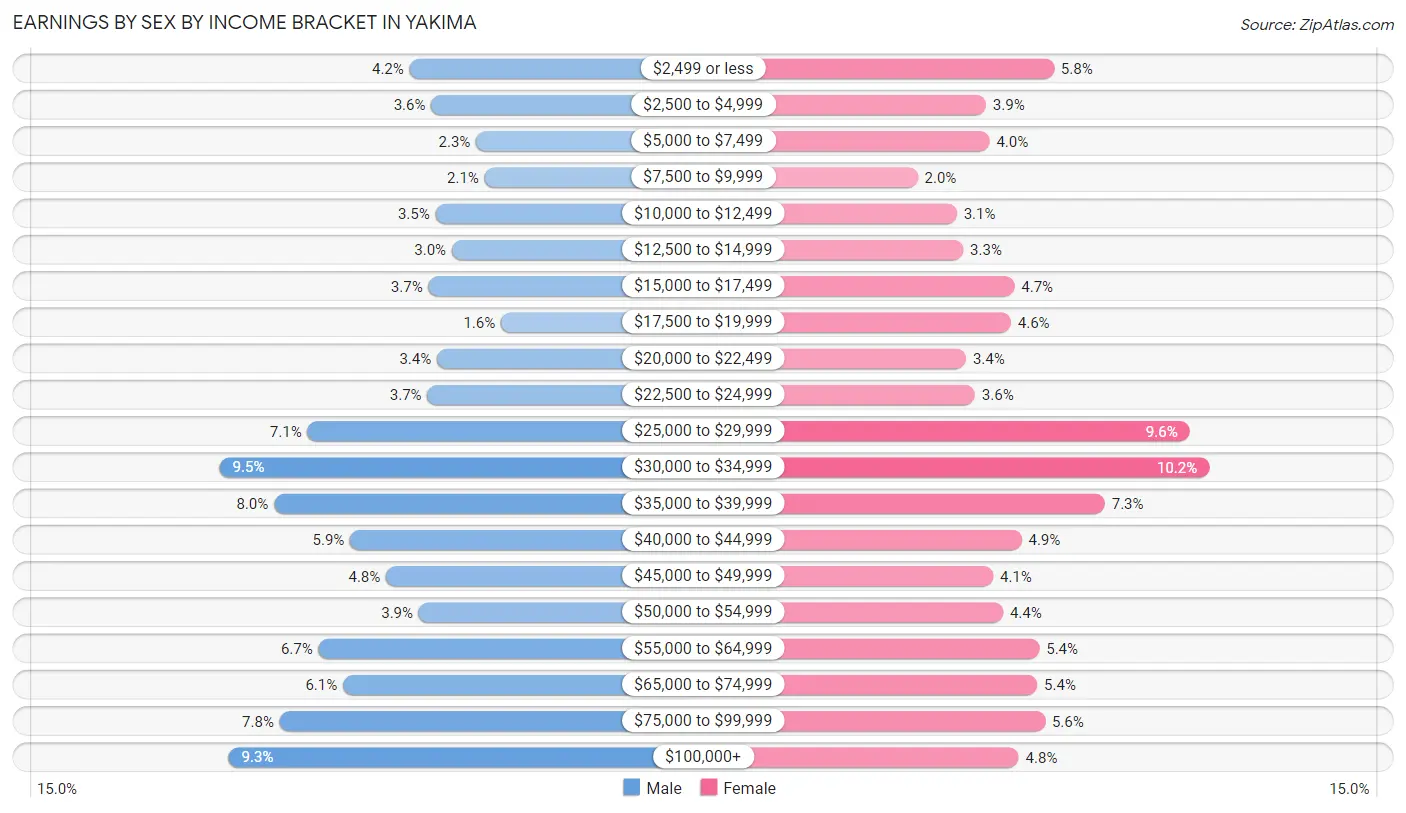
Earnings by Sex by Income Bracket in Yakima
The most common earnings brackets in Yakima are $30,000 to $34,999 for men (2,274 | 9.5%) and $30,000 to $34,999 for women (2,147 | 10.2%).
| Income | Male | Female |
| $2,499 or less | 999 (4.2%) | 1,227 (5.8%) |
| $2,500 to $4,999 | 852 (3.6%) | 825 (3.9%) |
| $5,000 to $7,499 | 552 (2.3%) | 845 (4.0%) |
| $7,500 to $9,999 | 495 (2.1%) | 420 (2.0%) |
| $10,000 to $12,499 | 823 (3.5%) | 651 (3.1%) |
| $12,500 to $14,999 | 715 (3.0%) | 689 (3.3%) |
| $15,000 to $17,499 | 872 (3.6%) | 994 (4.7%) |
| $17,500 to $19,999 | 384 (1.6%) | 972 (4.6%) |
| $20,000 to $22,499 | 814 (3.4%) | 706 (3.4%) |
| $22,500 to $24,999 | 878 (3.7%) | 759 (3.6%) |
| $25,000 to $29,999 | 1,684 (7.0%) | 2,030 (9.6%) |
| $30,000 to $34,999 | 2,274 (9.5%) | 2,147 (10.2%) |
| $35,000 to $39,999 | 1,909 (8.0%) | 1,529 (7.2%) |
| $40,000 to $44,999 | 1,397 (5.9%) | 1,036 (4.9%) |
| $45,000 to $49,999 | 1,156 (4.8%) | 867 (4.1%) |
| $50,000 to $54,999 | 937 (3.9%) | 925 (4.4%) |
| $55,000 to $64,999 | 1,610 (6.7%) | 1,141 (5.4%) |
| $65,000 to $74,999 | 1,444 (6.0%) | 1,128 (5.3%) |
| $75,000 to $99,999 | 1,869 (7.8%) | 1,175 (5.6%) |
| $100,000+ | 2,214 (9.3%) | 1,018 (4.8%) |
| Total | 23,878 (100.0%) | 21,084 (100.0%) |
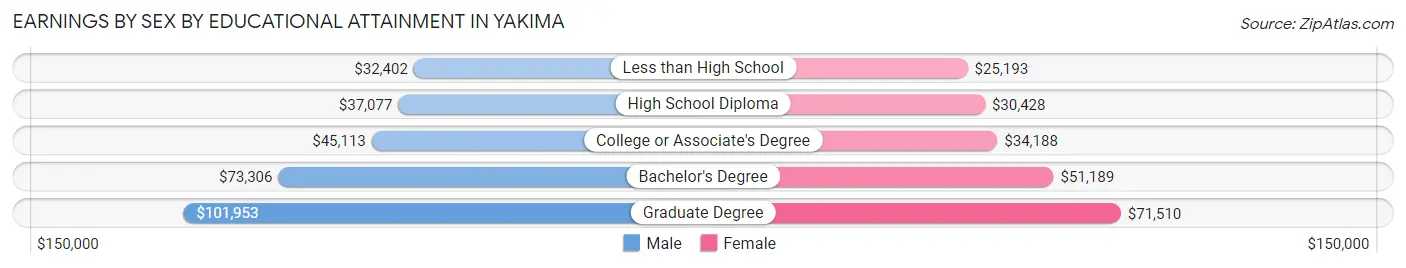
Earnings by Sex by Educational Attainment in Yakima
Average earnings in Yakima are $40,008 for men and $34,106 for women, a difference of 14.7%. Men with an educational attainment of graduate degree enjoy the highest average annual earnings of $101,953, while those with less than high school education earn the least with $32,402. Women with an educational attainment of graduate degree earn the most with the average annual earnings of $71,510, while those with less than high school education have the smallest earnings of $25,193.
| Educational Attainment | Male Income | Female Income |
| Less than High School | $32,402 | $25,193 |
| High School Diploma | $37,077 | $30,428 |
| College or Associate's Degree | $45,113 | $34,188 |
| Bachelor's Degree | $73,306 | $51,189 |
| Graduate Degree | $101,953 | $71,510 |
| Total | $40,008 | $34,106 |
Family Income in Yakima
Family Income Brackets in Yakima
According to the Yakima family income data, there are 3,802 families falling into the $50,000 to $74,999 income range, which is the most common income bracket and makes up 17.1% of all families. Conversely, the $10,000 to $14,999 income bracket is the least frequent group with only 511 families (2.3%) belonging to this category.
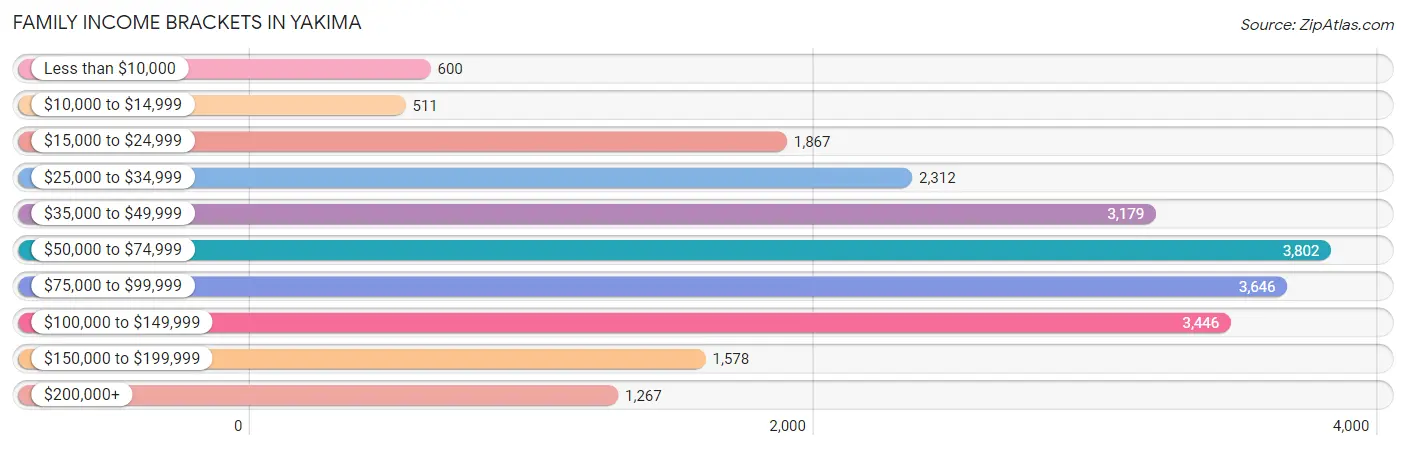
| Income Bracket | # Families | % Families |
| Less than $10,000 | 600 | 2.7% |
| $10,000 to $14,999 | 511 | 2.3% |
| $15,000 to $24,999 | 1,867 | 8.4% |
| $25,000 to $34,999 | 2,312 | 10.4% |
| $35,000 to $49,999 | 3,179 | 14.3% |
| $50,000 to $74,999 | 3,802 | 17.1% |
| $75,000 to $99,999 | 3,646 | 16.4% |
| $100,000 to $149,999 | 3,446 | 15.5% |
| $150,000 to $199,999 | 1,578 | 7.1% |
| $200,000+ | 1,267 | 5.7% |
Family Income by Famaliy Size in Yakima
7+ person families (454 | 2.0%) account for the highest median family income in Yakima with $82,371 per family, while 2-person families (9,138 | 41.1%) have the highest median income of $31,088 per family member.
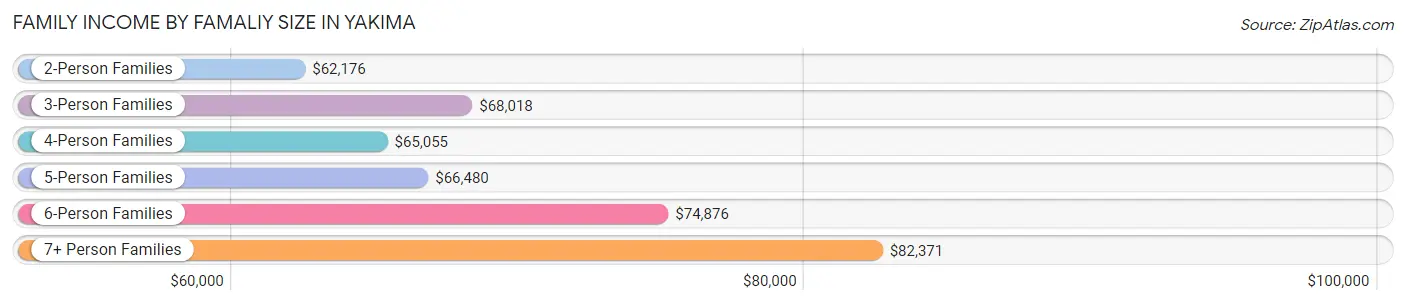
| Income Bracket | # Families | Median Income |
| 2-Person Families | 9,138 (41.1%) | $62,176 |
| 3-Person Families | 3,951 (17.8%) | $68,018 |
| 4-Person Families | 5,097 (22.9%) | $65,055 |
| 5-Person Families | 2,517 (11.3%) | $66,480 |
| 6-Person Families | 1,074 (4.8%) | $74,876 |
| 7+ Person Families | 454 (2.0%) | $82,371 |
| Total | 22,231 (100.0%) | $67,644 |
Family Income by Number of Earners in Yakima
The median family income in Yakima is $67,644, with families comprising 3+ earners (2,790) having the highest median family income of $109,524, while families with 1 earner (8,173) have the lowest median family income of $42,964, accounting for 12.6% and 36.8% of families, respectively.
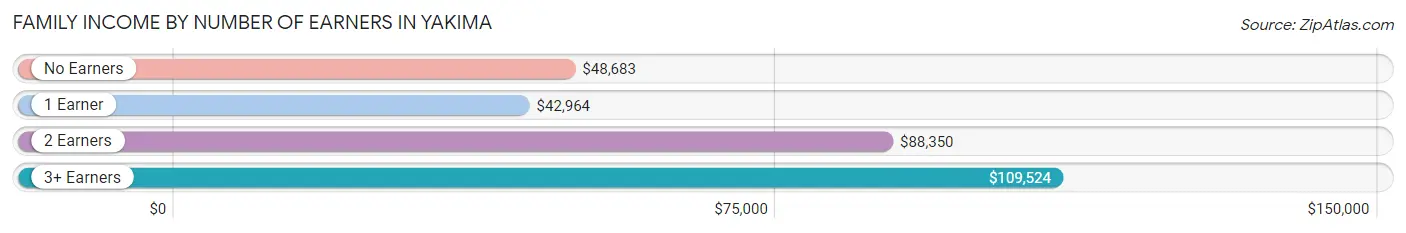
| Number of Earners | # Families | Median Income |
| No Earners | 3,327 (15.0%) | $48,683 |
| 1 Earner | 8,173 (36.8%) | $42,964 |
| 2 Earners | 7,941 (35.7%) | $88,350 |
| 3+ Earners | 2,790 (12.6%) | $109,524 |
| Total | 22,231 (100.0%) | $67,644 |
Household Income in Yakima
Household Income Brackets in Yakima
With 6,060 households falling in the category, the $50,000 to $74,999 income range is the most frequent in Yakima, accounting for 17.4% of all households. In contrast, only 1,428 households (4.1%) fall into the less than $10,000 income bracket, making it the least populous group.
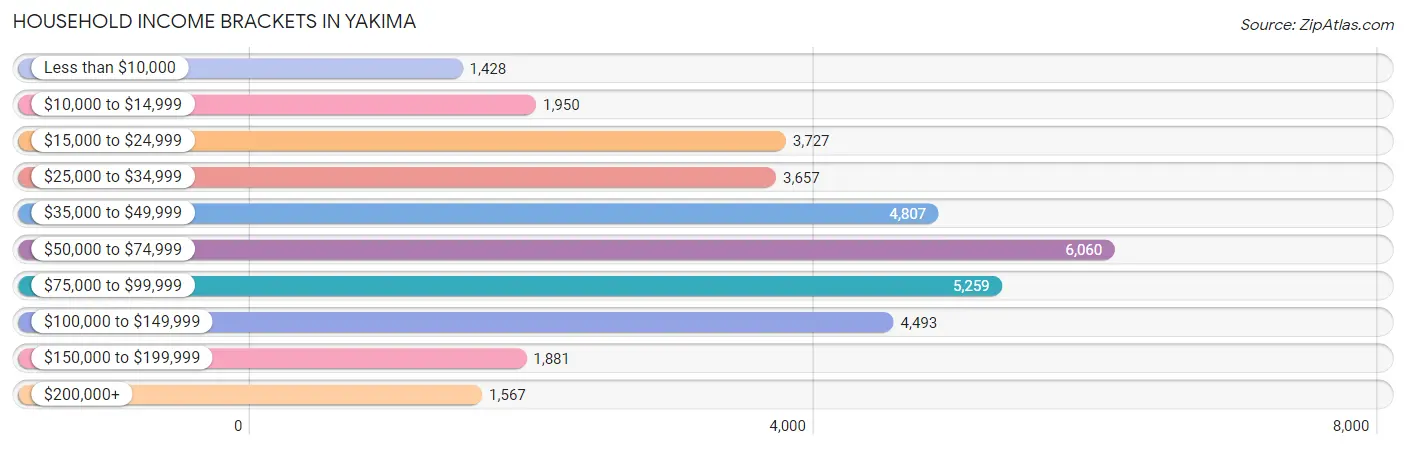
| Income Bracket | # Households | % Households |
| Less than $10,000 | 1,428 | 4.1% |
| $10,000 to $14,999 | 1,950 | 5.6% |
| $15,000 to $24,999 | 3,727 | 10.7% |
| $25,000 to $34,999 | 3,657 | 10.5% |
| $35,000 to $49,999 | 4,807 | 13.8% |
| $50,000 to $74,999 | 6,060 | 17.4% |
| $75,000 to $99,999 | 5,259 | 15.1% |
| $100,000 to $149,999 | 4,493 | 12.9% |
| $150,000 to $199,999 | 1,881 | 5.4% |
| $200,000+ | 1,567 | 4.5% |
Household Income by Householder Age in Yakima
The median household income in Yakima is $55,734, with the highest median household income of $67,261 found in the 45 to 64 years age bracket for the primary householder. A total of 10,986 households (31.5%) fall into this category. Meanwhile, the 15 to 24 years age bracket for the primary householder has the lowest median household income of $42,235, with 1,263 households (3.6%) in this group.
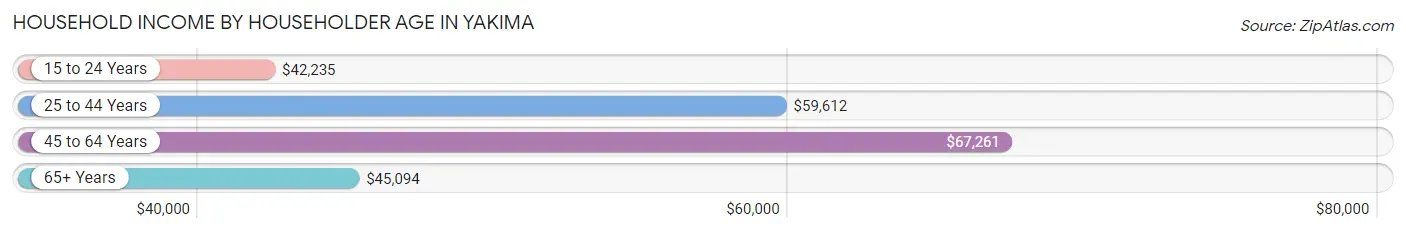
| Income Bracket | # Households | Median Income |
| 15 to 24 Years | 1,263 (3.6%) | $42,235 |
| 25 to 44 Years | 12,508 (35.9%) | $59,612 |
| 45 to 64 Years | 10,986 (31.5%) | $67,261 |
| 65+ Years | 10,073 (28.9%) | $45,094 |
| Total | 34,830 (100.0%) | $55,734 |
Poverty in Yakima
Income Below Poverty by Sex and Age in Yakima
With 18.5% poverty level for males and 19.7% for females among the residents of Yakima, under 5 year old males and 12 to 14 year old females are the most vulnerable to poverty, with 1,380 males (36.0%) and 725 females (30.5%) in their respective age groups living below the poverty level.
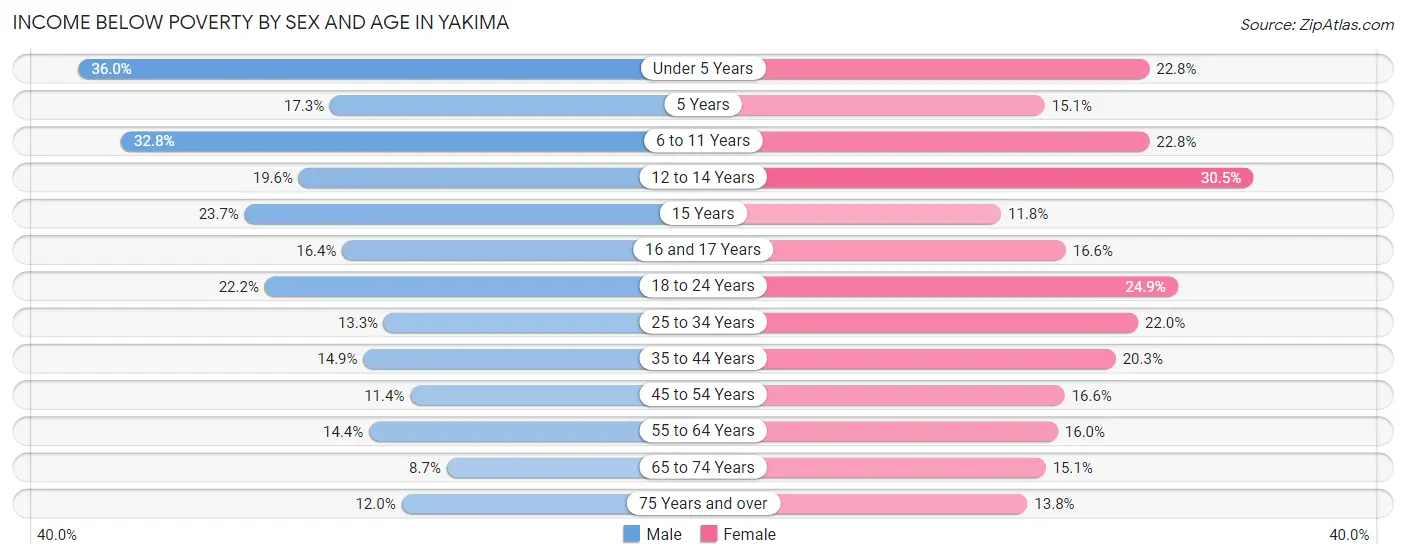
| Age Bracket | Male | Female |
| Under 5 Years | 1,380 (36.0%) | 759 (22.8%) |
| 5 Years | 101 (17.3%) | 85 (15.1%) |
| 6 to 11 Years | 1,733 (32.8%) | 920 (22.8%) |
| 12 to 14 Years | 395 (19.6%) | 725 (30.5%) |
| 15 Years | 220 (23.7%) | 106 (11.8%) |
| 16 and 17 Years | 233 (16.4%) | 203 (16.6%) |
| 18 to 24 Years | 1,002 (22.2%) | 1,090 (24.9%) |
| 25 to 34 Years | 913 (13.3%) | 1,441 (22.0%) |
| 35 to 44 Years | 798 (14.8%) | 1,301 (20.3%) |
| 45 to 54 Years | 593 (11.4%) | 803 (16.6%) |
| 55 to 64 Years | 670 (14.4%) | 740 (16.0%) |
| 65 to 74 Years | 302 (8.7%) | 689 (15.1%) |
| 75 Years and over | 344 (12.0%) | 527 (13.8%) |
| Total | 8,684 (18.5%) | 9,389 (19.7%) |
Income Above Poverty by Sex and Age in Yakima
According to the poverty statistics in Yakima, males aged 65 to 74 years and females aged 15 years are the age groups that are most secure financially, with 91.3% of males and 88.2% of females in these age groups living above the poverty line.
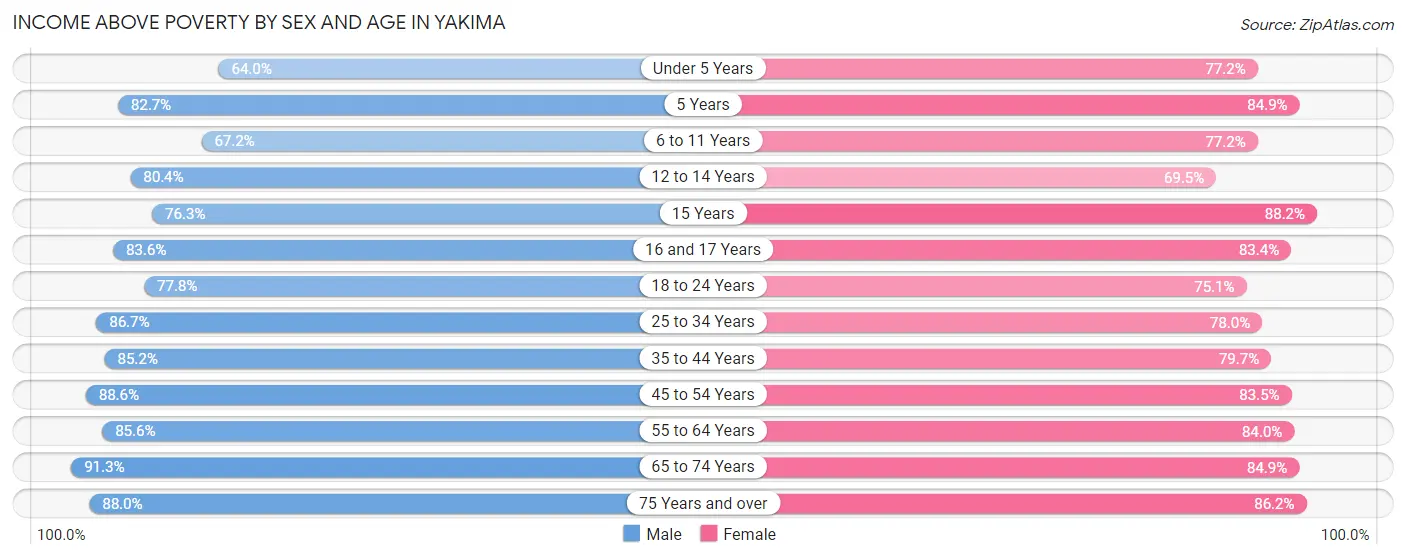
| Age Bracket | Male | Female |
| Under 5 Years | 2,453 (64.0%) | 2,565 (77.2%) |
| 5 Years | 482 (82.7%) | 479 (84.9%) |
| 6 to 11 Years | 3,545 (67.2%) | 3,109 (77.2%) |
| 12 to 14 Years | 1,616 (80.4%) | 1,650 (69.5%) |
| 15 Years | 710 (76.3%) | 790 (88.2%) |
| 16 and 17 Years | 1,187 (83.6%) | 1,018 (83.4%) |
| 18 to 24 Years | 3,517 (77.8%) | 3,282 (75.1%) |
| 25 to 34 Years | 5,942 (86.7%) | 5,109 (78.0%) |
| 35 to 44 Years | 4,575 (85.2%) | 5,095 (79.7%) |
| 45 to 54 Years | 4,624 (88.6%) | 4,050 (83.5%) |
| 55 to 64 Years | 3,975 (85.6%) | 3,874 (84.0%) |
| 65 to 74 Years | 3,184 (91.3%) | 3,863 (84.9%) |
| 75 Years and over | 2,518 (88.0%) | 3,296 (86.2%) |
| Total | 38,328 (81.5%) | 38,180 (80.3%) |
Income Below Poverty Among Married-Couple Families in Yakima
The poverty statistics for married-couple families in Yakima show that 8.4% or 1,222 of the total 14,488 families live below the poverty line. Families with 5 or more children have the highest poverty rate of 31.0%, comprising of 45 families. On the other hand, families with no children have the lowest poverty rate of 3.0%, which includes 232 families.
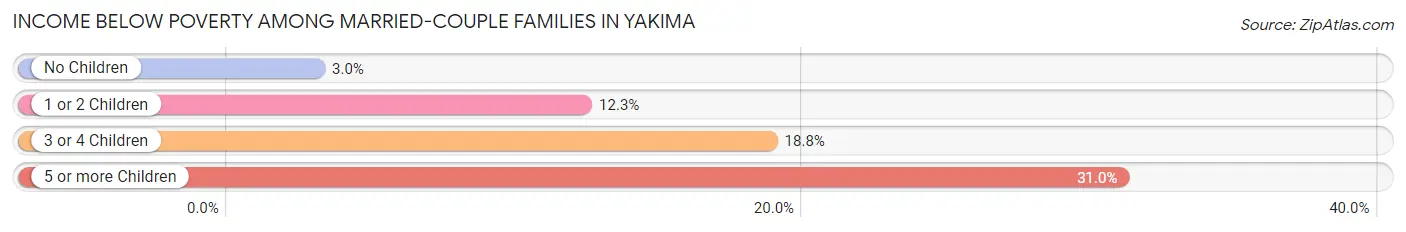
| Children | Above Poverty | Below Poverty |
| No Children | 7,421 (97.0%) | 232 (3.0%) |
| 1 or 2 Children | 4,232 (87.7%) | 595 (12.3%) |
| 3 or 4 Children | 1,513 (81.2%) | 350 (18.8%) |
| 5 or more Children | 100 (69.0%) | 45 (31.0%) |
| Total | 13,266 (91.6%) | 1,222 (8.4%) |
Income Below Poverty Among Single-Parent Households in Yakima
According to the poverty data in Yakima, 5.3% or 128 single-father households and 34.8% or 1,856 single-mother households are living below the poverty line. Among single-father households, those with 5 or more children have the highest poverty rate, with 9 households (100.0%) experiencing poverty. Likewise, among single-mother households, those with 3 or 4 children have the highest poverty rate, with 668 households (51.8%) falling below the poverty line.
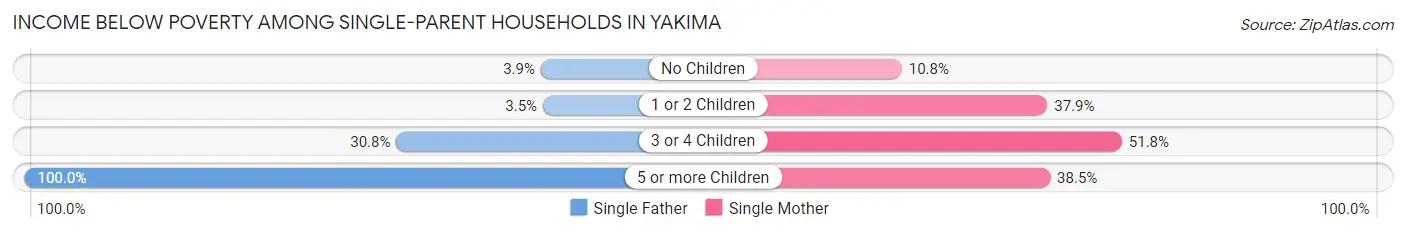
| Children | Single Father | Single Mother |
| No Children | 40 (3.8%) | 138 (10.8%) |
| 1 or 2 Children | 43 (3.5%) | 1,040 (37.9%) |
| 3 or 4 Children | 36 (30.8%) | 668 (51.8%) |
| 5 or more Children | 9 (100.0%) | 10 (38.5%) |
| Total | 128 (5.3%) | 1,856 (34.8%) |
Income Below Poverty Among Married-Couple vs Single-Parent Households in Yakima
The poverty data for Yakima shows that 1,222 of the married-couple family households (8.4%) and 1,984 of the single-parent households (25.6%) are living below the poverty level. Within the married-couple family households, those with 5 or more children have the highest poverty rate, with 45 households (31.0%) falling below the poverty line. Among the single-parent households, those with 5 or more children have the highest poverty rate, with 19 household (54.3%) living below poverty.
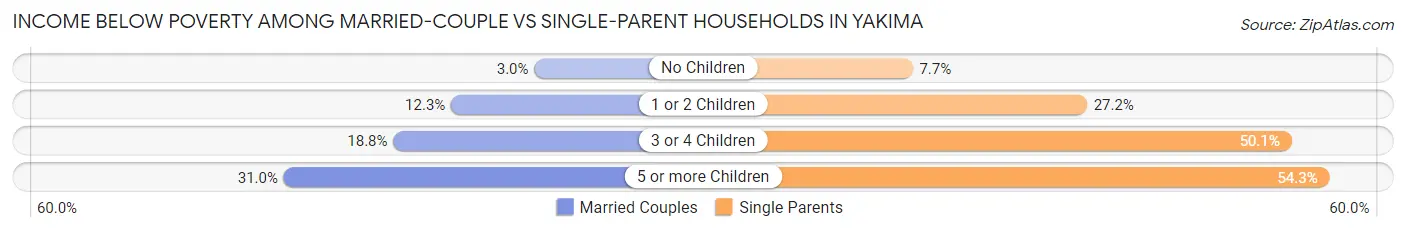
| Children | Married-Couple Families | Single-Parent Households |
| No Children | 232 (3.0%) | 178 (7.7%) |
| 1 or 2 Children | 595 (12.3%) | 1,083 (27.2%) |
| 3 or 4 Children | 350 (18.8%) | 704 (50.1%) |
| 5 or more Children | 45 (31.0%) | 19 (54.3%) |
| Total | 1,222 (8.4%) | 1,984 (25.6%) |
Race in Yakima
The most populous races in Yakima are White / Caucasian (56,947 | 58.9%), Hispanic or Latino (45,586 | 47.1%), and Some other Race (19,099 | 19.7%).
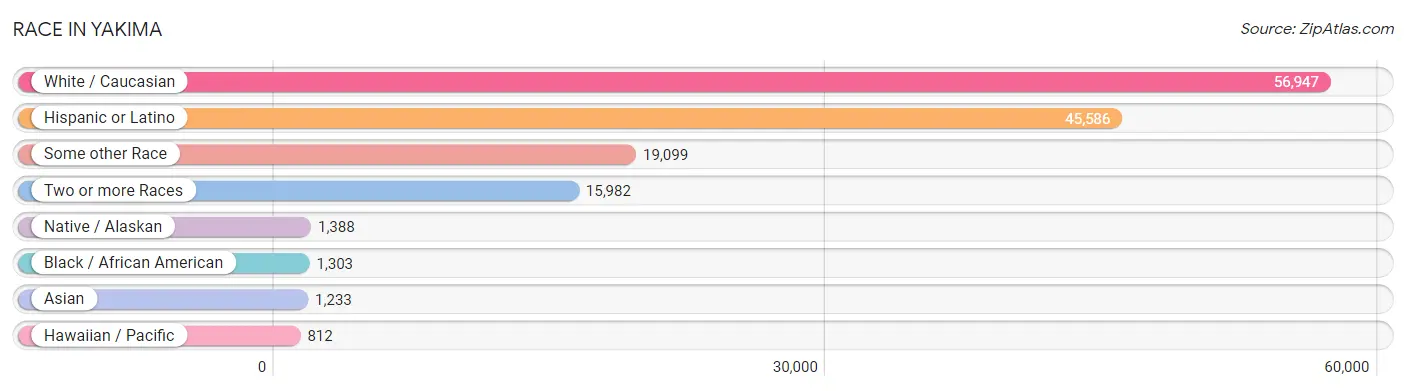
| Race | # Population | % Population |
| Asian | 1,233 | 1.3% |
| Black / African American | 1,303 | 1.3% |
| Hawaiian / Pacific | 812 | 0.8% |
| Hispanic or Latino | 45,586 | 47.1% |
| Native / Alaskan | 1,388 | 1.4% |
| White / Caucasian | 56,947 | 58.9% |
| Two or more Races | 15,982 | 16.5% |
| Some other Race | 19,099 | 19.7% |
| Total | 96,764 | 100.0% |
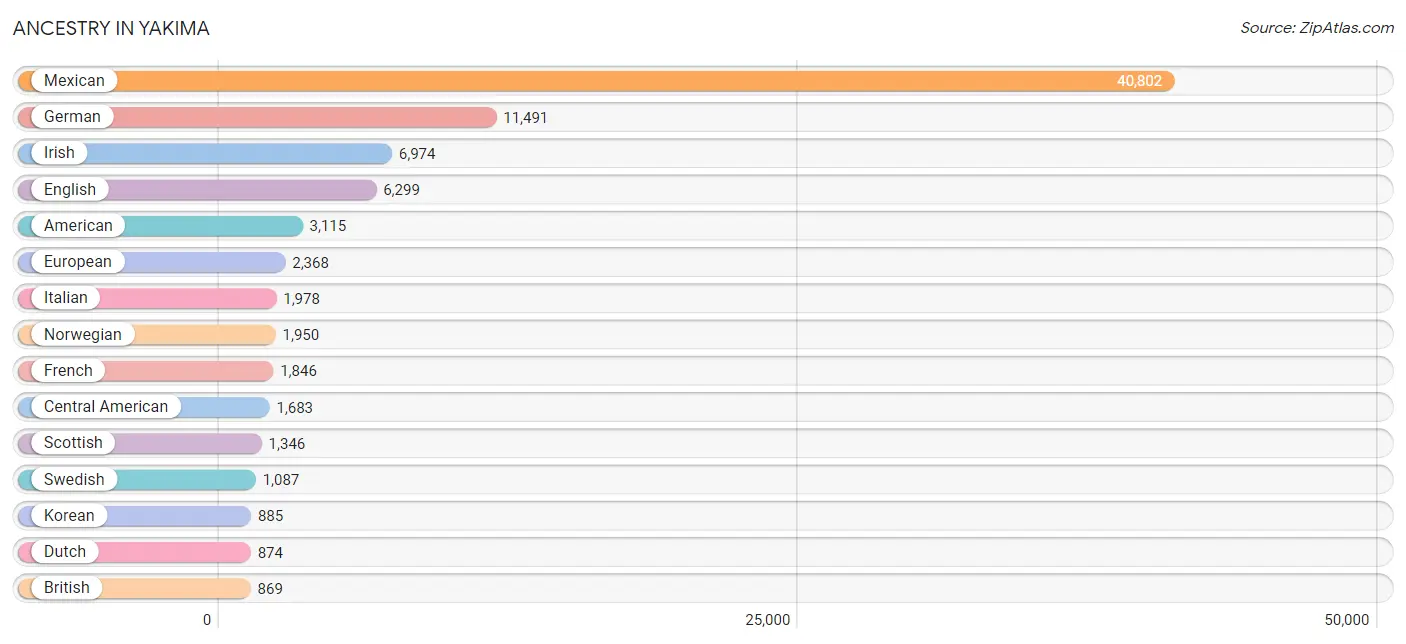
Ancestry in Yakima
The most populous ancestries reported in Yakima are Mexican (40,802 | 42.2%), German (11,491 | 11.9%), Irish (6,974 | 7.2%), English (6,299 | 6.5%), and American (3,115 | 3.2%), together accounting for 71.0% of all Yakima residents.
| Ancestry | # Population | % Population |
| African | 490 | 0.5% |
| Alaska Native | 20 | 0.0% |
| Alaskan Athabascan | 87 | 0.1% |
| American | 3,115 | 3.2% |
| Apache | 33 | 0.0% |
| Arab | 143 | 0.2% |
| Austrian | 62 | 0.1% |
| Basque | 29 | 0.0% |
| Belgian | 10 | 0.0% |
| Belizean | 24 | 0.0% |
| Bhutanese | 395 | 0.4% |
| Blackfeet | 363 | 0.4% |
| Bolivian | 121 | 0.1% |
| Brazilian | 20 | 0.0% |
| British | 869 | 0.9% |
| Bulgarian | 19 | 0.0% |
| Burmese | 253 | 0.3% |
| Canadian | 247 | 0.3% |
| Celtic | 24 | 0.0% |
| Central American | 1,683 | 1.7% |
| Central American Indian | 178 | 0.2% |
| Cherokee | 668 | 0.7% |
| Chickasaw | 68 | 0.1% |
| Chilean | 67 | 0.1% |
| Chippewa | 56 | 0.1% |
| Choctaw | 102 | 0.1% |
| Colombian | 24 | 0.0% |
| Colville | 82 | 0.1% |
| Creek | 34 | 0.0% |
| Croatian | 48 | 0.1% |
| Crow | 3 | 0.0% |
| Cuban | 135 | 0.1% |
| Czech | 120 | 0.1% |
| Czechoslovakian | 67 | 0.1% |
| Danish | 347 | 0.4% |
| Dutch | 874 | 0.9% |
| Eastern European | 158 | 0.2% |
| Egyptian | 36 | 0.0% |
| English | 6,299 | 6.5% |
| Ethiopian | 7 | 0.0% |
| European | 2,368 | 2.5% |
| Fijian | 42 | 0.0% |
| Finnish | 495 | 0.5% |
| French | 1,846 | 1.9% |
| French Canadian | 577 | 0.6% |
| German | 11,491 | 11.9% |
| German Russian | 6 | 0.0% |
| Ghanaian | 5 | 0.0% |
| Greek | 196 | 0.2% |
| Guamanian / Chamorro | 103 | 0.1% |
| Guatemalan | 331 | 0.3% |
| Honduran | 455 | 0.5% |
| Hungarian | 197 | 0.2% |
| Indian (Asian) | 311 | 0.3% |
| Inupiat | 7 | 0.0% |
| Iranian | 11 | 0.0% |
| Irish | 6,974 | 7.2% |
| Iroquois | 18 | 0.0% |
| Israeli | 41 | 0.0% |
| Italian | 1,978 | 2.0% |
| Japanese | 5 | 0.0% |
| Korean | 885 | 0.9% |
| Lebanese | 48 | 0.1% |
| Maltese | 16 | 0.0% |
| Marshallese | 329 | 0.3% |
| Mexican | 40,802 | 42.2% |
| Mexican American Indian | 526 | 0.5% |
| Native Hawaiian | 381 | 0.4% |
| Navajo | 5 | 0.0% |
| Nicaraguan | 195 | 0.2% |
| Northern European | 74 | 0.1% |
| Norwegian | 1,950 | 2.0% |
| Paiute | 26 | 0.0% |
| Pakistani | 5 | 0.0% |
| Pennsylvania German | 7 | 0.0% |
| Peruvian | 13 | 0.0% |
| Polish | 487 | 0.5% |
| Portuguese | 105 | 0.1% |
| Potawatomi | 196 | 0.2% |
| Pueblo | 23 | 0.0% |
| Puerto Rican | 391 | 0.4% |
| Puget Sound Salish | 300 | 0.3% |
| Romanian | 18 | 0.0% |
| Russian | 443 | 0.5% |
| Salvadoran | 702 | 0.7% |
| Samoan | 63 | 0.1% |
| Scandinavian | 467 | 0.5% |
| Scotch-Irish | 510 | 0.5% |
| Scottish | 1,346 | 1.4% |
| Sioux | 135 | 0.1% |
| South African | 3 | 0.0% |
| South American | 225 | 0.2% |
| Spaniard | 211 | 0.2% |
| Spanish | 498 | 0.5% |
| Sri Lankan | 176 | 0.2% |
| Subsaharan African | 528 | 0.5% |
| Swedish | 1,087 | 1.1% |
| Swiss | 212 | 0.2% |
| Thai | 57 | 0.1% |
| Tlingit-Haida | 8 | 0.0% |
| Turkish | 24 | 0.0% |
| Ukrainian | 125 | 0.1% |
| Welsh | 320 | 0.3% |
| Yakama | 300 | 0.3% |
| Yup'ik | 16 | 0.0% | View All 105 Rows |
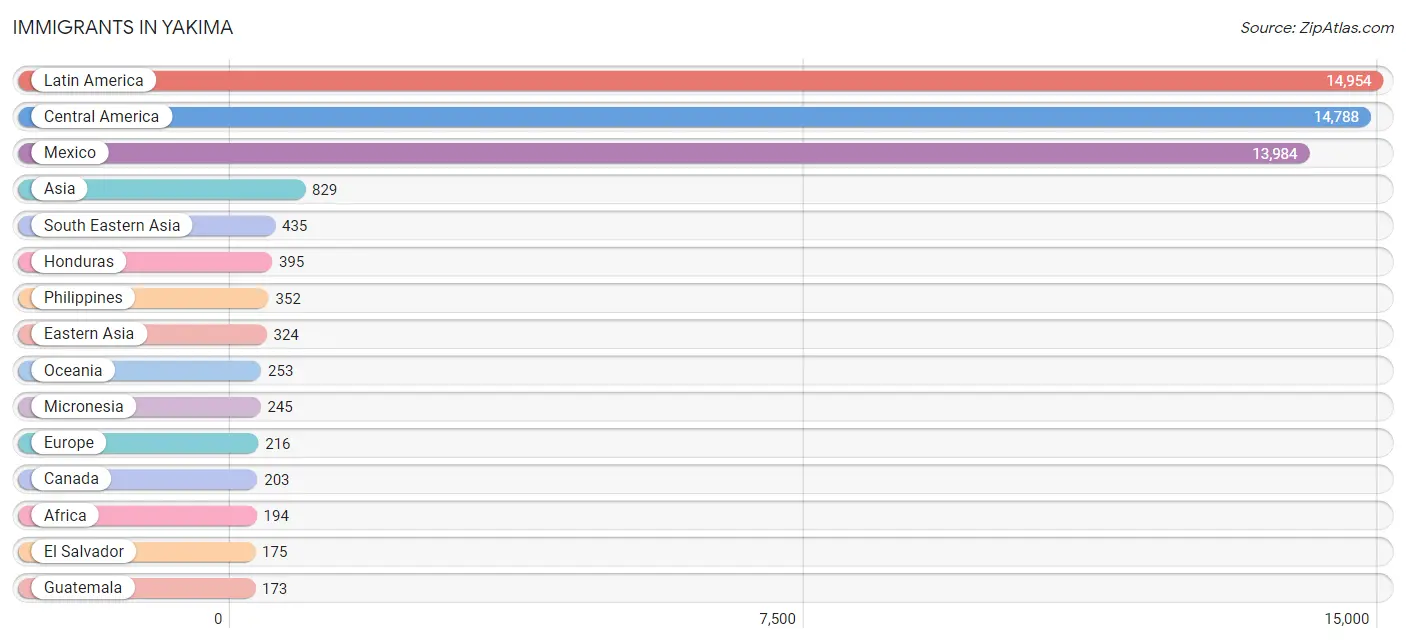
Immigrants in Yakima
The most numerous immigrant groups reported in Yakima came from Latin America (14,954 | 15.4%), Central America (14,788 | 15.3%), Mexico (13,984 | 14.4%), Asia (829 | 0.9%), and South Eastern Asia (435 | 0.4%), together accounting for 46.5% of all Yakima residents.
| Immigration Origin | # Population | % Population |
| Africa | 194 | 0.2% |
| Asia | 829 | 0.9% |
| Australia | 8 | 0.0% |
| Bolivia | 13 | 0.0% |
| Brazil | 20 | 0.0% |
| Canada | 203 | 0.2% |
| Caribbean | 114 | 0.1% |
| Central America | 14,788 | 15.3% |
| Chile | 6 | 0.0% |
| China | 142 | 0.2% |
| Costa Rica | 23 | 0.0% |
| Cuba | 114 | 0.1% |
| Czechoslovakia | 8 | 0.0% |
| Eastern Africa | 11 | 0.0% |
| Eastern Asia | 324 | 0.3% |
| Eastern Europe | 74 | 0.1% |
| El Salvador | 175 | 0.2% |
| England | 22 | 0.0% |
| Ethiopia | 7 | 0.0% |
| Europe | 216 | 0.2% |
| Germany | 71 | 0.1% |
| Guatemala | 173 | 0.2% |
| Honduras | 395 | 0.4% |
| Hong Kong | 15 | 0.0% |
| India | 18 | 0.0% |
| Iran | 11 | 0.0% |
| Ireland | 25 | 0.0% |
| Japan | 12 | 0.0% |
| Korea | 170 | 0.2% |
| Latin America | 14,954 | 15.4% |
| Mexico | 13,984 | 14.4% |
| Micronesia | 245 | 0.3% |
| Moldova | 10 | 0.0% |
| Netherlands | 10 | 0.0% |
| Nicaragua | 38 | 0.0% |
| Northern Africa | 7 | 0.0% |
| Northern Europe | 61 | 0.1% |
| Oceania | 253 | 0.3% |
| Peru | 13 | 0.0% |
| Philippines | 352 | 0.4% |
| Russia | 27 | 0.0% |
| South Africa | 13 | 0.0% |
| South America | 52 | 0.1% |
| South Central Asia | 29 | 0.0% |
| South Eastern Asia | 435 | 0.4% |
| Sudan | 7 | 0.0% |
| Sweden | 14 | 0.0% |
| Taiwan | 45 | 0.1% |
| Thailand | 5 | 0.0% |
| Turkey | 24 | 0.0% |
| Ukraine | 29 | 0.0% |
| Vietnam | 78 | 0.1% |
| Western Africa | 31 | 0.0% |
| Western Asia | 24 | 0.0% |
| Western Europe | 81 | 0.1% | View All 55 Rows |
Sex and Age in Yakima
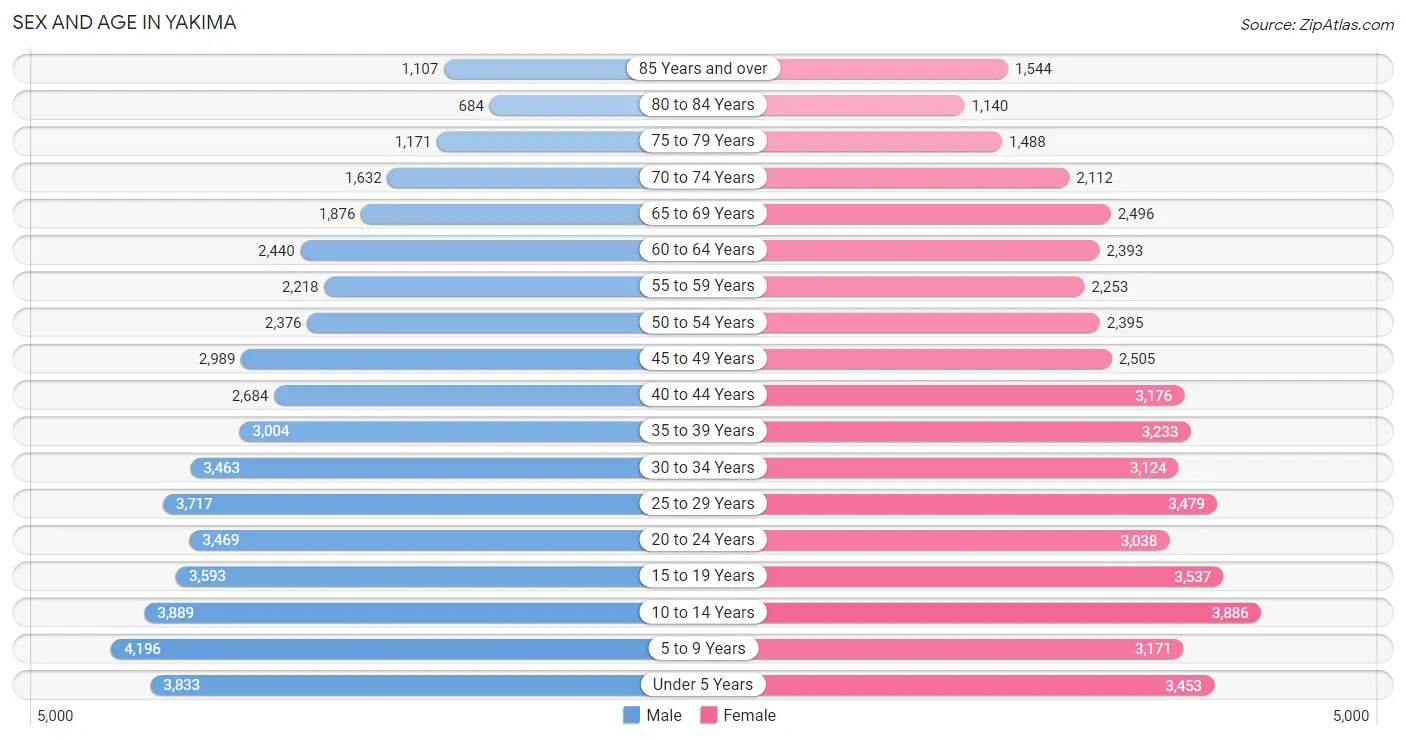
Sex and Age in Yakima
The most populous age groups in Yakima are 5 to 9 Years (4,196 | 8.7%) for men and 10 to 14 Years (3,886 | 8.0%) for women.
| Age Bracket | Male | Female |
| Under 5 Years | 3,833 (7.9%) | 3,453 (7.1%) |
| 5 to 9 Years | 4,196 (8.7%) | 3,171 (6.6%) |
| 10 to 14 Years | 3,889 (8.0%) | 3,886 (8.0%) |
| 15 to 19 Years | 3,593 (7.4%) | 3,537 (7.3%) |
| 20 to 24 Years | 3,469 (7.2%) | 3,038 (6.3%) |
| 25 to 29 Years | 3,717 (7.7%) | 3,479 (7.2%) |
| 30 to 34 Years | 3,463 (7.2%) | 3,124 (6.5%) |
| 35 to 39 Years | 3,004 (6.2%) | 3,233 (6.7%) |
| 40 to 44 Years | 2,684 (5.6%) | 3,176 (6.6%) |
| 45 to 49 Years | 2,989 (6.2%) | 2,505 (5.2%) |
| 50 to 54 Years | 2,376 (4.9%) | 2,395 (5.0%) |
| 55 to 59 Years | 2,218 (4.6%) | 2,253 (4.6%) |
| 60 to 64 Years | 2,440 (5.1%) | 2,393 (4.9%) |
| 65 to 69 Years | 1,876 (3.9%) | 2,496 (5.1%) |
| 70 to 74 Years | 1,632 (3.4%) | 2,112 (4.4%) |
| 75 to 79 Years | 1,171 (2.4%) | 1,488 (3.1%) |
| 80 to 84 Years | 684 (1.4%) | 1,140 (2.4%) |
| 85 Years and over | 1,107 (2.3%) | 1,544 (3.2%) |
| Total | 48,341 (100.0%) | 48,423 (100.0%) |
Families and Households in Yakima
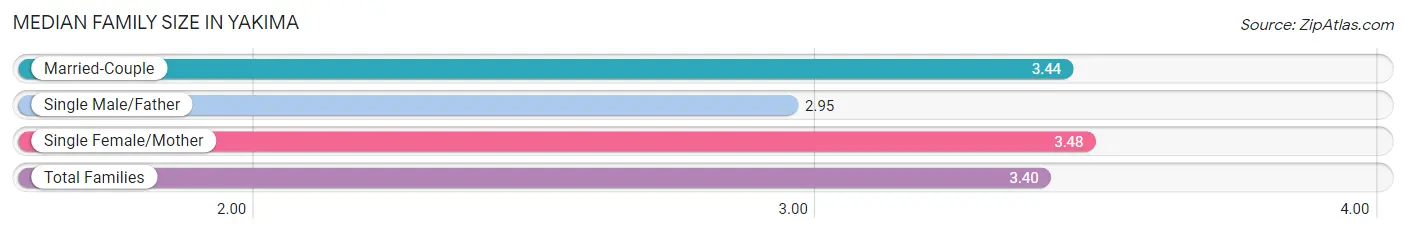
Median Family Size in Yakima
The median family size in Yakima is 3.40 persons per family, with single female/mother families (5,333 | 24.0%) accounting for the largest median family size of 3.48 persons per family. On the other hand, single male/father families (2,410 | 10.8%) represent the smallest median family size with 2.95 persons per family.
| Family Type | # Families | Family Size |
| Married-Couple | 14,488 (65.2%) | 3.44 |
| Single Male/Father | 2,410 (10.8%) | 2.95 |
| Single Female/Mother | 5,333 (24.0%) | 3.48 |
| Total Families | 22,231 (100.0%) | 3.40 |
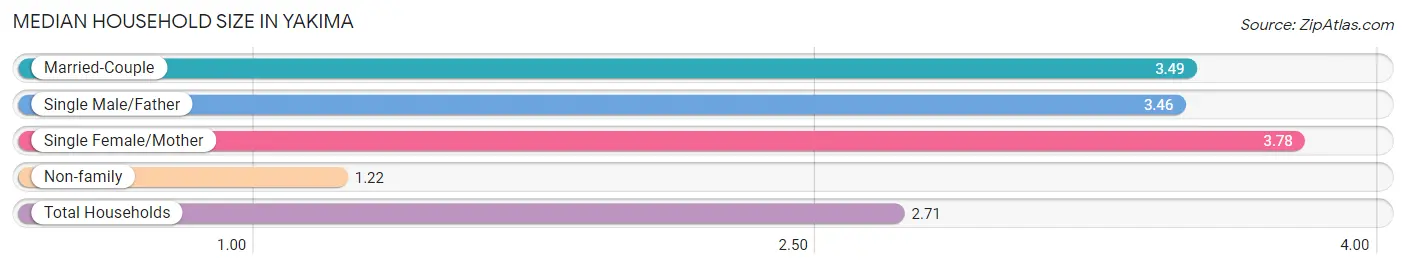
Median Household Size in Yakima
The median household size in Yakima is 2.71 persons per household, with single female/mother households (5,333 | 15.3%) accounting for the largest median household size of 3.78 persons per household. non-family households (12,599 | 36.2%) represent the smallest median household size with 1.22 persons per household.
| Household Type | # Households | Household Size |
| Married-Couple | 14,488 (41.6%) | 3.49 |
| Single Male/Father | 2,410 (6.9%) | 3.46 |
| Single Female/Mother | 5,333 (15.3%) | 3.78 |
| Non-family | 12,599 (36.2%) | 1.22 |
| Total Households | 34,830 (100.0%) | 2.71 |
Household Size by Marriage Status in Yakima
Out of a total of 34,830 households in Yakima, 22,231 (63.8%) are family households, while 12,599 (36.2%) are nonfamily households. The most numerous type of family households are 2-person households, comprising 8,409, and the most common type of nonfamily households are 1-person households, comprising 10,473.
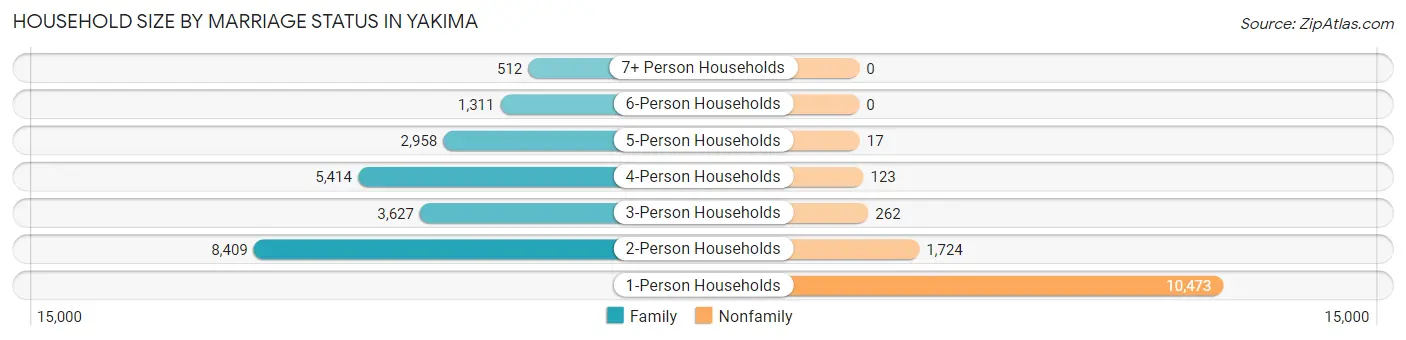
| Household Size | Family Households | Nonfamily Households |
| 1-Person Households | - | 10,473 (30.1%) |
| 2-Person Households | 8,409 (24.1%) | 1,724 (5.0%) |
| 3-Person Households | 3,627 (10.4%) | 262 (0.7%) |
| 4-Person Households | 5,414 (15.5%) | 123 (0.4%) |
| 5-Person Households | 2,958 (8.5%) | 17 (0.1%) |
| 6-Person Households | 1,311 (3.8%) | 0 (0.0%) |
| 7+ Person Households | 512 (1.5%) | 0 (0.0%) |
| Total | 22,231 (63.8%) | 12,599 (36.2%) |
Female Fertility in Yakima
Fertility by Age in Yakima
Average fertility rate in Yakima is 61.0 births per 1,000 women. Women in the age bracket of 20 to 34 years have the highest fertility rate with 105.0 births per 1,000 women. Women in the age bracket of 20 to 34 years acount for 73.6% of all women with births.
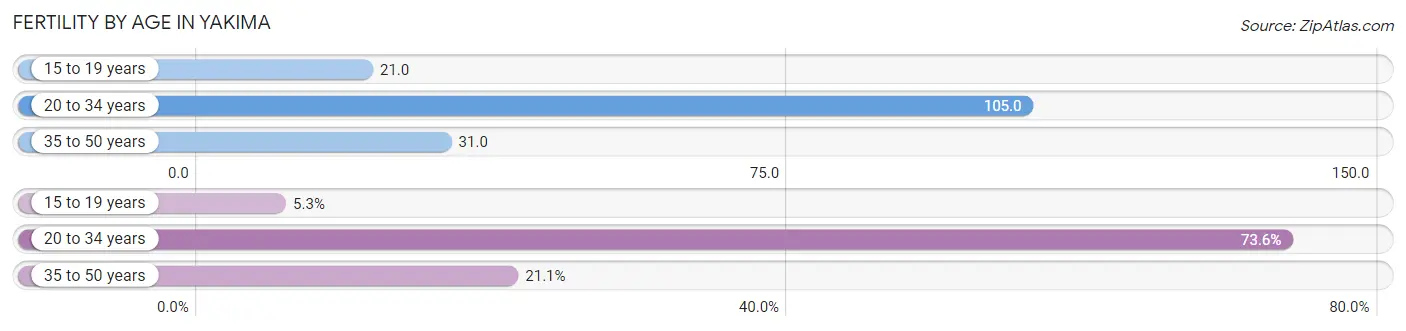
| Age Bracket | Women with Births | Births / 1,000 Women |
| 15 to 19 years | 73 (5.3%) | 21.0 |
| 20 to 34 years | 1,014 (73.6%) | 105.0 |
| 35 to 50 years | 290 (21.1%) | 31.0 |
| Total | 1,377 (100.0%) | 61.0 |
Fertility by Age by Marriage Status in Yakima
50.8% of women with births (1,377) in Yakima are married. The highest percentage of unmarried women with births falls into 15 to 19 years age bracket with 100.0% of them unmarried at the time of birth, while the lowest percentage of unmarried women with births belong to 35 to 50 years age bracket with 15.9% of them unmarried.
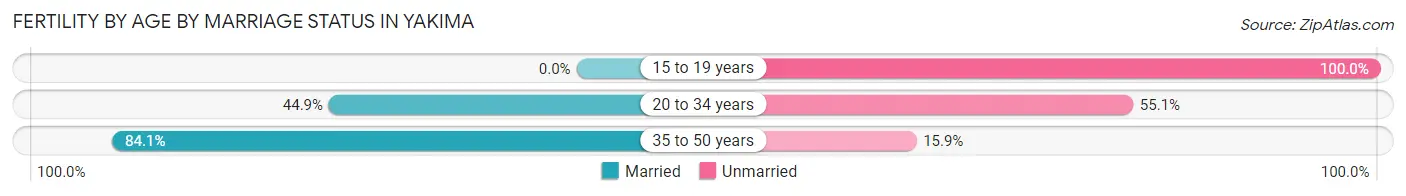
| Age Bracket | Married | Unmarried |
| 15 to 19 years | 0 (0.0%) | 73 (100.0%) |
| 20 to 34 years | 455 (44.9%) | 559 (55.1%) |
| 35 to 50 years | 244 (84.1%) | 46 (15.9%) |
| Total | 700 (50.8%) | 677 (49.2%) |
Fertility by Education in Yakima
Average fertility rate in Yakima is 61.0 births per 1,000 women. Women with the education attainment of high school diploma have the highest fertility rate of 99.0 births per 1,000 women, while women with the education attainment of graduate degree have the lowest fertility at 37.0 births per 1,000 women. Women with the education attainment of high school diploma represent 38.7% of all women with births.
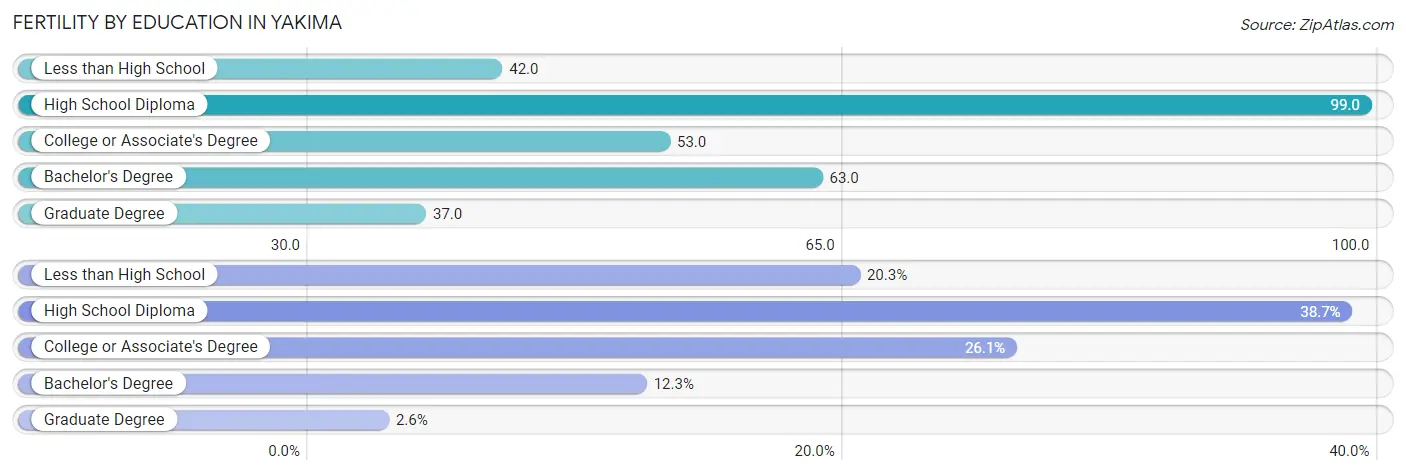
| Educational Attainment | Women with Births | Births / 1,000 Women |
| Less than High School | 279 (20.3%) | 42.0 |
| High School Diploma | 533 (38.7%) | 99.0 |
| College or Associate's Degree | 360 (26.1%) | 53.0 |
| Bachelor's Degree | 169 (12.3%) | 63.0 |
| Graduate Degree | 36 (2.6%) | 37.0 |
| Total | 1,377 (100.0%) | 61.0 |
Fertility by Education by Marriage Status in Yakima
49.2% of women with births in Yakima are unmarried. Women with the educational attainment of graduate degree are most likely to be married with 100.0% of them married at childbirth, while women with the educational attainment of bachelor's degree are least likely to be married with 71.6% of them unmarried at childbirth.
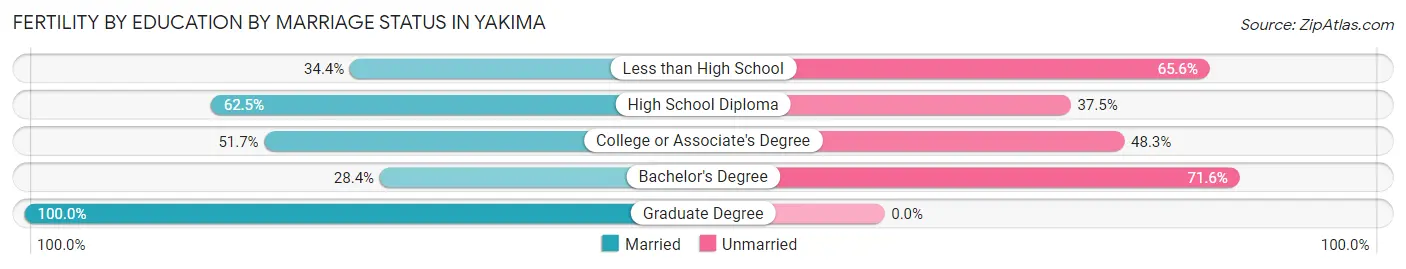
| Educational Attainment | Married | Unmarried |
| Less than High School | 96 (34.4%) | 183 (65.6%) |
| High School Diploma | 333 (62.5%) | 200 (37.5%) |
| College or Associate's Degree | 186 (51.7%) | 174 (48.3%) |
| Bachelor's Degree | 48 (28.4%) | 121 (71.6%) |
| Graduate Degree | 36 (100.0%) | 0 (0.0%) |
| Total | 700 (50.8%) | 677 (49.2%) |
Employment Characteristics in Yakima
Employment by Class of Employer in Yakima
Among the 38,284 employed individuals in Yakima, private company employees (26,952 | 70.4%), not-for-profit organizations (3,296 | 8.6%), and local government employees (2,686 | 7.0%) make up the most common classes of employment.
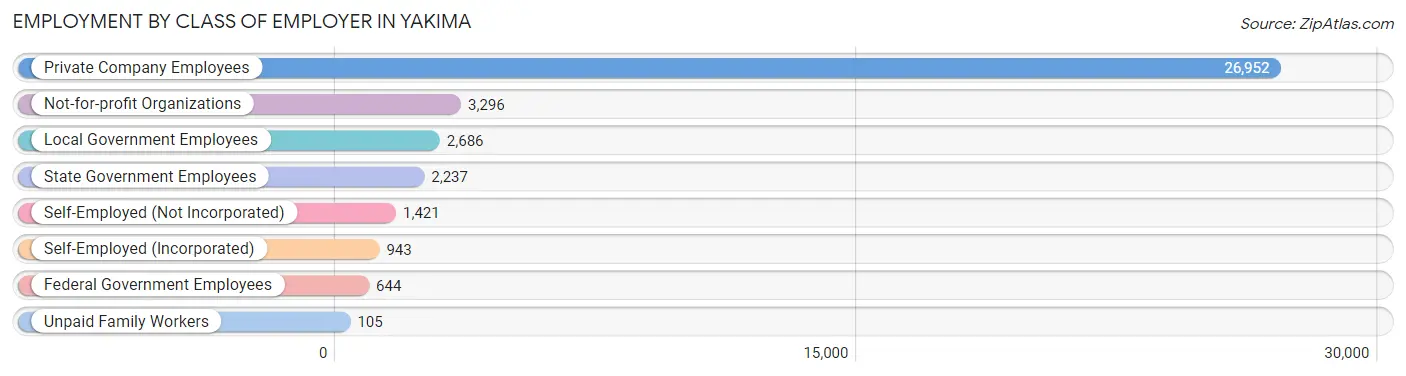
| Employer Class | # Employees | % Employees |
| Private Company Employees | 26,952 | 70.4% |
| Self-Employed (Incorporated) | 943 | 2.5% |
| Self-Employed (Not Incorporated) | 1,421 | 3.7% |
| Not-for-profit Organizations | 3,296 | 8.6% |
| Local Government Employees | 2,686 | 7.0% |
| State Government Employees | 2,237 | 5.8% |
| Federal Government Employees | 644 | 1.7% |
| Unpaid Family Workers | 105 | 0.3% |
| Total | 38,284 | 100.0% |
Employment Status by Age in Yakima
According to the labor force statistics for Yakima, out of the total population over 16 years of age (72,506), 58.9% or 42,706 individuals are in the labor force, with 8.1% or 3,459 of them unemployed. The age group with the highest labor force participation rate is 25 to 29 years, with 83.7% or 6,023 individuals in the labor force. Within the labor force, the 16 to 19 years age range has the highest percentage of unemployed individuals, with 28.3% or 637 of them being unemployed.
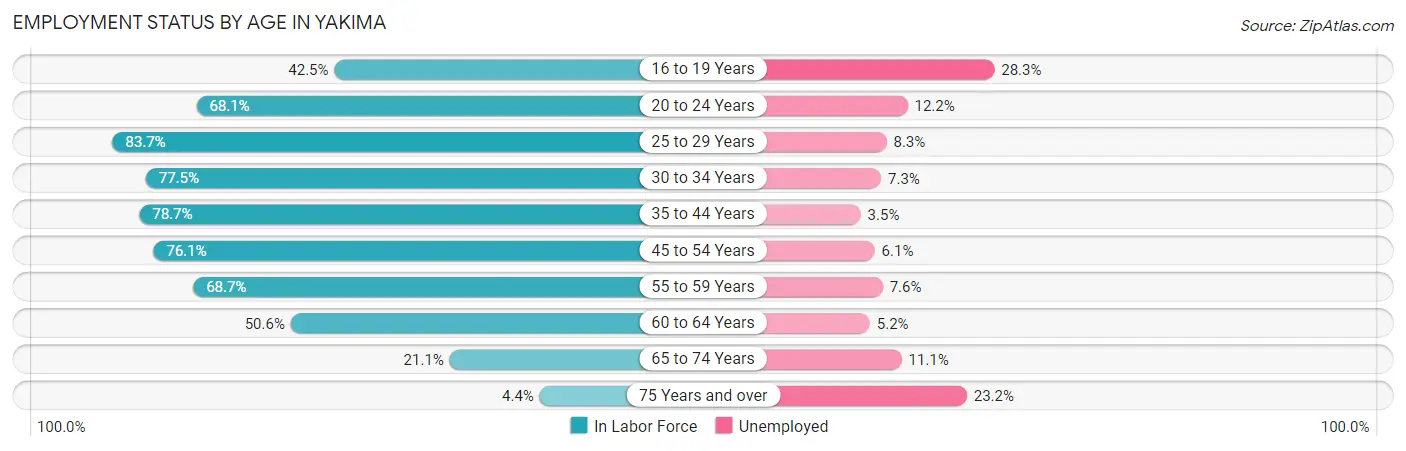
| Age Bracket | In Labor Force | Unemployed |
| 16 to 19 Years | 2,252 (42.5%) | 637 (28.3%) |
| 20 to 24 Years | 4,431 (68.1%) | 541 (12.2%) |
| 25 to 29 Years | 6,023 (83.7%) | 500 (8.3%) |
| 30 to 34 Years | 5,105 (77.5%) | 373 (7.3%) |
| 35 to 44 Years | 9,520 (78.7%) | 333 (3.5%) |
| 45 to 54 Years | 7,812 (76.1%) | 477 (6.1%) |
| 55 to 59 Years | 3,072 (68.7%) | 233 (7.6%) |
| 60 to 64 Years | 2,445 (50.6%) | 127 (5.2%) |
| 65 to 74 Years | 1,712 (21.1%) | 190 (11.1%) |
| 75 Years and over | 314 (4.4%) | 73 (23.2%) |
| Total | 42,706 (58.9%) | 3,459 (8.1%) |
Employment Status by Educational Attainment in Yakima
According to labor force statistics for Yakima, 74.8% of individuals (33,996) out of the total population between 25 and 64 years of age (45,449) are in the labor force, with 6.0% or 2,040 of them being unemployed. The group with the highest labor force participation rate are those with the educational attainment of bachelor's degree or higher, with 89.2% or 6,933 individuals in the labor force. Within the labor force, individuals with less than high school education have the highest percentage of unemployment, with 8.5% or 612 of them being unemployed.
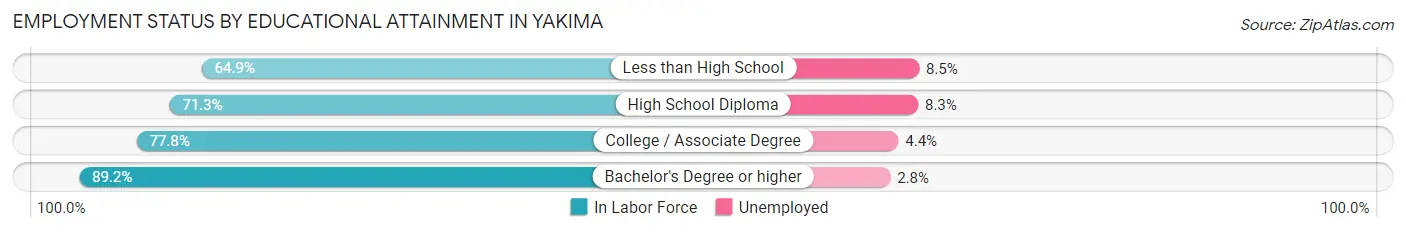
| Educational Attainment | In Labor Force | Unemployed |
| Less than High School | 7,195 (64.9%) | 942 (8.5%) |
| High School Diploma | 9,183 (71.3%) | 1,069 (8.3%) |
| College / Associate Degree | 10,667 (77.8%) | 603 (4.4%) |
| Bachelor's Degree or higher | 6,933 (89.2%) | 218 (2.8%) |
| Total | 33,996 (74.8%) | 2,727 (6.0%) |
Employment Occupations by Sex in Yakima
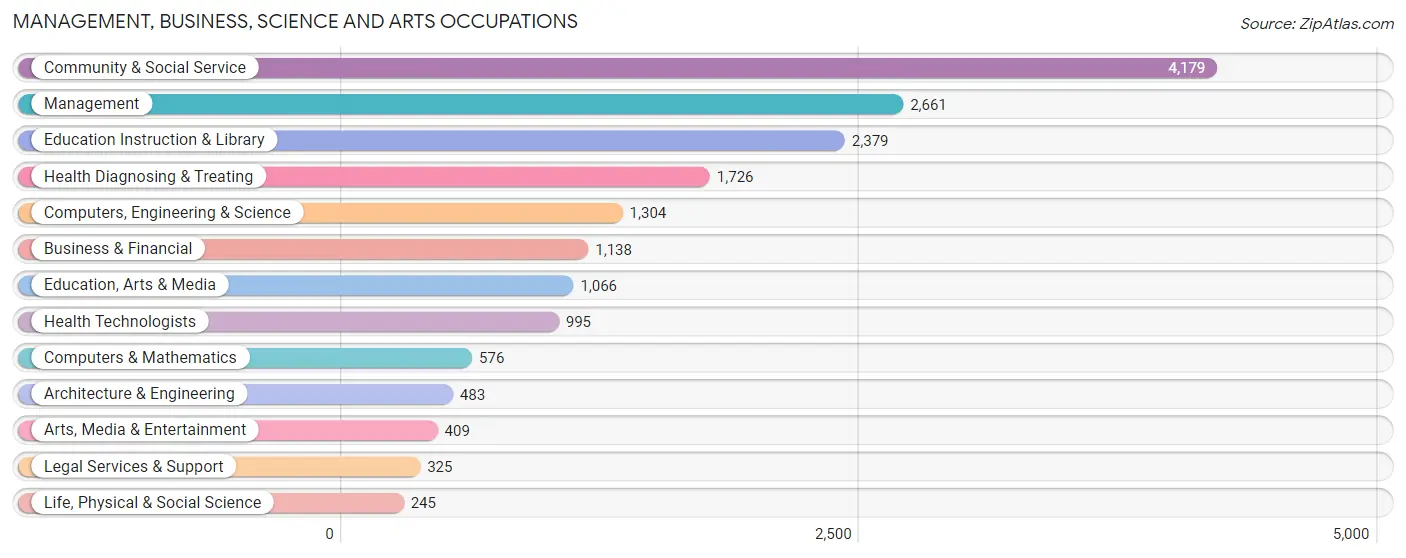
Management, Business, Science and Arts Occupations
The most common Management, Business, Science and Arts occupations in Yakima are Community & Social Service (4,179 | 10.7%), Management (2,661 | 6.8%), Education Instruction & Library (2,379 | 6.1%), Health Diagnosing & Treating (1,726 | 4.4%), and Computers, Engineering & Science (1,304 | 3.3%).
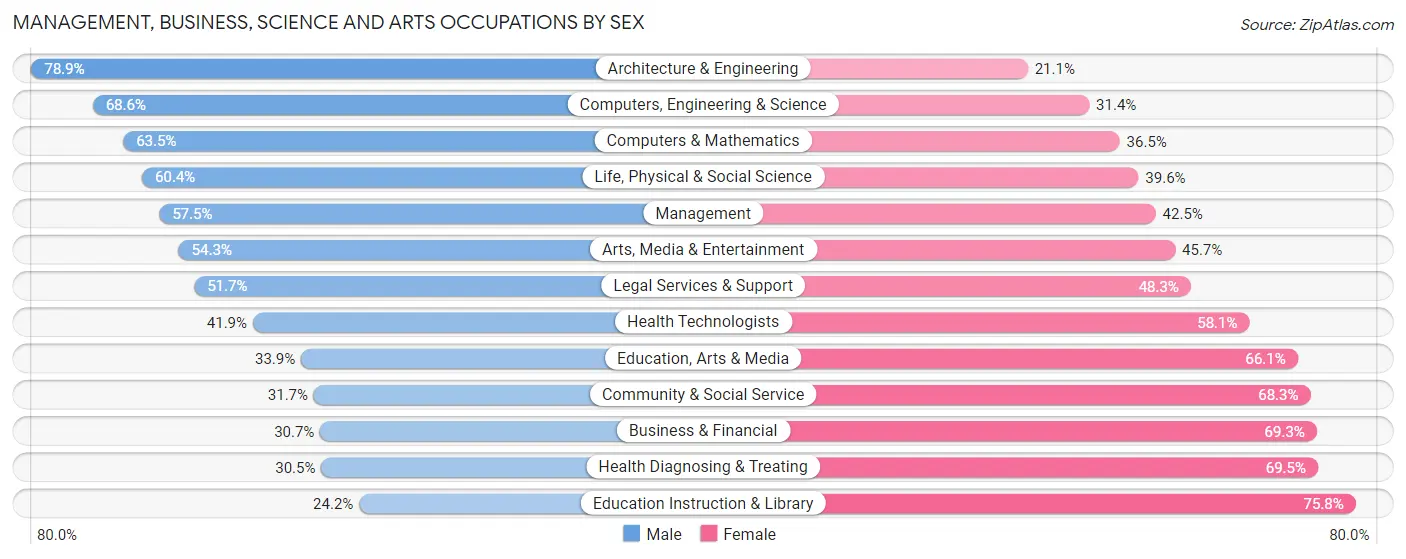
Management, Business, Science and Arts Occupations by Sex
Within the Management, Business, Science and Arts occupations in Yakima, the most male-oriented occupations are Architecture & Engineering (78.9%), Computers, Engineering & Science (68.6%), and Computers & Mathematics (63.5%), while the most female-oriented occupations are Education Instruction & Library (75.8%), Health Diagnosing & Treating (69.5%), and Business & Financial (69.3%).
| Occupation | Male | Female |
| Management | 1,531 (57.5%) | 1,130 (42.5%) |
| Business & Financial | 349 (30.7%) | 789 (69.3%) |
| Computers, Engineering & Science | 895 (68.6%) | 409 (31.4%) |
| Computers & Mathematics | 366 (63.5%) | 210 (36.5%) |
| Architecture & Engineering | 381 (78.9%) | 102 (21.1%) |
| Life, Physical & Social Science | 148 (60.4%) | 97 (39.6%) |
| Community & Social Service | 1,326 (31.7%) | 2,853 (68.3%) |
| Education, Arts & Media | 361 (33.9%) | 705 (66.1%) |
| Legal Services & Support | 168 (51.7%) | 157 (48.3%) |
| Education Instruction & Library | 575 (24.2%) | 1,804 (75.8%) |
| Arts, Media & Entertainment | 222 (54.3%) | 187 (45.7%) |
| Health Diagnosing & Treating | 526 (30.5%) | 1,200 (69.5%) |
| Health Technologists | 417 (41.9%) | 578 (58.1%) |
| Total (Category) | 4,627 (42.0%) | 6,381 (58.0%) |
| Total (Overall) | 20,769 (53.0%) | 18,409 (47.0%) |
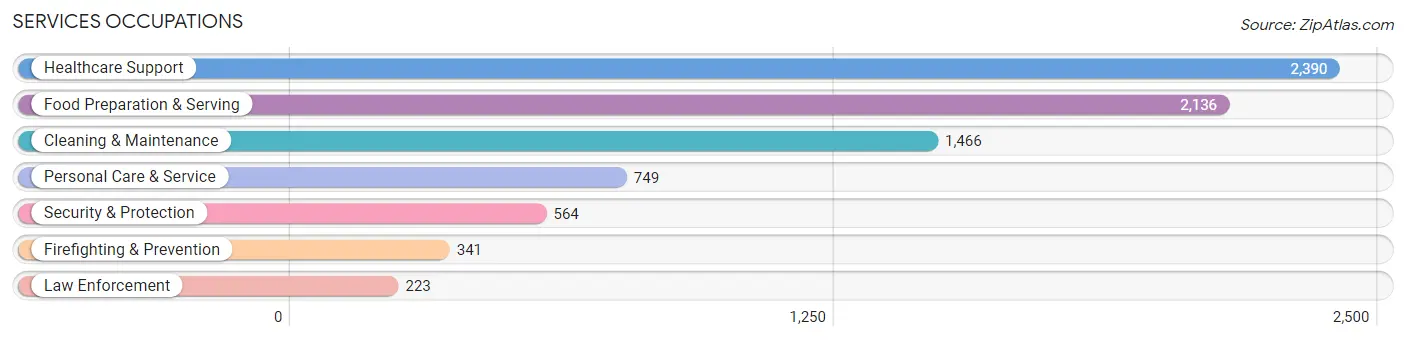
Services Occupations
The most common Services occupations in Yakima are Healthcare Support (2,390 | 6.1%), Food Preparation & Serving (2,136 | 5.4%), Cleaning & Maintenance (1,466 | 3.7%), Personal Care & Service (749 | 1.9%), and Security & Protection (564 | 1.4%).
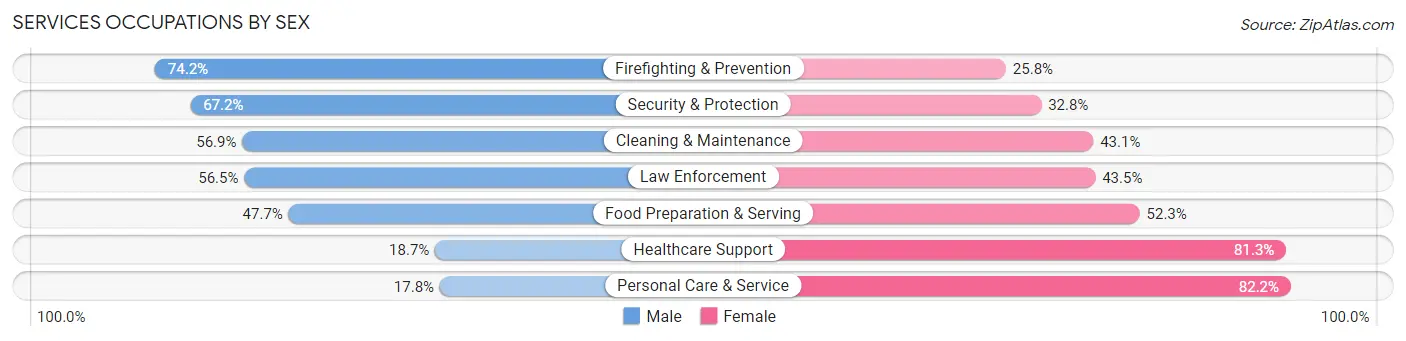
Services Occupations by Sex
Within the Services occupations in Yakima, the most male-oriented occupations are Firefighting & Prevention (74.2%), Security & Protection (67.2%), and Cleaning & Maintenance (56.9%), while the most female-oriented occupations are Personal Care & Service (82.2%), Healthcare Support (81.3%), and Food Preparation & Serving (52.3%).
| Occupation | Male | Female |
| Healthcare Support | 447 (18.7%) | 1,943 (81.3%) |
| Security & Protection | 379 (67.2%) | 185 (32.8%) |
| Firefighting & Prevention | 253 (74.2%) | 88 (25.8%) |
| Law Enforcement | 126 (56.5%) | 97 (43.5%) |
| Food Preparation & Serving | 1,019 (47.7%) | 1,117 (52.3%) |
| Cleaning & Maintenance | 834 (56.9%) | 632 (43.1%) |
| Personal Care & Service | 133 (17.8%) | 616 (82.2%) |
| Total (Category) | 2,812 (38.5%) | 4,493 (61.5%) |
| Total (Overall) | 20,769 (53.0%) | 18,409 (47.0%) |
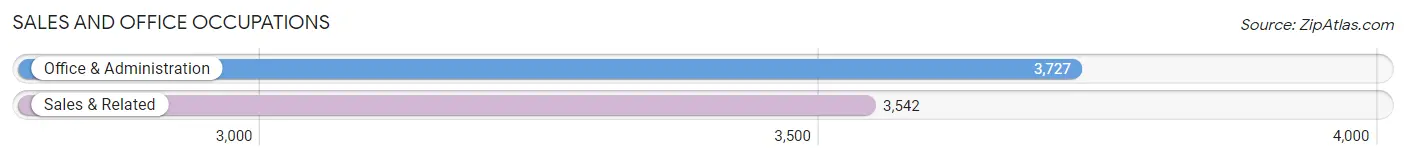
Sales and Office Occupations
The most common Sales and Office occupations in Yakima are Office & Administration (3,727 | 9.5%), and Sales & Related (3,542 | 9.0%).
Sales and Office Occupations by Sex
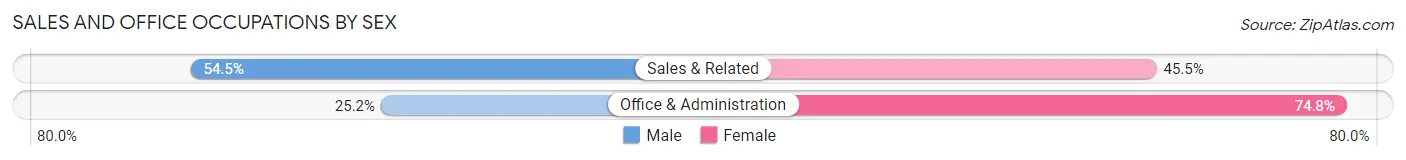
| Occupation | Male | Female |
| Sales & Related | 1,929 (54.5%) | 1,613 (45.5%) |
| Office & Administration | 939 (25.2%) | 2,788 (74.8%) |
| Total (Category) | 2,868 (39.5%) | 4,401 (60.5%) |
| Total (Overall) | 20,769 (53.0%) | 18,409 (47.0%) |
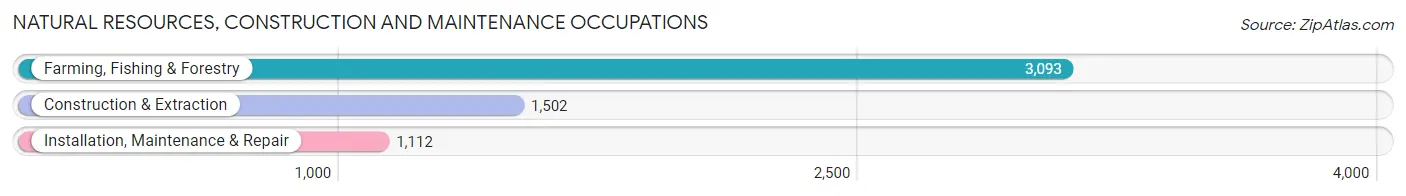
Natural Resources, Construction and Maintenance Occupations
The most common Natural Resources, Construction and Maintenance occupations in Yakima are Farming, Fishing & Forestry (3,093 | 7.9%), Construction & Extraction (1,502 | 3.8%), and Installation, Maintenance & Repair (1,112 | 2.8%).
Natural Resources, Construction and Maintenance Occupations by Sex
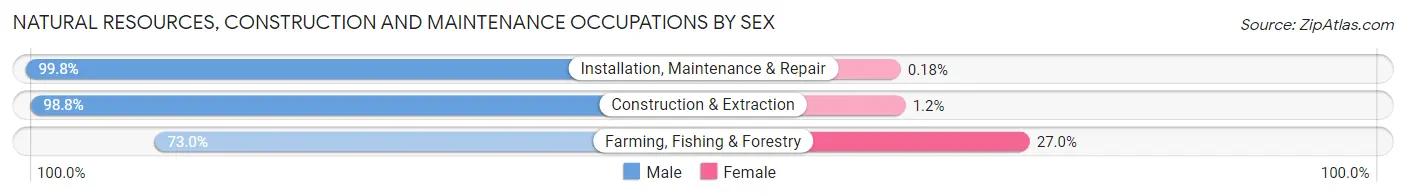
| Occupation | Male | Female |
| Farming, Fishing & Forestry | 2,257 (73.0%) | 836 (27.0%) |
| Construction & Extraction | 1,484 (98.8%) | 18 (1.2%) |
| Installation, Maintenance & Repair | 1,110 (99.8%) | 2 (0.2%) |
| Total (Category) | 4,851 (85.0%) | 856 (15.0%) |
| Total (Overall) | 20,769 (53.0%) | 18,409 (47.0%) |
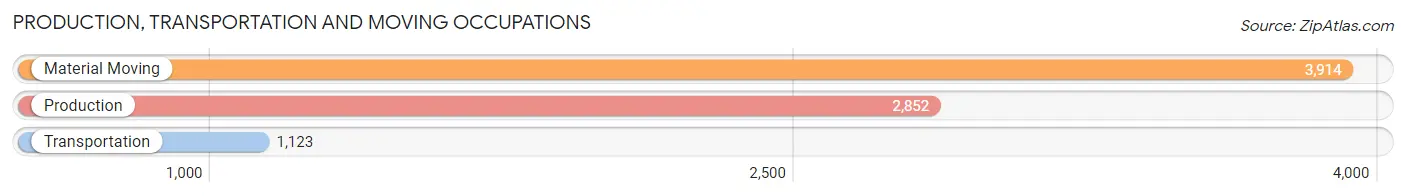
Production, Transportation and Moving Occupations
The most common Production, Transportation and Moving occupations in Yakima are Material Moving (3,914 | 10.0%), Production (2,852 | 7.3%), and Transportation (1,123 | 2.9%).
Production, Transportation and Moving Occupations by Sex
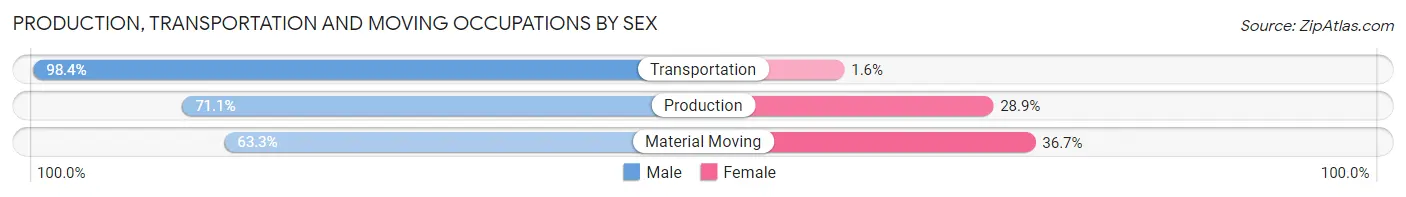
| Occupation | Male | Female |
| Production | 2,027 (71.1%) | 825 (28.9%) |
| Transportation | 1,105 (98.4%) | 18 (1.6%) |
| Material Moving | 2,479 (63.3%) | 1,435 (36.7%) |
| Total (Category) | 5,611 (71.1%) | 2,278 (28.9%) |
| Total (Overall) | 20,769 (53.0%) | 18,409 (47.0%) |
Employment Industries by Sex in Yakima
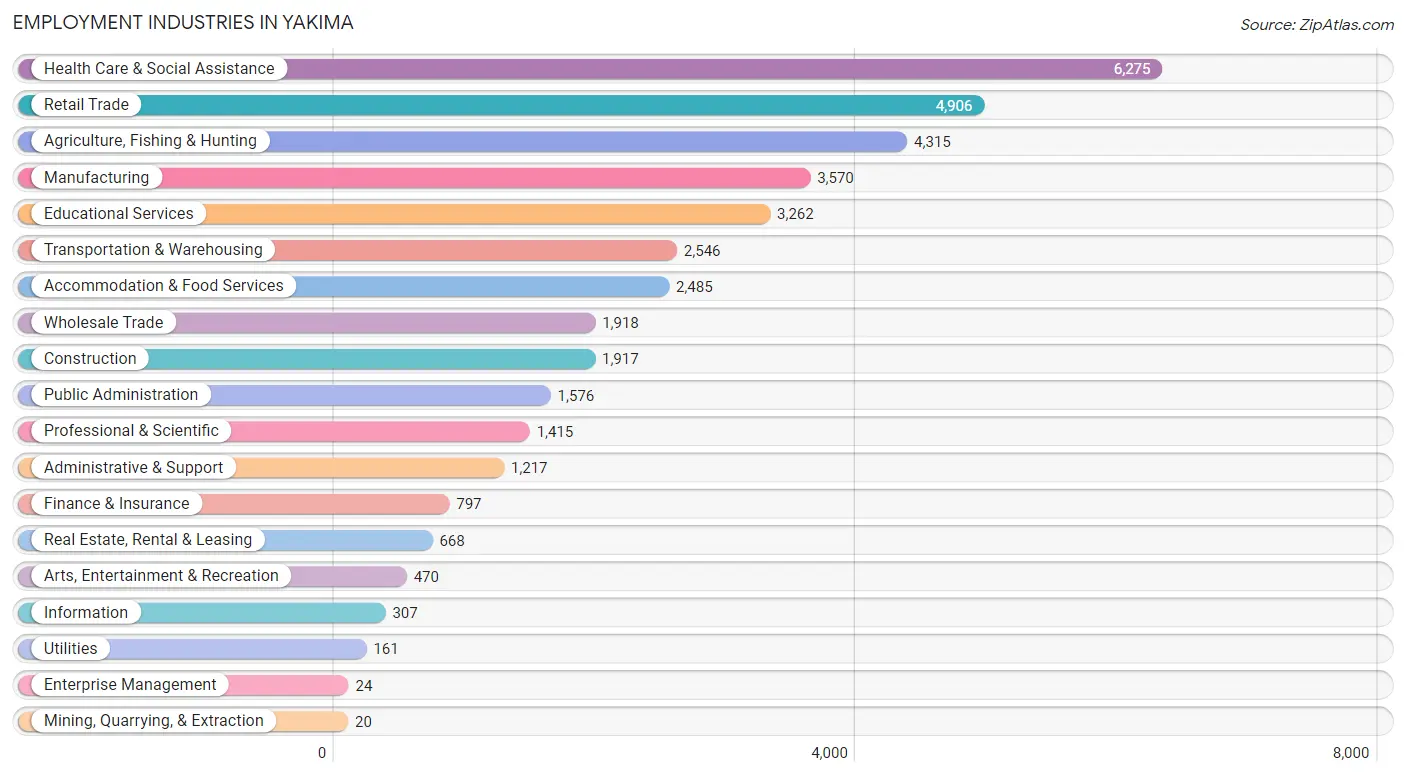
Employment Industries in Yakima
The major employment industries in Yakima include Health Care & Social Assistance (6,275 | 16.0%), Retail Trade (4,906 | 12.5%), Agriculture, Fishing & Hunting (4,315 | 11.0%), Manufacturing (3,570 | 9.1%), and Educational Services (3,262 | 8.3%).
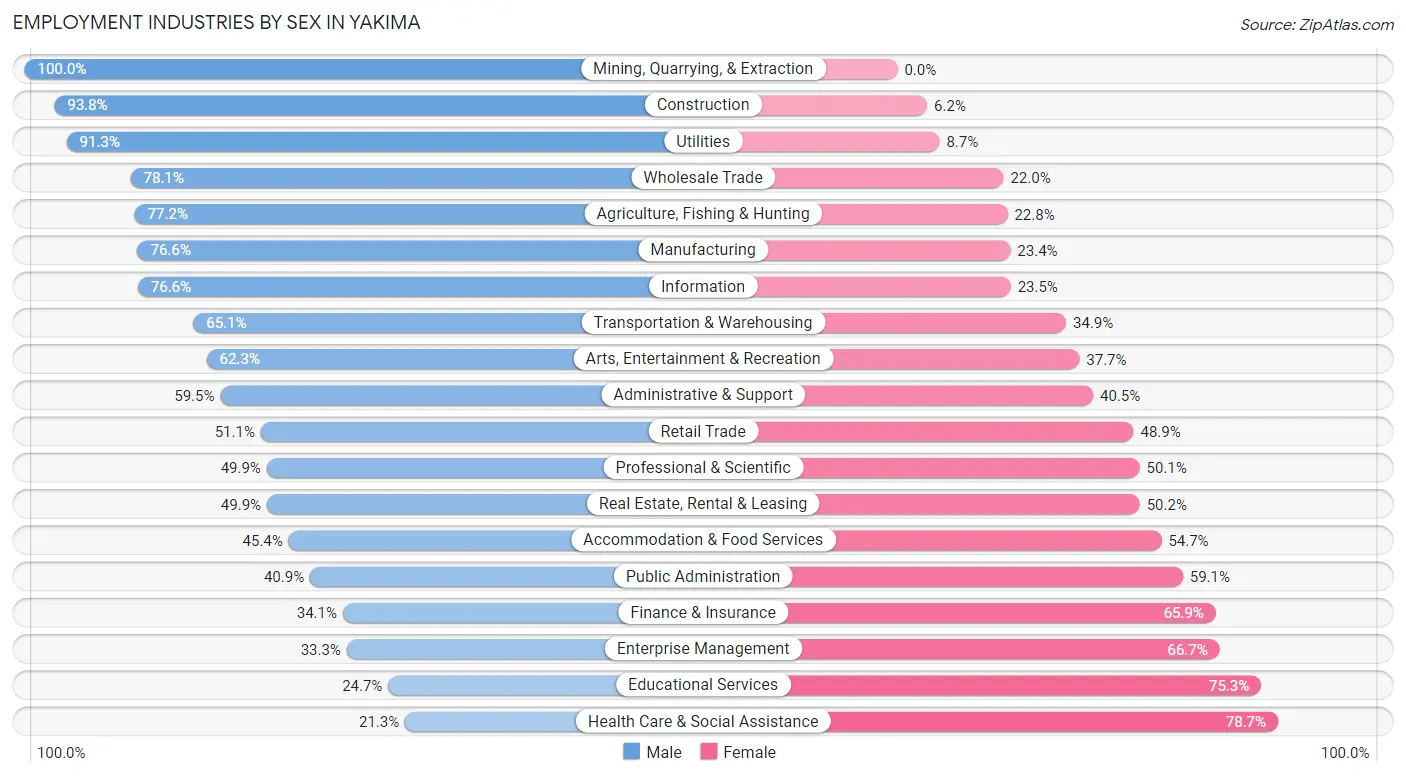
Employment Industries by Sex in Yakima
The Yakima industries that see more men than women are Mining, Quarrying, & Extraction (100.0%), Construction (93.8%), and Utilities (91.3%), whereas the industries that tend to have a higher number of women are Health Care & Social Assistance (78.7%), Educational Services (75.3%), and Enterprise Management (66.7%).
| Industry | Male | Female |
| Agriculture, Fishing & Hunting | 3,332 (77.2%) | 983 (22.8%) |
| Mining, Quarrying, & Extraction | 20 (100.0%) | 0 (0.0%) |
| Construction | 1,799 (93.8%) | 118 (6.2%) |
| Manufacturing | 2,735 (76.6%) | 835 (23.4%) |
| Wholesale Trade | 1,497 (78.0%) | 421 (22.0%) |
| Retail Trade | 2,508 (51.1%) | 2,398 (48.9%) |
| Transportation & Warehousing | 1,657 (65.1%) | 889 (34.9%) |
| Utilities | 147 (91.3%) | 14 (8.7%) |
| Information | 235 (76.5%) | 72 (23.4%) |
| Finance & Insurance | 272 (34.1%) | 525 (65.9%) |
| Real Estate, Rental & Leasing | 333 (49.8%) | 335 (50.1%) |
| Professional & Scientific | 706 (49.9%) | 709 (50.1%) |
| Enterprise Management | 8 (33.3%) | 16 (66.7%) |
| Administrative & Support | 724 (59.5%) | 493 (40.5%) |
| Educational Services | 807 (24.7%) | 2,455 (75.3%) |
| Health Care & Social Assistance | 1,334 (21.3%) | 4,941 (78.7%) |
| Arts, Entertainment & Recreation | 293 (62.3%) | 177 (37.7%) |
| Accommodation & Food Services | 1,127 (45.4%) | 1,358 (54.6%) |
| Public Administration | 645 (40.9%) | 931 (59.1%) |
| Total | 20,769 (53.0%) | 18,409 (47.0%) |
Education in Yakima
School Enrollment in Yakima
The most common levels of schooling among the 24,945 students in Yakima are middle school (6,232 | 25.0%), elementary school (5,892 | 23.6%), and high school (5,789 | 23.2%).
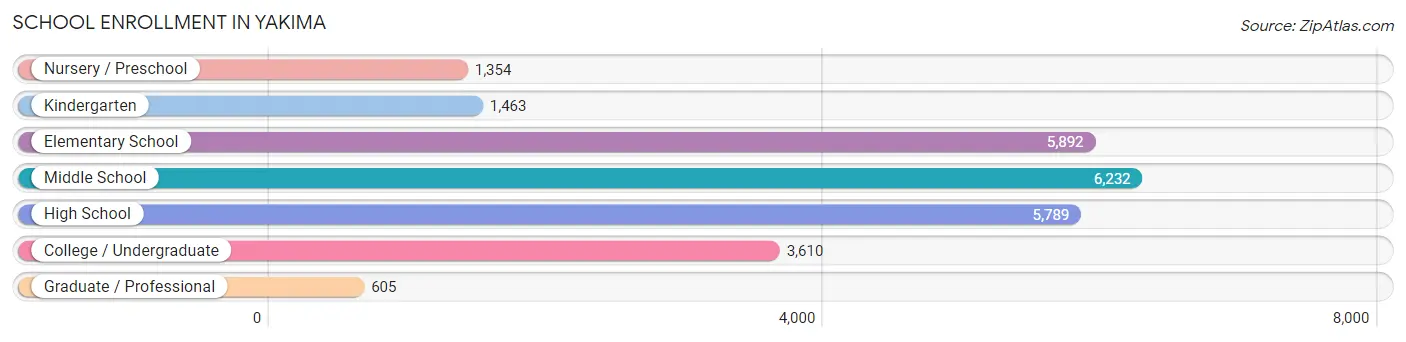
| School Level | # Students | % Students |
| Nursery / Preschool | 1,354 | 5.4% |
| Kindergarten | 1,463 | 5.9% |
| Elementary School | 5,892 | 23.6% |
| Middle School | 6,232 | 25.0% |
| High School | 5,789 | 23.2% |
| College / Undergraduate | 3,610 | 14.5% |
| Graduate / Professional | 605 | 2.4% |
| Total | 24,945 | 100.0% |
School Enrollment by Age by Funding Source in Yakima
Out of a total of 24,945 students who are enrolled in schools in Yakima, 1,971 (7.9%) attend a private institution, while the remaining 22,974 (92.1%) are enrolled in public schools. The age group of 3 to 4 year olds has the highest likelihood of being enrolled in private schools, with 310 (27.6% in the age bracket) enrolled. Conversely, the age group of 15 to 17 year olds has the lowest likelihood of being enrolled in a private school, with 4,015 (96.8% in the age bracket) attending a public institution.
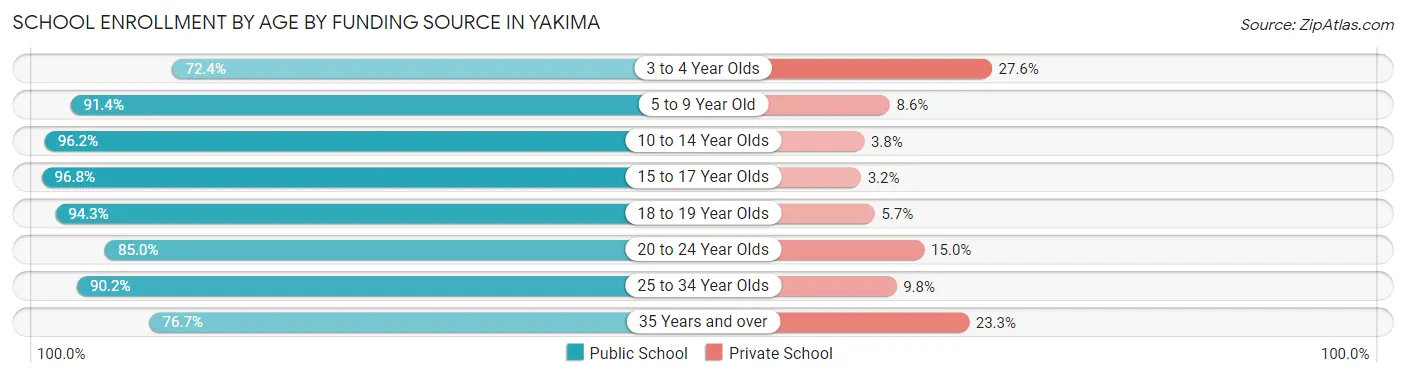
| Age Bracket | Public School | Private School |
| 3 to 4 Year Olds | 815 (72.4%) | 310 (27.6%) |
| 5 to 9 Year Old | 6,257 (91.4%) | 586 (8.6%) |
| 10 to 14 Year Olds | 7,299 (96.2%) | 287 (3.8%) |
| 15 to 17 Year Olds | 4,015 (96.8%) | 132 (3.2%) |
| 18 to 19 Year Olds | 1,478 (94.3%) | 90 (5.7%) |
| 20 to 24 Year Olds | 1,486 (85.0%) | 262 (15.0%) |
| 25 to 34 Year Olds | 996 (90.2%) | 108 (9.8%) |
| 35 Years and over | 632 (76.7%) | 192 (23.3%) |
| Total | 22,974 (92.1%) | 1,971 (7.9%) |
Educational Attainment by Field of Study in Yakima
Education (2,509 | 19.6%), business (1,565 | 12.2%), science & technology (1,467 | 11.4%), social sciences (1,235 | 9.6%), and arts & humanities (1,048 | 8.2%) are the most common fields of study among 12,832 individuals in Yakima who have obtained a bachelor's degree or higher.
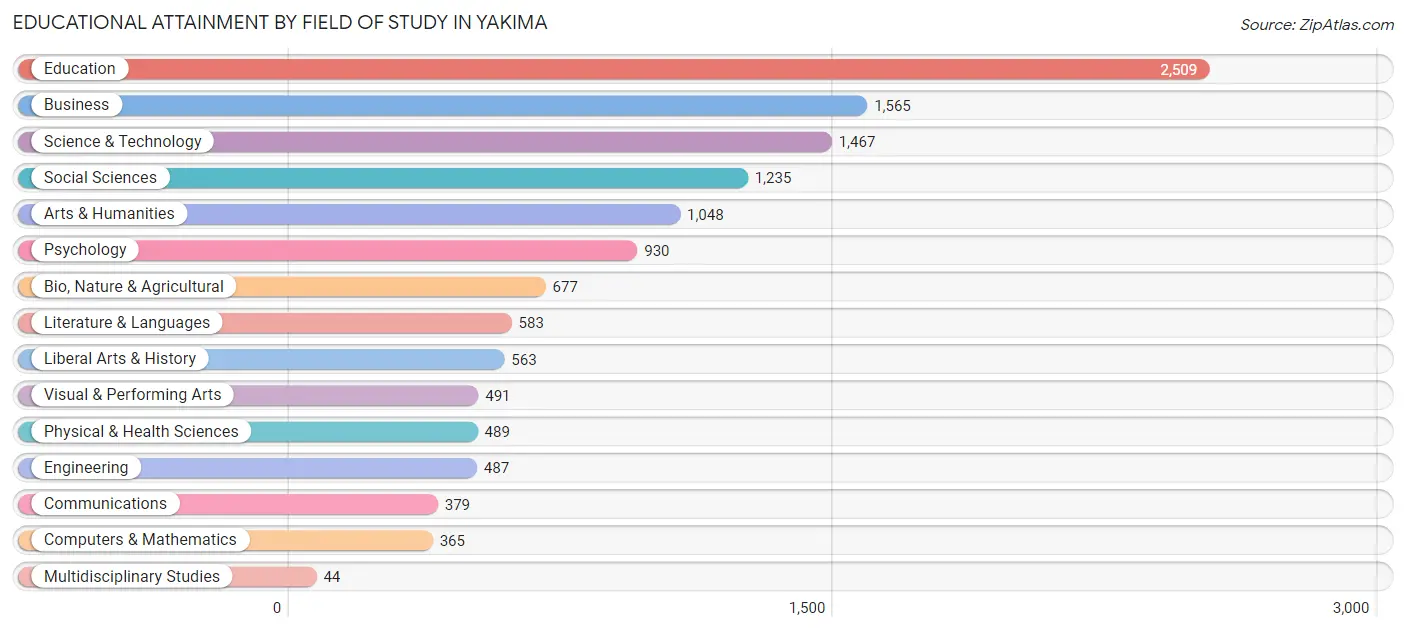
| Field of Study | # Graduates | % Graduates |
| Computers & Mathematics | 365 | 2.8% |
| Bio, Nature & Agricultural | 677 | 5.3% |
| Physical & Health Sciences | 489 | 3.8% |
| Psychology | 930 | 7.2% |
| Social Sciences | 1,235 | 9.6% |
| Engineering | 487 | 3.8% |
| Multidisciplinary Studies | 44 | 0.3% |
| Science & Technology | 1,467 | 11.4% |
| Business | 1,565 | 12.2% |
| Education | 2,509 | 19.6% |
| Literature & Languages | 583 | 4.5% |
| Liberal Arts & History | 563 | 4.4% |
| Visual & Performing Arts | 491 | 3.8% |
| Communications | 379 | 2.9% |
| Arts & Humanities | 1,048 | 8.2% |
| Total | 12,832 | 100.0% |
Transportation & Commute in Yakima
Vehicle Availability by Sex in Yakima
The most prevalent vehicle ownership categories in Yakima are males with 2 vehicles (8,172, accounting for 40.2%) and females with 2 vehicles (6,932, making up 45.8%).
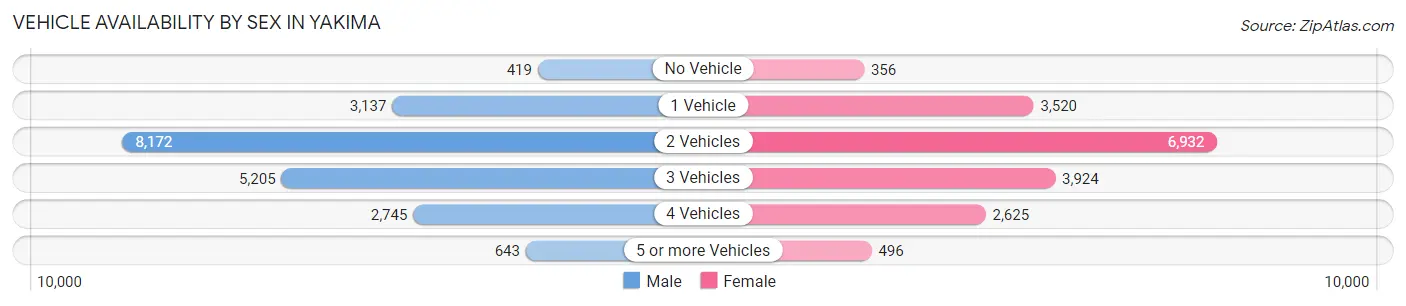
| Vehicles Available | Male | Female |
| No Vehicle | 419 (2.1%) | 356 (2.0%) |
| 1 Vehicle | 3,137 (15.4%) | 3,520 (19.7%) |
| 2 Vehicles | 8,172 (40.2%) | 6,932 (38.8%) |
| 3 Vehicles | 5,205 (25.6%) | 3,924 (22.0%) |
| 4 Vehicles | 2,745 (13.5%) | 2,625 (14.7%) |
| 5 or more Vehicles | 643 (3.2%) | 496 (2.8%) |
| Total | 20,321 (100.0%) | 17,853 (100.0%) |
Commute Time in Yakima
The most frequently occuring commute durations in Yakima are 10 to 14 minutes (8,769 commuters, 24.2%), 15 to 19 minutes (8,727 commuters, 24.1%), and 5 to 9 minutes (6,113 commuters, 16.9%).
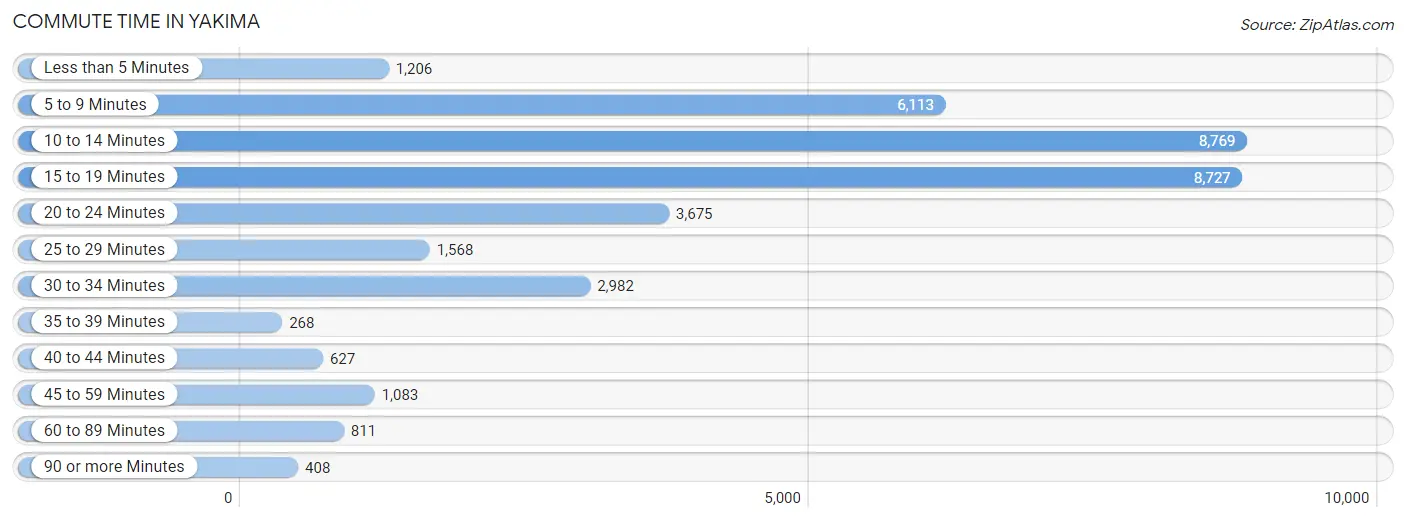
| Commute Time | # Commuters | % Commuters |
| Less than 5 Minutes | 1,206 | 3.3% |
| 5 to 9 Minutes | 6,113 | 16.9% |
| 10 to 14 Minutes | 8,769 | 24.2% |
| 15 to 19 Minutes | 8,727 | 24.1% |
| 20 to 24 Minutes | 3,675 | 10.1% |
| 25 to 29 Minutes | 1,568 | 4.3% |
| 30 to 34 Minutes | 2,982 | 8.2% |
| 35 to 39 Minutes | 268 | 0.7% |
| 40 to 44 Minutes | 627 | 1.7% |
| 45 to 59 Minutes | 1,083 | 3.0% |
| 60 to 89 Minutes | 811 | 2.2% |
| 90 or more Minutes | 408 | 1.1% |
Commute Time by Sex in Yakima
The most common commute times in Yakima are 15 to 19 minutes (4,768 commuters, 24.2%) for males and 10 to 14 minutes (4,437 commuters, 26.8%) for females.
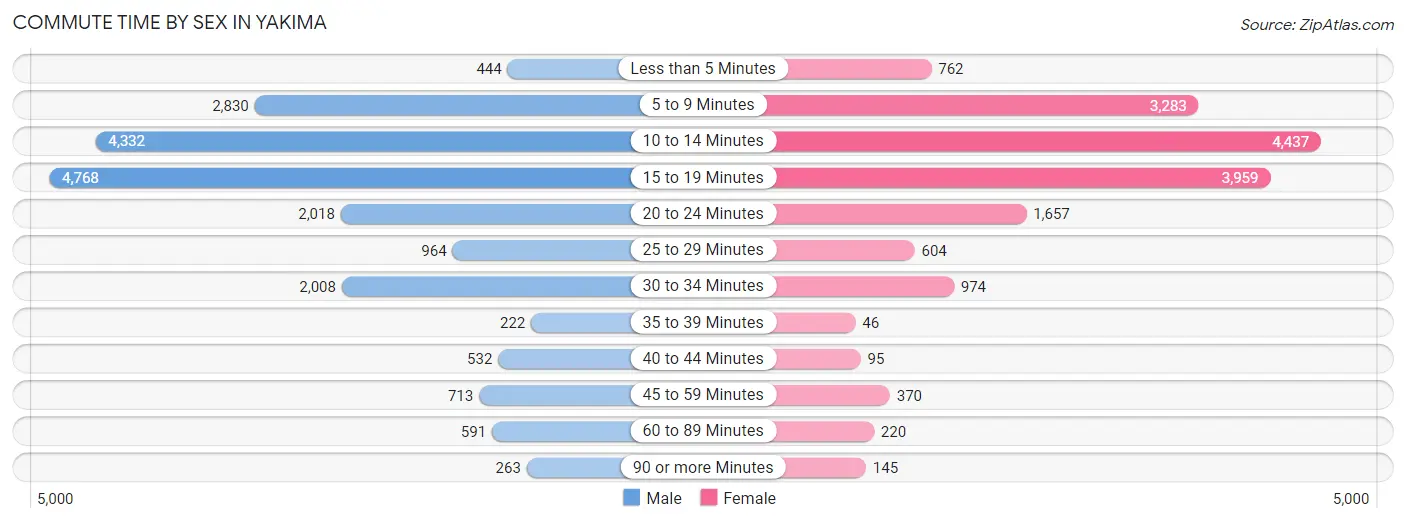
| Commute Time | Male | Female |
| Less than 5 Minutes | 444 (2.3%) | 762 (4.6%) |
| 5 to 9 Minutes | 2,830 (14.4%) | 3,283 (19.8%) |
| 10 to 14 Minutes | 4,332 (22.0%) | 4,437 (26.8%) |
| 15 to 19 Minutes | 4,768 (24.2%) | 3,959 (23.9%) |
| 20 to 24 Minutes | 2,018 (10.2%) | 1,657 (10.0%) |
| 25 to 29 Minutes | 964 (4.9%) | 604 (3.6%) |
| 30 to 34 Minutes | 2,008 (10.2%) | 974 (5.9%) |
| 35 to 39 Minutes | 222 (1.1%) | 46 (0.3%) |
| 40 to 44 Minutes | 532 (2.7%) | 95 (0.6%) |
| 45 to 59 Minutes | 713 (3.6%) | 370 (2.2%) |
| 60 to 89 Minutes | 591 (3.0%) | 220 (1.3%) |
| 90 or more Minutes | 263 (1.3%) | 145 (0.9%) |
Time of Departure to Work by Sex in Yakima
The most frequent times of departure to work in Yakima are 7:00 AM to 7:29 AM (2,457, 12.5%) for males and 7:30 AM to 7:59 AM (2,904, 17.5%) for females.
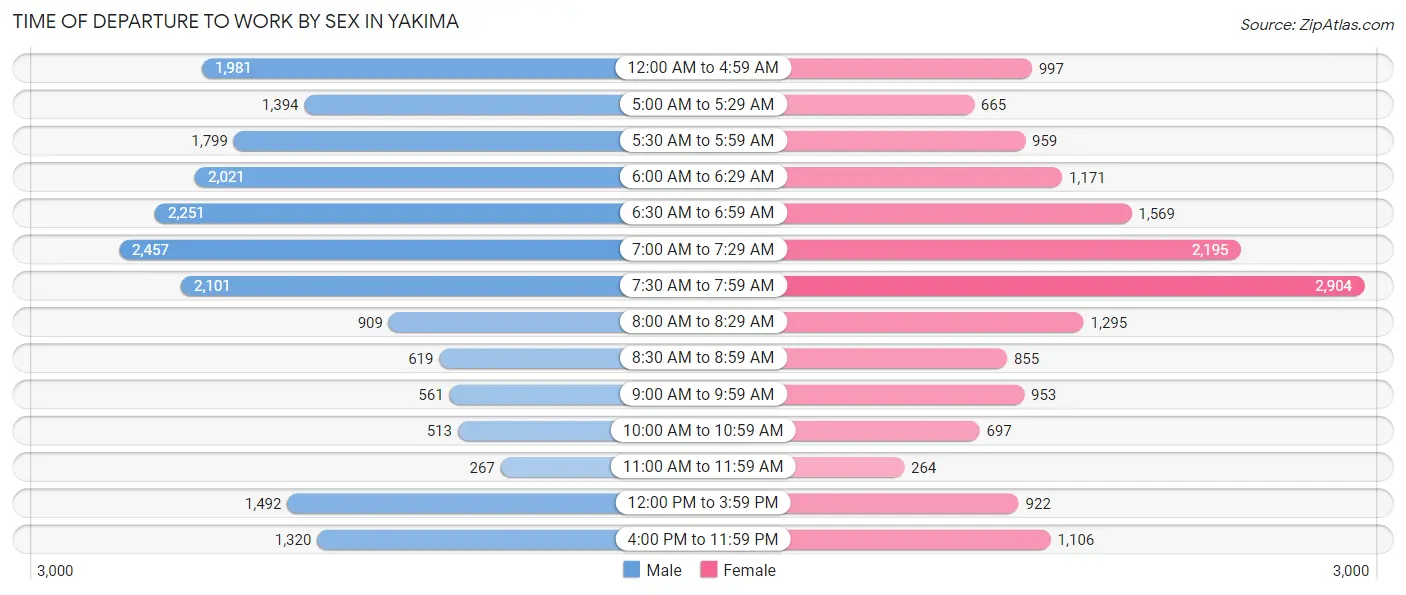
| Time of Departure | Male | Female |
| 12:00 AM to 4:59 AM | 1,981 (10.1%) | 997 (6.0%) |
| 5:00 AM to 5:29 AM | 1,394 (7.1%) | 665 (4.0%) |
| 5:30 AM to 5:59 AM | 1,799 (9.1%) | 959 (5.8%) |
| 6:00 AM to 6:29 AM | 2,021 (10.3%) | 1,171 (7.1%) |
| 6:30 AM to 6:59 AM | 2,251 (11.4%) | 1,569 (9.5%) |
| 7:00 AM to 7:29 AM | 2,457 (12.5%) | 2,195 (13.3%) |
| 7:30 AM to 7:59 AM | 2,101 (10.7%) | 2,904 (17.5%) |
| 8:00 AM to 8:29 AM | 909 (4.6%) | 1,295 (7.8%) |
| 8:30 AM to 8:59 AM | 619 (3.1%) | 855 (5.2%) |
| 9:00 AM to 9:59 AM | 561 (2.9%) | 953 (5.8%) |
| 10:00 AM to 10:59 AM | 513 (2.6%) | 697 (4.2%) |
| 11:00 AM to 11:59 AM | 267 (1.4%) | 264 (1.6%) |
| 12:00 PM to 3:59 PM | 1,492 (7.6%) | 922 (5.6%) |
| 4:00 PM to 11:59 PM | 1,320 (6.7%) | 1,106 (6.7%) |
| Total | 19,685 (100.0%) | 16,552 (100.0%) |
Housing Occupancy in Yakima
Occupancy by Ownership in Yakima
Of the total 34,830 dwellings in Yakima, owner-occupied units account for 18,494 (53.1%), while renter-occupied units make up 16,336 (46.9%).
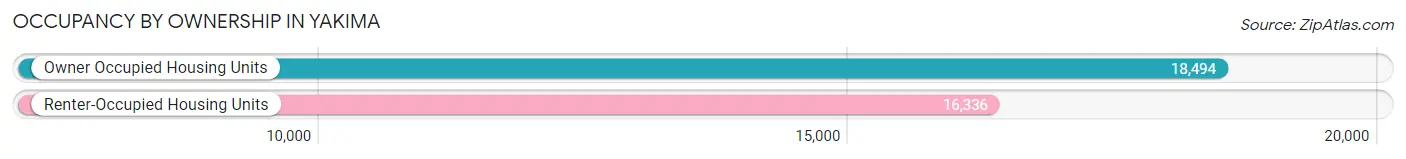
| Occupancy | # Housing Units | % Housing Units |
| Owner Occupied Housing Units | 18,494 | 53.1% |
| Renter-Occupied Housing Units | 16,336 | 46.9% |
| Total Occupied Housing Units | 34,830 | 100.0% |
Occupancy by Household Size in Yakima
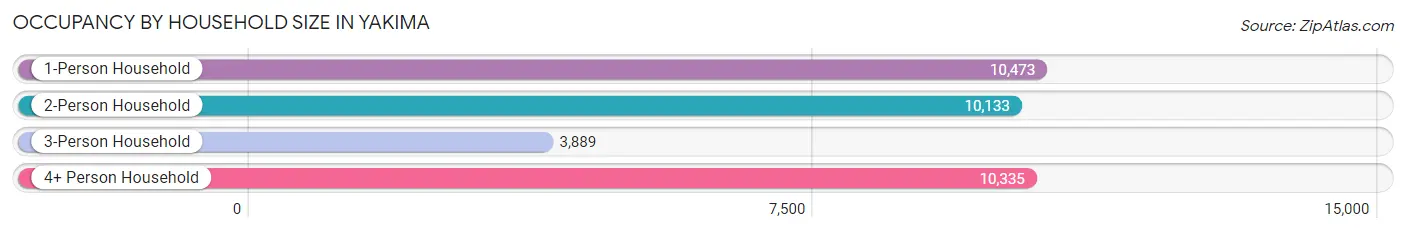
| Household Size | # Housing Units | % Housing Units |
| 1-Person Household | 10,473 | 30.1% |
| 2-Person Household | 10,133 | 29.1% |
| 3-Person Household | 3,889 | 11.2% |
| 4+ Person Household | 10,335 | 29.7% |
| Total Housing Units | 34,830 | 100.0% |
Occupancy by Ownership by Household Size in Yakima
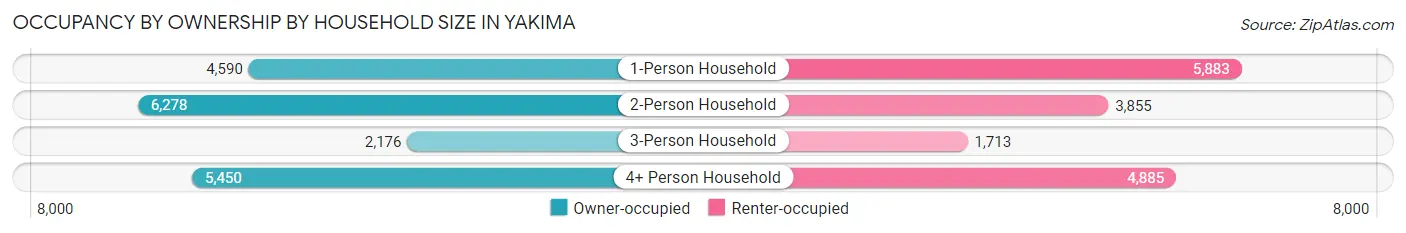
| Household Size | Owner-occupied | Renter-occupied |
| 1-Person Household | 4,590 (43.8%) | 5,883 (56.2%) |
| 2-Person Household | 6,278 (62.0%) | 3,855 (38.0%) |
| 3-Person Household | 2,176 (55.9%) | 1,713 (44.1%) |
| 4+ Person Household | 5,450 (52.7%) | 4,885 (47.3%) |
| Total Housing Units | 18,494 (53.1%) | 16,336 (46.9%) |
Occupancy by Educational Attainment in Yakima
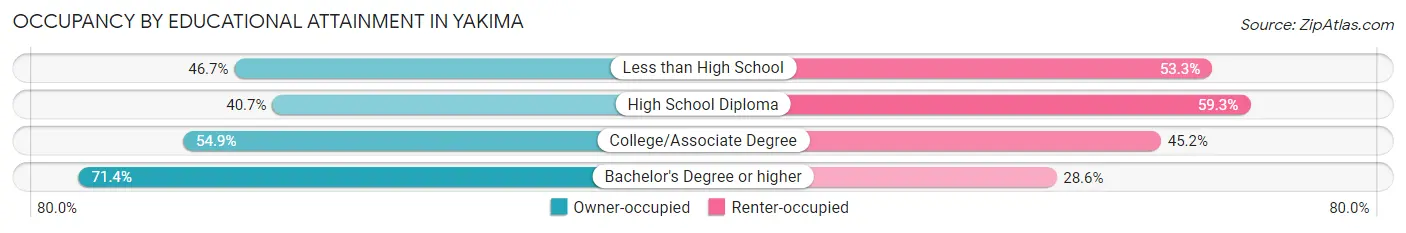
| Household Size | Owner-occupied | Renter-occupied |
| Less than High School | 3,275 (46.7%) | 3,732 (53.3%) |
| High School Diploma | 3,694 (40.7%) | 5,380 (59.3%) |
| College/Associate Degree | 6,181 (54.8%) | 5,087 (45.2%) |
| Bachelor's Degree or higher | 5,344 (71.4%) | 2,137 (28.6%) |
Occupancy by Age of Householder in Yakima
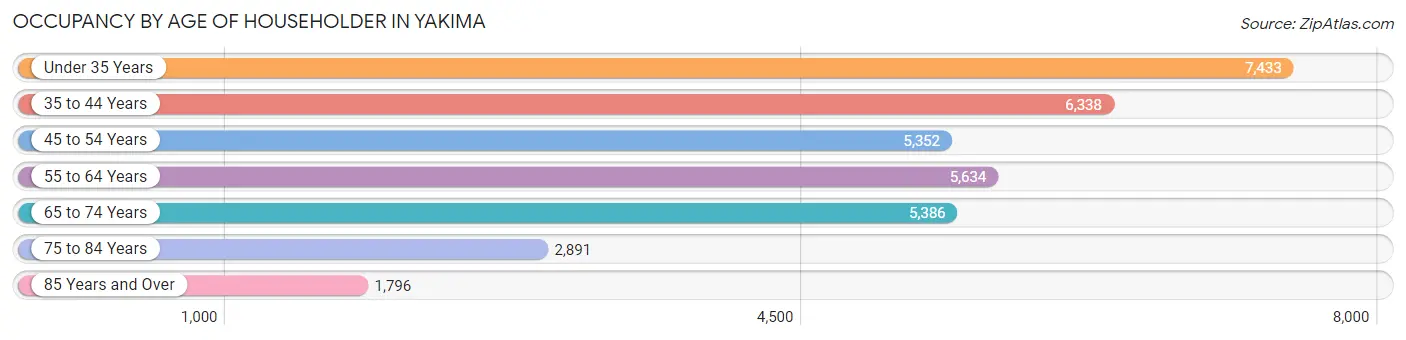
| Age Bracket | # Households | % Households |
| Under 35 Years | 7,433 | 21.3% |
| 35 to 44 Years | 6,338 | 18.2% |
| 45 to 54 Years | 5,352 | 15.4% |
| 55 to 64 Years | 5,634 | 16.2% |
| 65 to 74 Years | 5,386 | 15.5% |
| 75 to 84 Years | 2,891 | 8.3% |
| 85 Years and Over | 1,796 | 5.2% |
| Total | 34,830 | 100.0% |
Housing Finances in Yakima
Median Income by Occupancy in Yakima
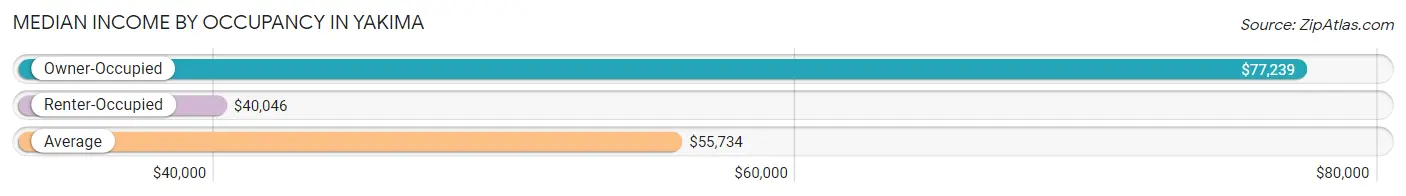
| Occupancy Type | # Households | Median Income |
| Owner-Occupied | 18,494 (53.1%) | $77,239 |
| Renter-Occupied | 16,336 (46.9%) | $40,046 |
| Average | 34,830 (100.0%) | $55,734 |
Occupancy by Householder Income Bracket in Yakima
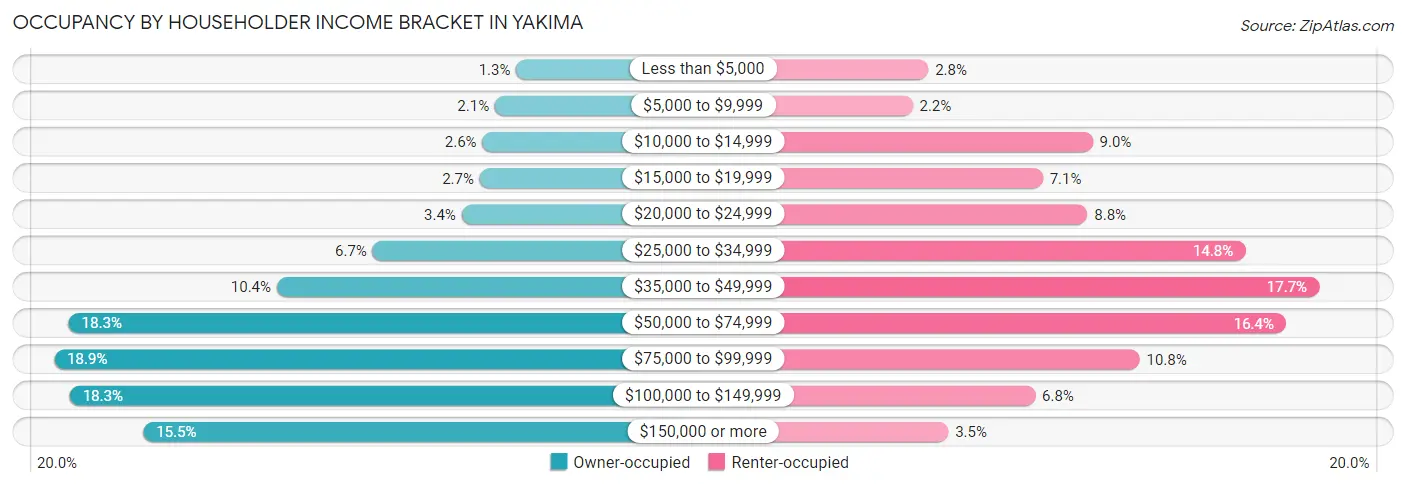
| Income Bracket | Owner-occupied | Renter-occupied |
| Less than $5,000 | 235 (1.3%) | 452 (2.8%) |
| $5,000 to $9,999 | 385 (2.1%) | 354 (2.2%) |
| $10,000 to $14,999 | 473 (2.6%) | 1,475 (9.0%) |
| $15,000 to $19,999 | 492 (2.7%) | 1,165 (7.1%) |
| $20,000 to $24,999 | 619 (3.4%) | 1,442 (8.8%) |
| $25,000 to $34,999 | 1,246 (6.7%) | 2,424 (14.8%) |
| $35,000 to $49,999 | 1,921 (10.4%) | 2,884 (17.6%) |
| $50,000 to $74,999 | 3,388 (18.3%) | 2,678 (16.4%) |
| $75,000 to $99,999 | 3,492 (18.9%) | 1,767 (10.8%) |
| $100,000 to $149,999 | 3,381 (18.3%) | 1,118 (6.8%) |
| $150,000 or more | 2,862 (15.5%) | 577 (3.5%) |
| Total | 18,494 (100.0%) | 16,336 (100.0%) |
Monthly Housing Cost Tiers in Yakima
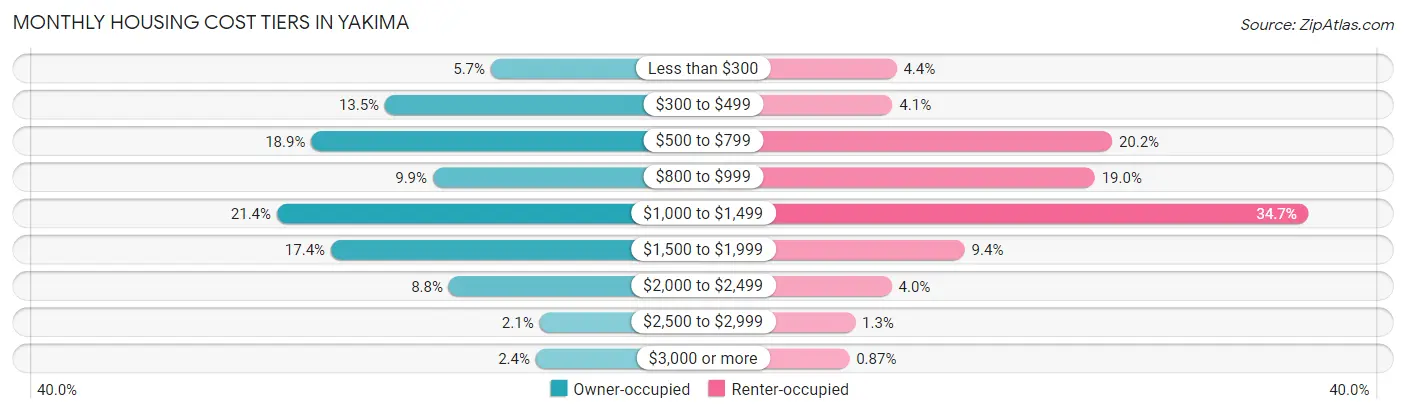
| Monthly Cost | Owner-occupied | Renter-occupied |
| Less than $300 | 1,047 (5.7%) | 711 (4.3%) |
| $300 to $499 | 2,490 (13.5%) | 661 (4.1%) |
| $500 to $799 | 3,494 (18.9%) | 3,303 (20.2%) |
| $800 to $999 | 1,837 (9.9%) | 3,095 (19.0%) |
| $1,000 to $1,499 | 3,961 (21.4%) | 5,668 (34.7%) |
| $1,500 to $1,999 | 3,225 (17.4%) | 1,530 (9.4%) |
| $2,000 to $2,499 | 1,620 (8.8%) | 652 (4.0%) |
| $2,500 to $2,999 | 385 (2.1%) | 213 (1.3%) |
| $3,000 or more | 435 (2.4%) | 142 (0.9%) |
| Total | 18,494 (100.0%) | 16,336 (100.0%) |
Physical Housing Characteristics in Yakima
Housing Structures in Yakima
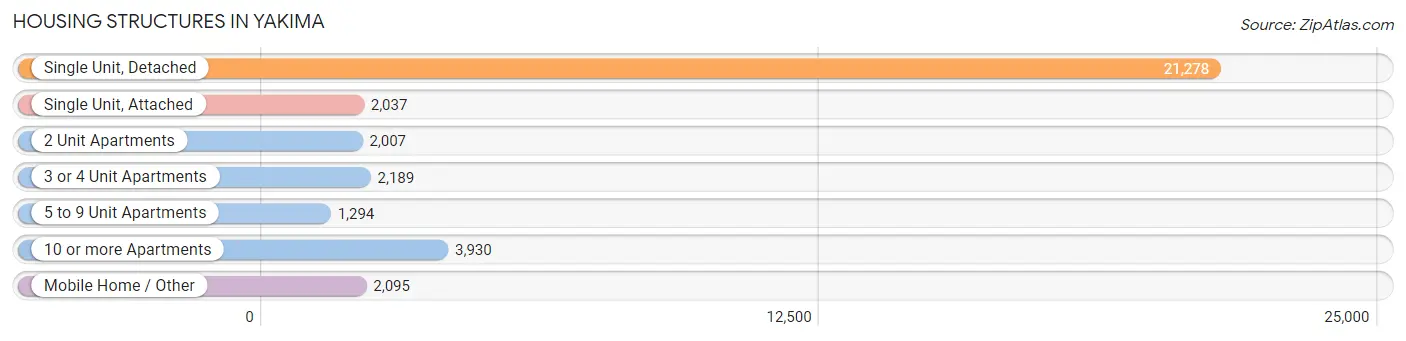
| Structure Type | # Housing Units | % Housing Units |
| Single Unit, Detached | 21,278 | 61.1% |
| Single Unit, Attached | 2,037 | 5.9% |
| 2 Unit Apartments | 2,007 | 5.8% |
| 3 or 4 Unit Apartments | 2,189 | 6.3% |
| 5 to 9 Unit Apartments | 1,294 | 3.7% |
| 10 or more Apartments | 3,930 | 11.3% |
| Mobile Home / Other | 2,095 | 6.0% |
| Total | 34,830 | 100.0% |
Housing Structures by Occupancy in Yakima
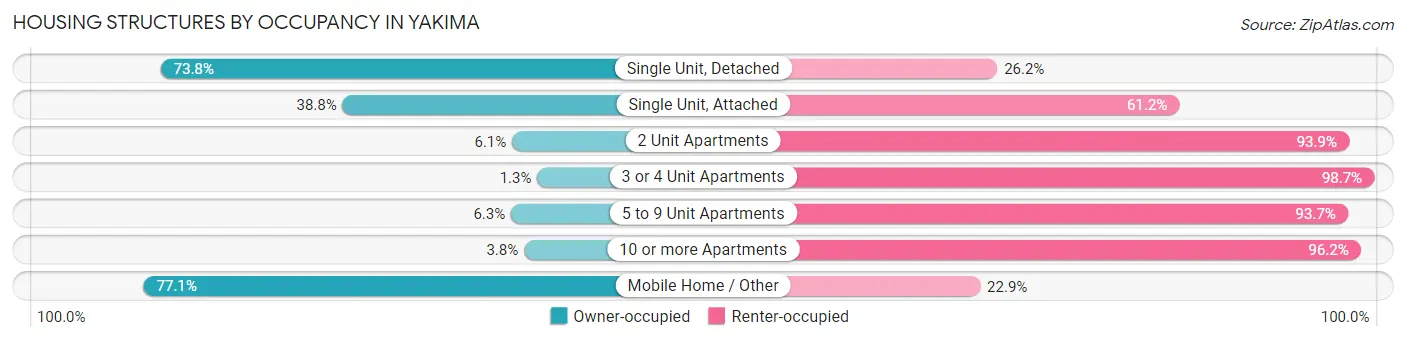
| Structure Type | Owner-occupied | Renter-occupied |
| Single Unit, Detached | 15,705 (73.8%) | 5,573 (26.2%) |
| Single Unit, Attached | 790 (38.8%) | 1,247 (61.2%) |
| 2 Unit Apartments | 123 (6.1%) | 1,884 (93.9%) |
| 3 or 4 Unit Apartments | 28 (1.3%) | 2,161 (98.7%) |
| 5 to 9 Unit Apartments | 82 (6.3%) | 1,212 (93.7%) |
| 10 or more Apartments | 151 (3.8%) | 3,779 (96.2%) |
| Mobile Home / Other | 1,615 (77.1%) | 480 (22.9%) |
| Total | 18,494 (53.1%) | 16,336 (46.9%) |
Housing Structures by Number of Rooms in Yakima
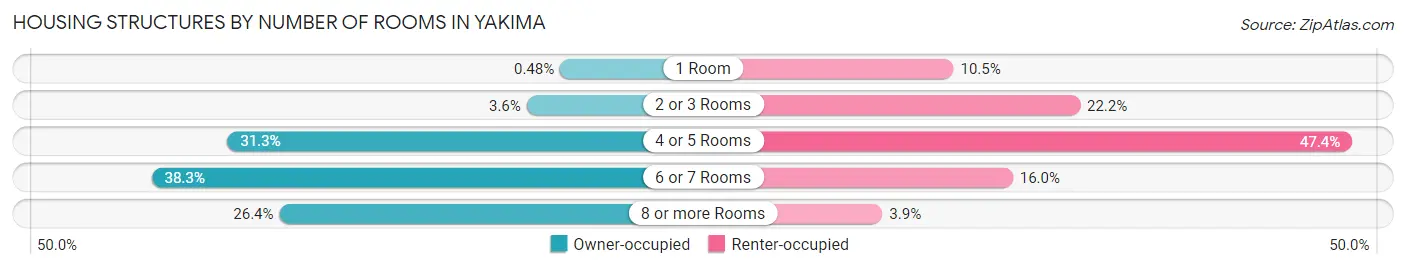
| Number of Rooms | Owner-occupied | Renter-occupied |
| 1 Room | 88 (0.5%) | 1,717 (10.5%) |
| 2 or 3 Rooms | 661 (3.6%) | 3,628 (22.2%) |
| 4 or 5 Rooms | 5,780 (31.2%) | 7,737 (47.4%) |
| 6 or 7 Rooms | 7,075 (38.3%) | 2,612 (16.0%) |
| 8 or more Rooms | 4,890 (26.4%) | 642 (3.9%) |
| Total | 18,494 (100.0%) | 16,336 (100.0%) |
Housing Structure by Heating Type in Yakima
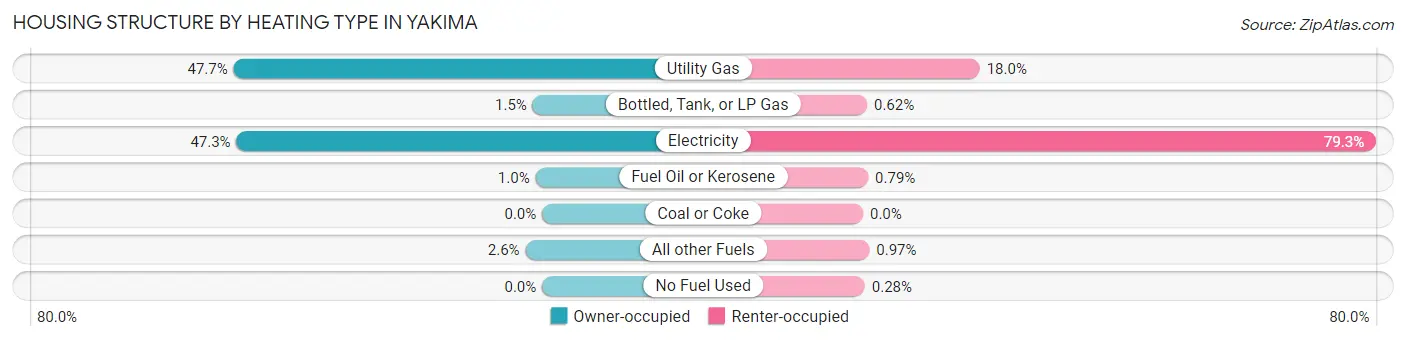
| Heating Type | Owner-occupied | Renter-occupied |
| Utility Gas | 8,821 (47.7%) | 2,947 (18.0%) |
| Bottled, Tank, or LP Gas | 270 (1.5%) | 101 (0.6%) |
| Electricity | 8,738 (47.2%) | 12,954 (79.3%) |
| Fuel Oil or Kerosene | 188 (1.0%) | 129 (0.8%) |
| Coal or Coke | 0 (0.0%) | 0 (0.0%) |
| All other Fuels | 477 (2.6%) | 159 (1.0%) |
| No Fuel Used | 0 (0.0%) | 46 (0.3%) |
| Total | 18,494 (100.0%) | 16,336 (100.0%) |
Household Vehicle Usage in Yakima
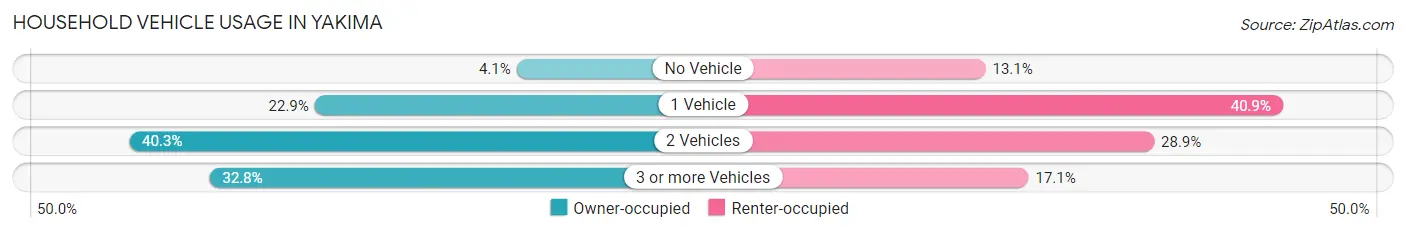
| Vehicles per Household | Owner-occupied | Renter-occupied |
| No Vehicle | 754 (4.1%) | 2,145 (13.1%) |
| 1 Vehicle | 4,240 (22.9%) | 6,677 (40.9%) |
| 2 Vehicles | 7,444 (40.3%) | 4,714 (28.9%) |
| 3 or more Vehicles | 6,056 (32.8%) | 2,800 (17.1%) |
| Total | 18,494 (100.0%) | 16,336 (100.0%) |
Real Estate & Mortgages in Yakima
Real Estate and Mortgage Overview in Yakima
| Characteristic | Without Mortgage | With Mortgage |
| Housing Units | 7,672 | 10,822 |
| Median Property Value | $211,800 | $260,700 |
| Median Household Income | $60,682 | $2,065 |
| Monthly Housing Costs | $531 | $413 |
| Real Estate Taxes | $1,750 | $673 |
Property Value by Mortgage Status in Yakima
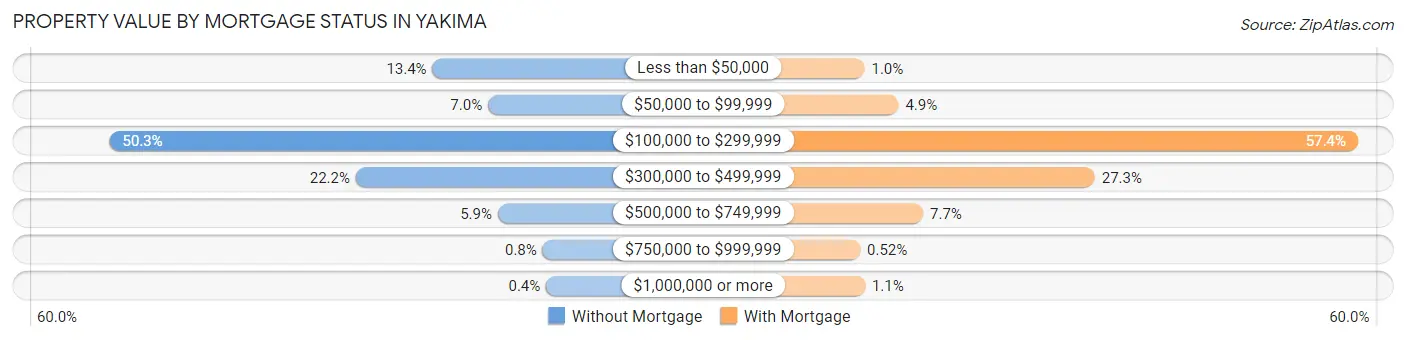
| Property Value | Without Mortgage | With Mortgage |
| Less than $50,000 | 1,027 (13.4%) | 112 (1.0%) |
| $50,000 to $99,999 | 540 (7.0%) | 531 (4.9%) |
| $100,000 to $299,999 | 3,860 (50.3%) | 6,212 (57.4%) |
| $300,000 to $499,999 | 1,699 (22.2%) | 2,959 (27.3%) |
| $500,000 to $749,999 | 454 (5.9%) | 835 (7.7%) |
| $750,000 to $999,999 | 61 (0.8%) | 56 (0.5%) |
| $1,000,000 or more | 31 (0.4%) | 117 (1.1%) |
| Total | 7,672 (100.0%) | 10,822 (100.0%) |
Household Income by Mortgage Status in Yakima
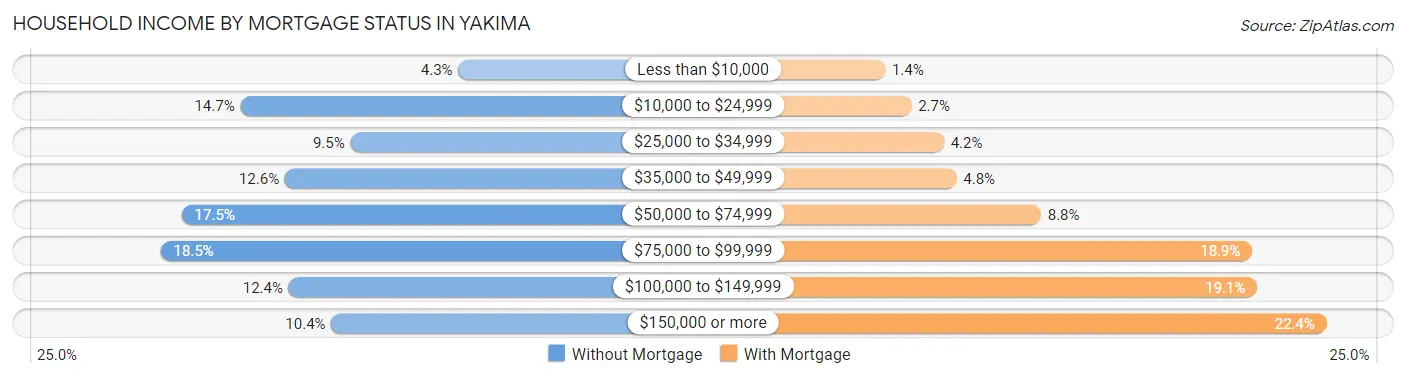
| Household Income | Without Mortgage | With Mortgage |
| Less than $10,000 | 333 (4.3%) | 152 (1.4%) |
| $10,000 to $24,999 | 1,129 (14.7%) | 287 (2.6%) |
| $25,000 to $34,999 | 727 (9.5%) | 455 (4.2%) |
| $35,000 to $49,999 | 967 (12.6%) | 519 (4.8%) |
| $50,000 to $74,999 | 1,344 (17.5%) | 954 (8.8%) |
| $75,000 to $99,999 | 1,422 (18.5%) | 2,044 (18.9%) |
| $100,000 to $149,999 | 953 (12.4%) | 2,070 (19.1%) |
| $150,000 or more | 797 (10.4%) | 2,428 (22.4%) |
| Total | 7,672 (100.0%) | 10,822 (100.0%) |
Property Value to Household Income Ratio in Yakima
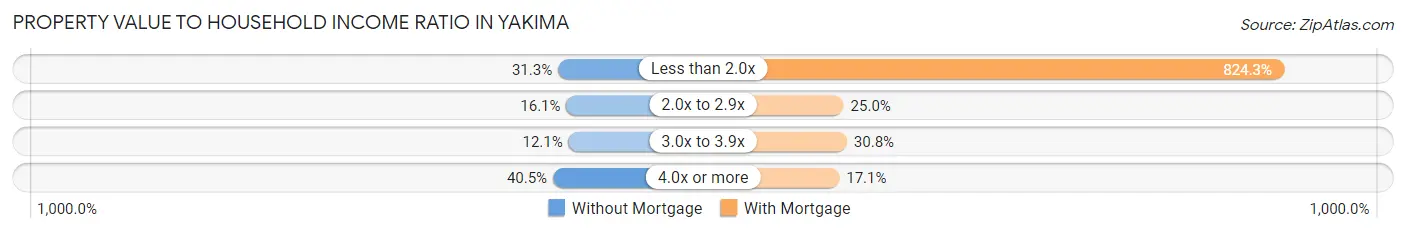
| Value-to-Income Ratio | Without Mortgage | With Mortgage |
| Less than 2.0x | 2,404 (31.3%) | 89,210 (824.3%) |
| 2.0x to 2.9x | 1,235 (16.1%) | 2,702 (25.0%) |
| 3.0x to 3.9x | 927 (12.1%) | 3,337 (30.8%) |
| 4.0x or more | 3,106 (40.5%) | 1,848 (17.1%) |
| Total | 7,672 (100.0%) | 10,822 (100.0%) |
Real Estate Taxes by Mortgage Status in Yakima
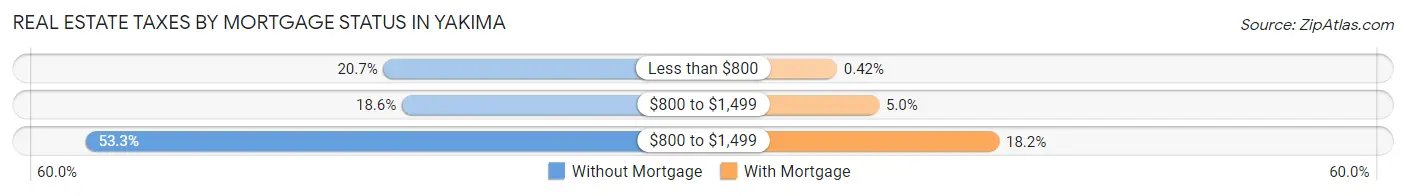
| Property Taxes | Without Mortgage | With Mortgage |
| Less than $800 | 1,586 (20.7%) | 45 (0.4%) |
| $800 to $1,499 | 1,430 (18.6%) | 545 (5.0%) |
| $800 to $1,499 | 4,091 (53.3%) | 1,969 (18.2%) |
| Total | 7,672 (100.0%) | 10,822 (100.0%) |
Health & Disability in Yakima
Health Insurance Coverage by Age in Yakima
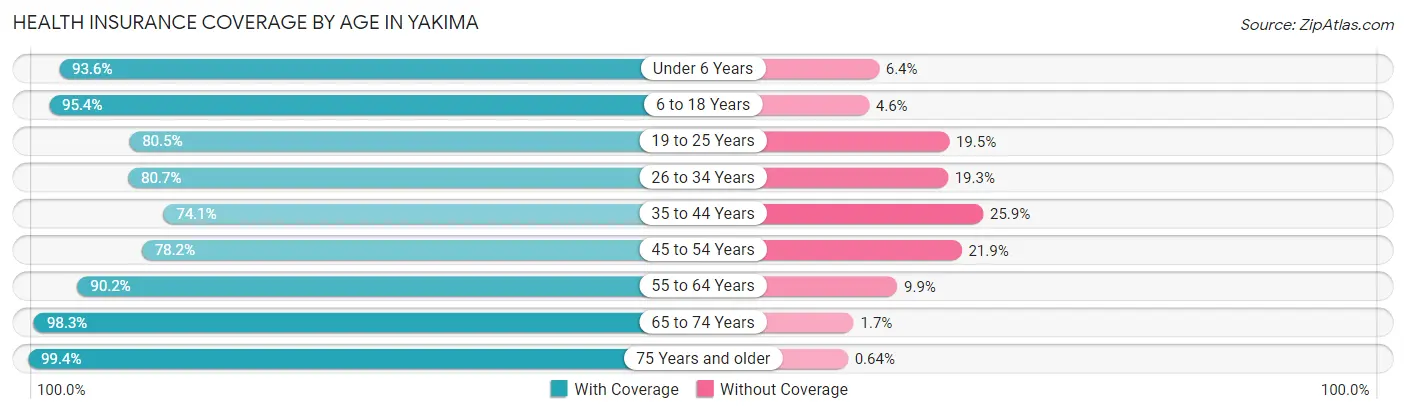
| Age Bracket | With Coverage | Without Coverage |
| Under 6 Years | 7,955 (93.6%) | 547 (6.4%) |
| 6 to 18 Years | 18,901 (95.4%) | 908 (4.6%) |
| 19 to 25 Years | 6,943 (80.5%) | 1,684 (19.5%) |
| 26 to 34 Years | 9,930 (80.7%) | 2,373 (19.3%) |
| 35 to 44 Years | 8,724 (74.1%) | 3,045 (25.9%) |
| 45 to 54 Years | 7,870 (78.1%) | 2,200 (21.8%) |
| 55 to 64 Years | 8,347 (90.1%) | 912 (9.9%) |
| 65 to 74 Years | 7,898 (98.3%) | 140 (1.7%) |
| 75 Years and older | 6,642 (99.4%) | 43 (0.6%) |
| Total | 83,210 (87.5%) | 11,852 (12.5%) |
Health Insurance Coverage by Citizenship Status in Yakima
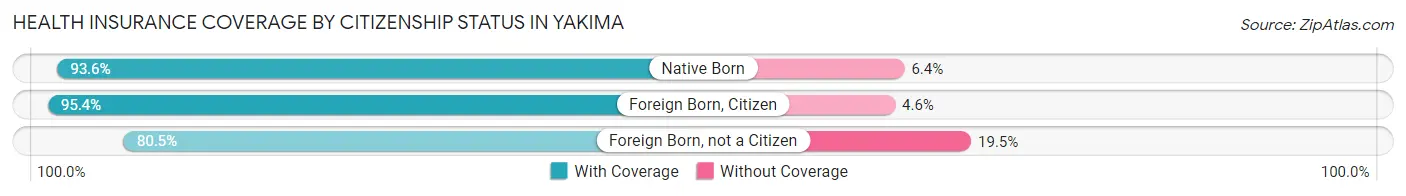
| Citizenship Status | With Coverage | Without Coverage |
| Native Born | 7,955 (93.6%) | 547 (6.4%) |
| Foreign Born, Citizen | 18,901 (95.4%) | 908 (4.6%) |
| Foreign Born, not a Citizen | 6,943 (80.5%) | 1,684 (19.5%) |
Health Insurance Coverage by Household Income in Yakima
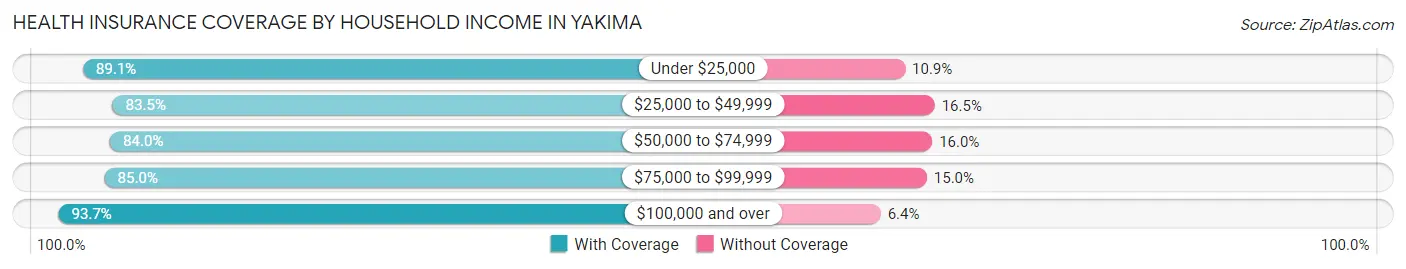
| Household Income | With Coverage | Without Coverage |
| Under $25,000 | 11,832 (89.1%) | 1,452 (10.9%) |
| $25,000 to $49,999 | 17,696 (83.5%) | 3,492 (16.5%) |
| $50,000 to $74,999 | 14,625 (84.0%) | 2,785 (16.0%) |
| $75,000 to $99,999 | 13,565 (85.0%) | 2,393 (15.0%) |
| $100,000 and over | 24,762 (93.6%) | 1,678 (6.4%) |
Public vs Private Health Insurance Coverage by Age in Yakima
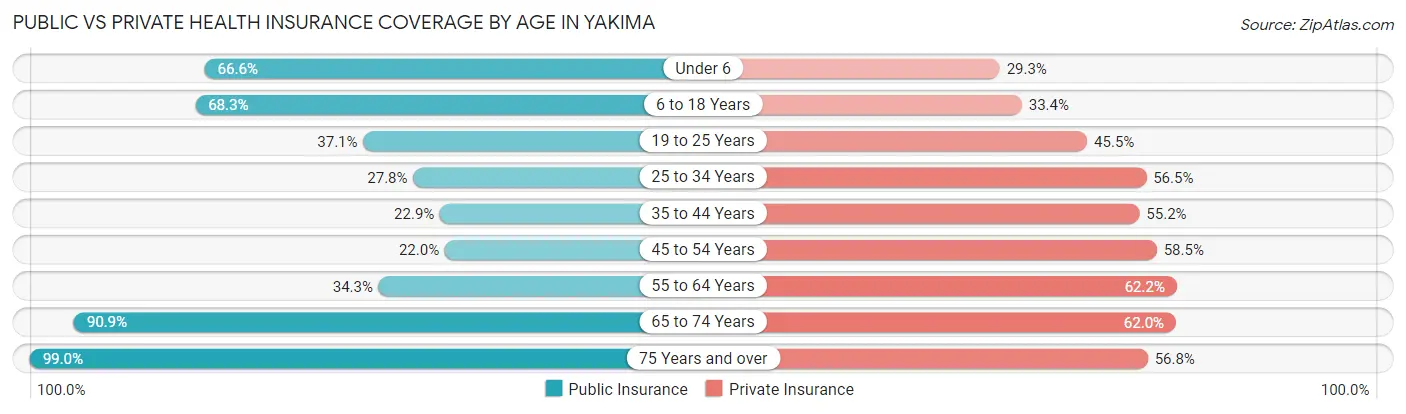
| Age Bracket | Public Insurance | Private Insurance |
| Under 6 | 5,660 (66.6%) | 2,492 (29.3%) |
| 6 to 18 Years | 13,533 (68.3%) | 6,619 (33.4%) |
| 19 to 25 Years | 3,202 (37.1%) | 3,929 (45.5%) |
| 25 to 34 Years | 3,425 (27.8%) | 6,952 (56.5%) |
| 35 to 44 Years | 2,691 (22.9%) | 6,501 (55.2%) |
| 45 to 54 Years | 2,212 (22.0%) | 5,887 (58.5%) |
| 55 to 64 Years | 3,171 (34.3%) | 5,755 (62.2%) |
| 65 to 74 Years | 7,303 (90.9%) | 4,984 (62.0%) |
| 75 Years and over | 6,621 (99.0%) | 3,796 (56.8%) |
| Total | 47,818 (50.3%) | 46,915 (49.3%) |
Disability Status by Sex by Age in Yakima
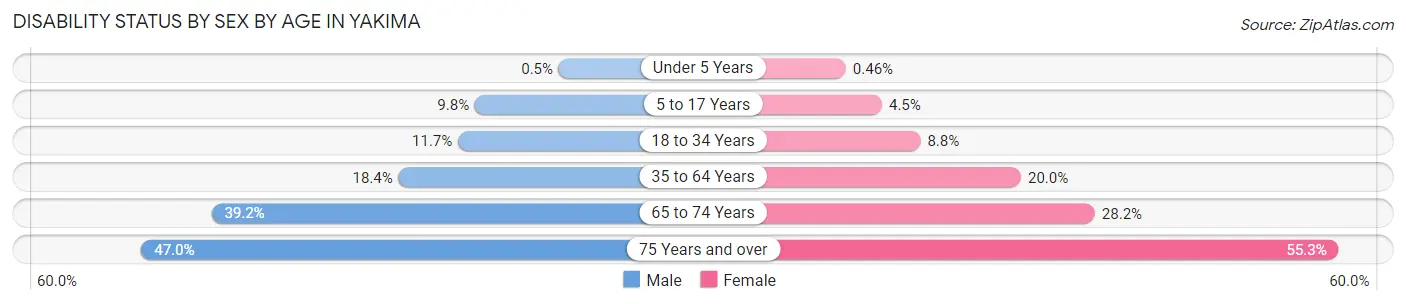
| Age Bracket | Male | Female |
| Under 5 Years | 19 (0.5%) | 16 (0.5%) |
| 5 to 17 Years | 1,026 (9.8%) | 411 (4.5%) |
| 18 to 34 Years | 1,335 (11.7%) | 961 (8.8%) |
| 35 to 64 Years | 2,795 (18.3%) | 3,167 (20.0%) |
| 65 to 74 Years | 1,366 (39.2%) | 1,283 (28.2%) |
| 75 Years and over | 1,345 (47.0%) | 2,115 (55.3%) |
Disability Class by Sex by Age in Yakima
Disability Class: Hearing Difficulty
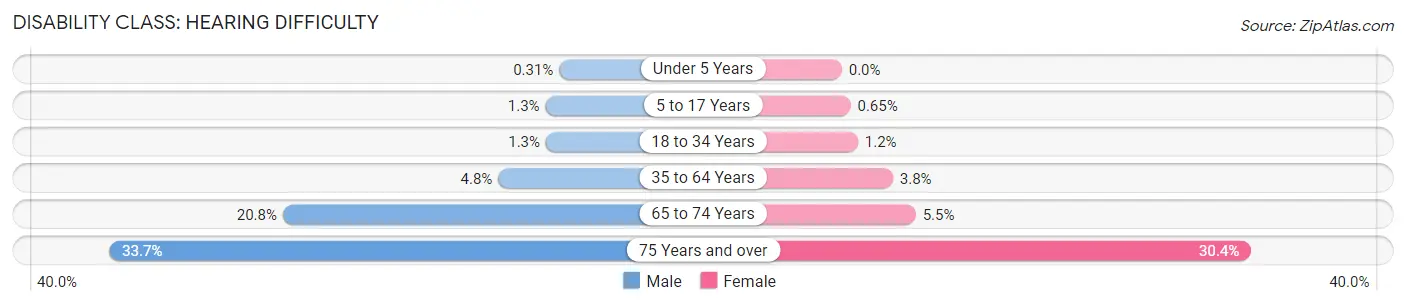
| Age Bracket | Male | Female |
| Under 5 Years | 12 (0.3%) | 0 (0.0%) |
| 5 to 17 Years | 139 (1.3%) | 60 (0.6%) |
| 18 to 34 Years | 148 (1.3%) | 131 (1.2%) |
| 35 to 64 Years | 738 (4.8%) | 602 (3.8%) |
| 65 to 74 Years | 726 (20.8%) | 250 (5.5%) |
| 75 Years and over | 965 (33.7%) | 1,162 (30.4%) |
Disability Class: Vision Difficulty
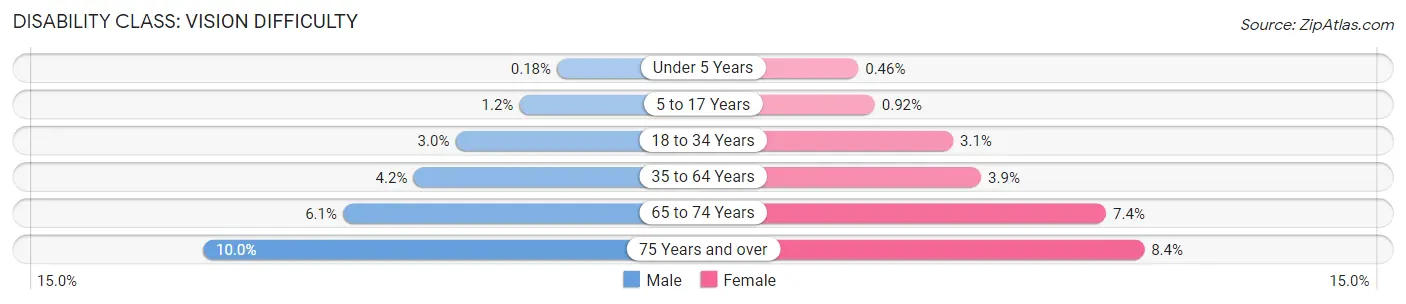
| Age Bracket | Male | Female |
| Under 5 Years | 7 (0.2%) | 16 (0.5%) |
| 5 to 17 Years | 128 (1.2%) | 84 (0.9%) |
| 18 to 34 Years | 343 (3.0%) | 340 (3.1%) |
| 35 to 64 Years | 637 (4.2%) | 615 (3.9%) |
| 65 to 74 Years | 214 (6.1%) | 335 (7.4%) |
| 75 Years and over | 287 (10.0%) | 322 (8.4%) |
Disability Class: Cognitive Difficulty
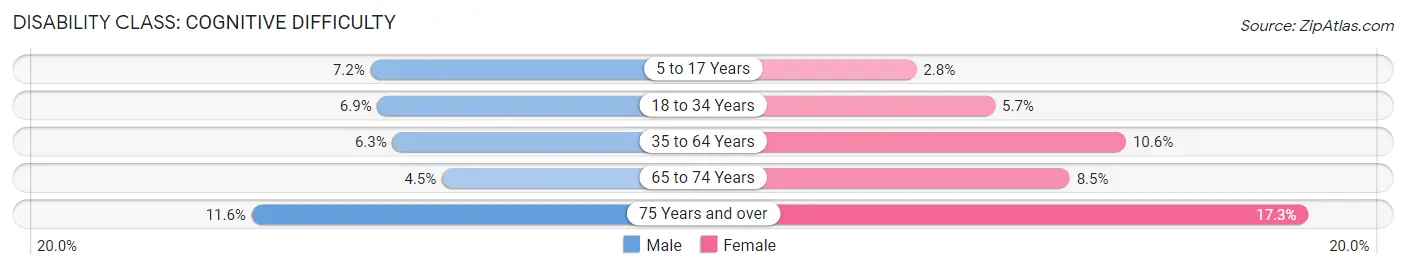
| Age Bracket | Male | Female |
| 5 to 17 Years | 747 (7.2%) | 254 (2.8%) |
| 18 to 34 Years | 786 (6.9%) | 624 (5.7%) |
| 35 to 64 Years | 966 (6.3%) | 1,673 (10.5%) |
| 65 to 74 Years | 157 (4.5%) | 385 (8.5%) |
| 75 Years and over | 331 (11.6%) | 662 (17.3%) |
Disability Class: Ambulatory Difficulty
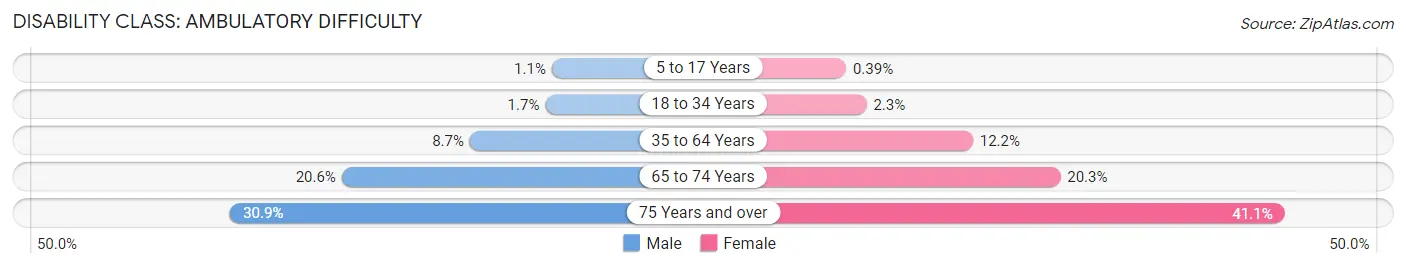
| Age Bracket | Male | Female |
| 5 to 17 Years | 113 (1.1%) | 36 (0.4%) |
| 18 to 34 Years | 191 (1.7%) | 251 (2.3%) |
| 35 to 64 Years | 1,322 (8.7%) | 1,929 (12.2%) |
| 65 to 74 Years | 717 (20.6%) | 923 (20.3%) |
| 75 Years and over | 885 (30.9%) | 1,571 (41.1%) |
Disability Class: Self-Care Difficulty
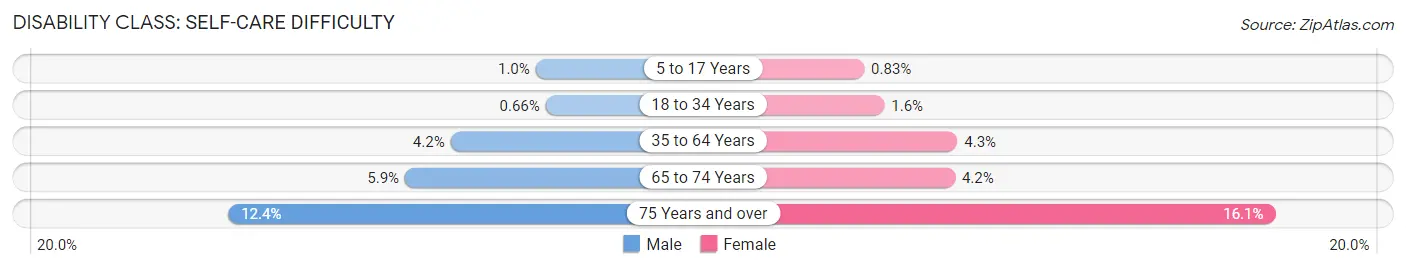
| Age Bracket | Male | Female |
| 5 to 17 Years | 107 (1.0%) | 76 (0.8%) |
| 18 to 34 Years | 75 (0.7%) | 173 (1.6%) |
| 35 to 64 Years | 638 (4.2%) | 680 (4.3%) |
| 65 to 74 Years | 205 (5.9%) | 191 (4.2%) |
| 75 Years and over | 356 (12.4%) | 615 (16.1%) |
Technology Access in Yakima
Computing Device Access in Yakima
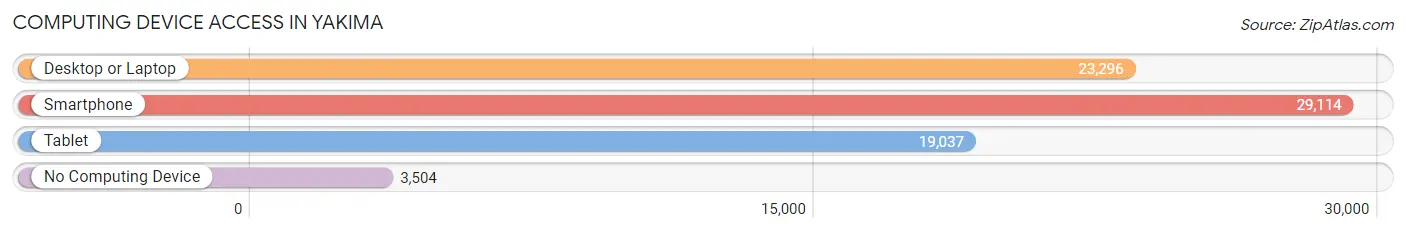
| Device Type | # Households | % Households |
| Desktop or Laptop | 23,296 | 66.9% |
| Smartphone | 29,114 | 83.6% |
| Tablet | 19,037 | 54.7% |
| No Computing Device | 3,504 | 10.1% |
| Total | 34,830 | 100.0% |
Internet Access in Yakima
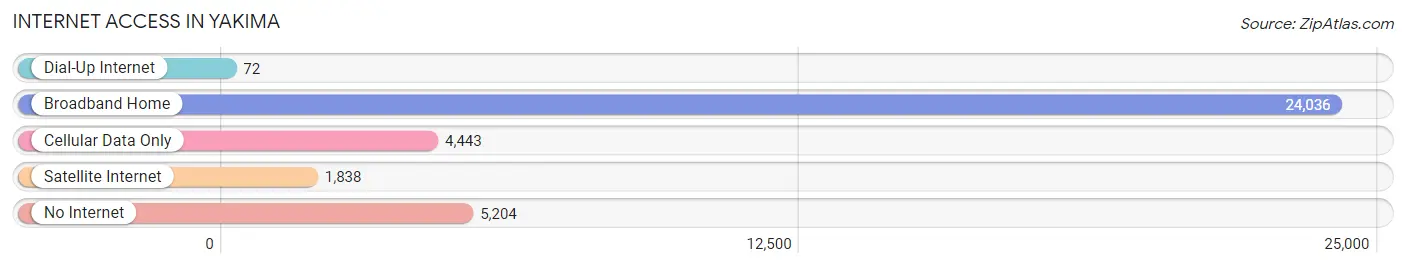
| Internet Type | # Households | % Households |
| Dial-Up Internet | 72 | 0.2% |
| Broadband Home | 24,036 | 69.0% |
| Cellular Data Only | 4,443 | 12.8% |
| Satellite Internet | 1,838 | 5.3% |
| No Internet | 5,204 | 14.9% |
| Total | 34,830 | 100.0% |
Yakima Summary
Yakima is a city located in the central part of Washington State in the United States. It is the county seat of Yakima County and the eleventh largest city in the state. The city is situated in the Yakima Valley, which is known for its agricultural production, particularly apples, hops, and wine grapes. The city is also home to a number of industries, including aerospace, manufacturing, and technology.
History
The Yakima Valley was first inhabited by the Yakama people, who were part of the Sahaptin-speaking peoples of the Columbia Plateau. The Yakama people were hunter-gatherers who lived in the area for thousands of years before the arrival of European settlers. The first Europeans to settle in the area were fur traders and missionaries in the early 1800s. The first permanent settlement in the area was established in 1853 by a group of settlers from the Oregon Territory. The settlement was named Yakima, after the Yakama people.
The city of Yakima was officially incorporated in 1886. The city quickly grew in size and population, and by the early 1900s, it had become a major agricultural center. The city was also home to a number of industries, including lumber mills, brickyards, and canneries.
Geography
Yakima is located in the Yakima Valley, which is part of the Columbia Plateau. The city is situated at the confluence of the Naches and Yakima Rivers. The city is surrounded by mountains, including the Cascade Range to the west and the Yakima Range to the east. The city has a total area of 28.2 square miles, of which 27.9 square miles is land and 0.3 square miles is water.
Economy
Yakima’s economy is largely based on agriculture. The city is home to a number of agricultural businesses, including fruit and vegetable growers, wineries, and hop farms. The city is also home to a number of manufacturing and technology companies, including Boeing, Microsoft, and Amazon. The city is also home to a number of retail businesses, including shopping malls, restaurants, and entertainment venues.
Demographics
As of the 2010 census, the population of Yakima was 91,067. The racial makeup of the city was 73.3% White, 1.7% African American, 1.2% Native American, 1.7% Asian, 0.2% Pacific Islander, 19.2% from other races, and 3.7% from two or more races. The median household income in the city was $41,945, and the median family income was $50,867. The per capita income in the city was $20,945.
Conclusion
Yakima is a city located in the central part of Washington State in the United States. It is the county seat of Yakima County and the eleventh largest city in the state. The city is situated in the Yakima Valley, which is known for its agricultural production, particularly apples, hops, and wine grapes. The city is also home to a number of industries, including aerospace, manufacturing, and technology. The population of Yakima was 91,067 as of the 2010 census, and the median household income was $41,945. The city’s economy is largely based on agriculture, and it is also home to a number of manufacturing and technology companies.
Common Questions
What is Per Capita Income in Yakima?
Per Capita income in Yakima is $27,253.
What is the Median Family Income in Yakima?
Median Family Income in Yakima is $67,644.
What is the Median Household income in Yakima?
Median Household Income in Yakima is $55,734.
What is Income or Wage Gap in Yakima?
Income or Wage Gap in Yakima is 15.3%.
Women in Yakima earn 84.7 cents for every dollar earned by a man.
What is Family Income Deficit in Yakima?
Family Income Deficit in Yakima is $9,805.
Families that are below poverty line in Yakima earn $9,805 less on average than the poverty threshold level.
What is Inequality or Gini Index in Yakima?
Inequality or Gini Index in Yakima is 0.44.
What is the Total Population of Yakima?
Total Population of Yakima is 96,764.
What is the Total Male Population of Yakima?
Total Male Population of Yakima is 48,341.
What is the Total Female Population of Yakima?
Total Female Population of Yakima is 48,423.
What is the Ratio of Males per 100 Females in Yakima?
There are 99.83 Males per 100 Females in Yakima.
What is the Ratio of Females per 100 Males in Yakima?
There are 100.17 Females per 100 Males in Yakima.
What is the Median Population Age in Yakima?
Median Population Age in Yakima is 33.9 Years.
What is the Average Family Size in Yakima
Average Family Size in Yakima is 3.4 People.
What is the Average Household Size in Yakima
Average Household Size in Yakima is 2.7 People.
How Large is the Labor Force in Yakima?
There are 42,706 People in the Labor Forcein in Yakima.
What is the Percentage of People in the Labor Force in Yakima?
58.9% of People are in the Labor Force in Yakima.
What is the Unemployment Rate in Yakima?
Unemployment Rate in Yakima is 8.1%.