Cities with the Highest Percentage of Births to Unmarried Women over the Age of 35 in Texas
RELATED REPORTS & OPTIONS
Highest Illegitimacy | Women 35+
Texas
Compare Cities
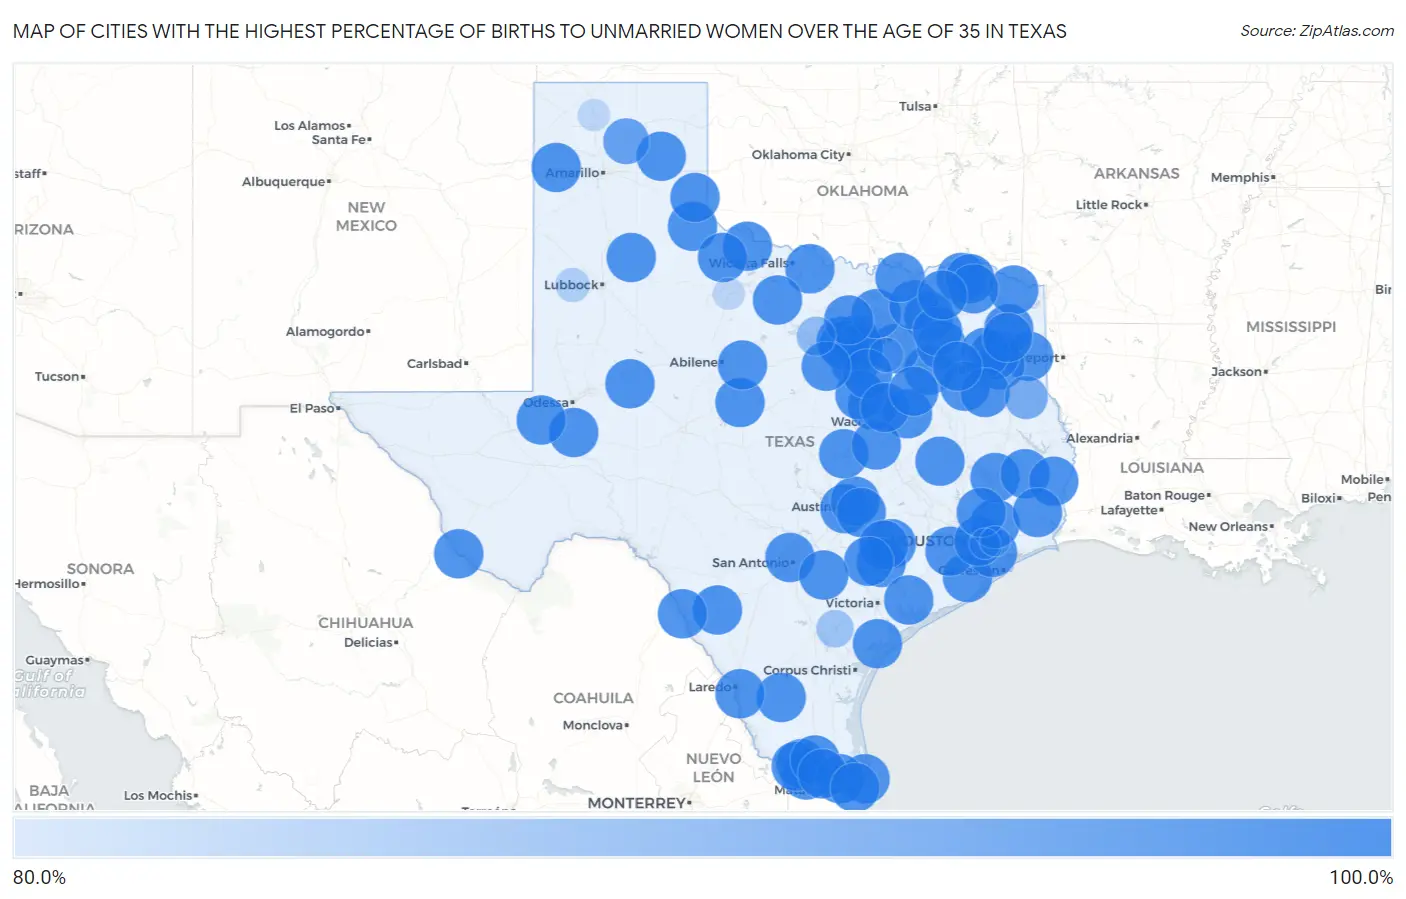
Map of Cities with the Highest Percentage of Births to Unmarried Women over the Age of 35 in Texas
0.0%
100.0%
Cities with the Highest Percentage of Births to Unmarried Women over the Age of 35 in Texas
| City | % Unmarried | vs State | vs National | |
| 1. | Greenville | 100.0% | 19.4%(+80.6)#1 | 20.1%(+79.9)#16 |
| 2. | Paris | 100.0% | 19.4%(+80.6)#2 | 20.1%(+79.9)#24 |
| 3. | Marshall | 100.0% | 19.4%(+80.6)#3 | 20.1%(+79.9)#26 |
| 4. | Angleton | 100.0% | 19.4%(+80.6)#4 | 20.1%(+79.9)#45 |
| 5. | Hidalgo | 100.0% | 19.4%(+80.6)#5 | 20.1%(+79.9)#97 |
| 6. | Seabrook | 100.0% | 19.4%(+80.6)#6 | 20.1%(+79.9)#107 |
| 7. | Kilgore | 100.0% | 19.4%(+80.6)#7 | 20.1%(+79.9)#110 |
| 8. | Richmond | 100.0% | 19.4%(+80.6)#8 | 20.1%(+79.9)#132 |
| 9. | Town Of Pecos | 100.0% | 19.4%(+80.6)#9 | 20.1%(+79.9)#133 |
| 10. | Hornsby Bend | 100.0% | 19.4%(+80.6)#10 | 20.1%(+79.9)#152 |
| 11. | La Homa | 100.0% | 19.4%(+80.6)#11 | 20.1%(+79.9)#164 |
| 12. | Galena Park | 100.0% | 19.4%(+80.6)#12 | 20.1%(+79.9)#165 |
| 13. | Elgin | 100.0% | 19.4%(+80.6)#13 | 20.1%(+79.9)#184 |
| 14. | Vernon | 100.0% | 19.4%(+80.6)#14 | 20.1%(+79.9)#185 |
| 15. | Dayton | 100.0% | 19.4%(+80.6)#15 | 20.1%(+79.9)#219 |
| 16. | Joshua | 100.0% | 19.4%(+80.6)#16 | 20.1%(+79.9)#244 |
| 17. | River Oaks | 100.0% | 19.4%(+80.6)#17 | 20.1%(+79.9)#260 |
| 18. | Camp Swift | 100.0% | 19.4%(+80.6)#18 | 20.1%(+79.9)#281 |
| 19. | Mexia | 100.0% | 19.4%(+80.6)#19 | 20.1%(+79.9)#282 |
| 20. | Crystal City | 100.0% | 19.4%(+80.6)#20 | 20.1%(+79.9)#298 |
| 21. | Penitas | 100.0% | 19.4%(+80.6)#21 | 20.1%(+79.9)#299 |
| 22. | Gun Barrel City | 100.0% | 19.4%(+80.6)#22 | 20.1%(+79.9)#307 |
| 23. | Gladewater | 100.0% | 19.4%(+80.6)#23 | 20.1%(+79.9)#310 |
| 24. | Nolanville | 100.0% | 19.4%(+80.6)#24 | 20.1%(+79.9)#313 |
| 25. | Doolittle | 100.0% | 19.4%(+80.6)#25 | 20.1%(+79.9)#318 |
| 26. | Childress | 100.0% | 19.4%(+80.6)#26 | 20.1%(+79.9)#334 |
| 27. | Livingston | 100.0% | 19.4%(+80.6)#27 | 20.1%(+79.9)#343 |
| 28. | Hutchins | 100.0% | 19.4%(+80.6)#28 | 20.1%(+79.9)#345 |
| 29. | Port Isabel | 100.0% | 19.4%(+80.6)#29 | 20.1%(+79.9)#376 |
| 30. | Willow Park | 100.0% | 19.4%(+80.6)#30 | 20.1%(+79.9)#383 |
| 31. | Aledo | 100.0% | 19.4%(+80.6)#31 | 20.1%(+79.9)#384 |
| 32. | Madisonville | 100.0% | 19.4%(+80.6)#32 | 20.1%(+79.9)#420 |
| 33. | Hebbronville | 100.0% | 19.4%(+80.6)#33 | 20.1%(+79.9)#429 |
| 34. | Coleman | 100.0% | 19.4%(+80.6)#34 | 20.1%(+79.9)#458 |
| 35. | Rosita | 100.0% | 19.4%(+80.6)#35 | 20.1%(+79.9)#477 |
| 36. | Edgecliff Village | 100.0% | 19.4%(+80.6)#36 | 20.1%(+79.9)#478 |
| 37. | Crane | 100.0% | 19.4%(+80.6)#37 | 20.1%(+79.9)#498 |
| 38. | Presidio | 100.0% | 19.4%(+80.6)#38 | 20.1%(+79.9)#509 |
| 39. | Henrietta | 100.0% | 19.4%(+80.6)#39 | 20.1%(+79.9)#533 |
| 40. | Woodville | 100.0% | 19.4%(+80.6)#40 | 20.1%(+79.9)#536 |
| 41. | Reno City Parker And Tarrant Counties | 100.0% | 19.4%(+80.6)#41 | 20.1%(+79.9)#541 |
| 42. | Olney | 100.0% | 19.4%(+80.6)#42 | 20.1%(+79.9)#544 |
| 43. | The Homesteads | 100.0% | 19.4%(+80.6)#43 | 20.1%(+79.9)#546 |
| 44. | Shady Shores | 100.0% | 19.4%(+80.6)#44 | 20.1%(+79.9)#569 |
| 45. | La Paloma | 100.0% | 19.4%(+80.6)#45 | 20.1%(+79.9)#570 |
| 46. | Weimar | 100.0% | 19.4%(+80.6)#46 | 20.1%(+79.9)#575 |
| 47. | Hallettsville | 100.0% | 19.4%(+80.6)#47 | 20.1%(+79.9)#584 |
| 48. | Balcones Heights | 100.0% | 19.4%(+80.6)#48 | 20.1%(+79.9)#585 |
| 49. | Schulenburg | 100.0% | 19.4%(+80.6)#49 | 20.1%(+79.9)#599 |
| 50. | Floydada | 100.0% | 19.4%(+80.6)#50 | 20.1%(+79.9)#601 |
| 51. | West | 100.0% | 19.4%(+80.6)#51 | 20.1%(+79.9)#619 |
| 52. | Kirbyville | 100.0% | 19.4%(+80.6)#52 | 20.1%(+79.9)#655 |
| 53. | Whitney | 100.0% | 19.4%(+80.6)#53 | 20.1%(+79.9)#656 |
| 54. | Wellington | 100.0% | 19.4%(+80.6)#54 | 20.1%(+79.9)#669 |
| 55. | Shiner | 100.0% | 19.4%(+80.6)#55 | 20.1%(+79.9)#691 |
| 56. | Llano Grande | 100.0% | 19.4%(+80.6)#56 | 20.1%(+79.9)#701 |
| 57. | Grandview | 100.0% | 19.4%(+80.6)#57 | 20.1%(+79.9)#718 |
| 58. | Baird | 100.0% | 19.4%(+80.6)#58 | 20.1%(+79.9)#773 |
| 59. | Edgewood | 100.0% | 19.4%(+80.6)#59 | 20.1%(+79.9)#774 |
| 60. | Lone Star | 100.0% | 19.4%(+80.6)#60 | 20.1%(+79.9)#793 |
| 61. | Woodbranch | 100.0% | 19.4%(+80.6)#61 | 20.1%(+79.9)#803 |
| 62. | De Kalb | 100.0% | 19.4%(+80.6)#62 | 20.1%(+79.9)#805 |
| 63. | Aurora | 100.0% | 19.4%(+80.6)#63 | 20.1%(+79.9)#817 |
| 64. | Big Sandy | 100.0% | 19.4%(+80.6)#64 | 20.1%(+79.9)#840 |
| 65. | Stockdale | 100.0% | 19.4%(+80.6)#65 | 20.1%(+79.9)#867 |
| 66. | Tolar | 100.0% | 19.4%(+80.6)#66 | 20.1%(+79.9)#868 |
| 67. | Blossom | 100.0% | 19.4%(+80.6)#67 | 20.1%(+79.9)#895 |
| 68. | Berryville | 100.0% | 19.4%(+80.6)#68 | 20.1%(+79.9)#916 |
| 69. | Blue Ridge | 100.0% | 19.4%(+80.6)#69 | 20.1%(+79.9)#981 |
| 70. | Ore City | 100.0% | 19.4%(+80.6)#70 | 20.1%(+79.9)#1,001 |
| 71. | Reid Hope King | 100.0% | 19.4%(+80.6)#71 | 20.1%(+79.9)#1,002 |
| 72. | East Tawakoni | 100.0% | 19.4%(+80.6)#72 | 20.1%(+79.9)#1,014 |
| 73. | Deport | 100.0% | 19.4%(+80.6)#73 | 20.1%(+79.9)#1,067 |
| 74. | Crowell | 100.0% | 19.4%(+80.6)#74 | 20.1%(+79.9)#1,070 |
| 75. | New Summerfield | 100.0% | 19.4%(+80.6)#75 | 20.1%(+79.9)#1,123 |
| 76. | Lott | 100.0% | 19.4%(+80.6)#76 | 20.1%(+79.9)#1,134 |
| 77. | Thorntonville | 100.0% | 19.4%(+80.6)#77 | 20.1%(+79.9)#1,137 |
| 78. | Knollwood | 100.0% | 19.4%(+80.6)#78 | 20.1%(+79.9)#1,217 |
| 79. | Lefors | 100.0% | 19.4%(+80.6)#79 | 20.1%(+79.9)#1,230 |
| 80. | Forsan | 100.0% | 19.4%(+80.6)#80 | 20.1%(+79.9)#1,268 |
| 81. | Mount Calm | 100.0% | 19.4%(+80.6)#81 | 20.1%(+79.9)#1,270 |
| 82. | Edom | 100.0% | 19.4%(+80.6)#82 | 20.1%(+79.9)#1,312 |
| 83. | Rose Hill Acres | 100.0% | 19.4%(+80.6)#83 | 20.1%(+79.9)#1,318 |
| 84. | Holiday Beach | 100.0% | 19.4%(+80.6)#84 | 20.1%(+79.9)#1,319 |
| 85. | La Ward | 100.0% | 19.4%(+80.6)#85 | 20.1%(+79.9)#1,351 |
| 86. | La Presa | 100.0% | 19.4%(+80.6)#86 | 20.1%(+79.9)#1,375 |
| 87. | Pecan Gap | 100.0% | 19.4%(+80.6)#87 | 20.1%(+79.9)#1,386 |
| 88. | Navarro | 100.0% | 19.4%(+80.6)#88 | 20.1%(+79.9)#1,398 |
| 89. | Adrian | 100.0% | 19.4%(+80.6)#89 | 20.1%(+79.9)#1,402 |
| 90. | Harrold | 100.0% | 19.4%(+80.6)#90 | 20.1%(+79.9)#1,420 |
| 91. | Borger | 96.3% | 19.4%(+76.9)#91 | 20.1%(+76.2)#1,453 |
| 92. | Timpson | 93.3% | 19.4%(+73.9)#92 | 20.1%(+73.2)#1,466 |
| 93. | Mineral Wells | 89.2% | 19.4%(+69.8)#93 | 20.1%(+69.1)#1,486 |
| 94. | Beeville | 87.3% | 19.4%(+67.9)#94 | 20.1%(+67.2)#1,501 |
| 95. | Glenn Heights | 84.4% | 19.4%(+65.0)#95 | 20.1%(+64.3)#1,517 |
| 96. | Levelland | 84.3% | 19.4%(+64.9)#96 | 20.1%(+64.2)#1,518 |
| 97. | Cactus | 82.2% | 19.4%(+62.8)#97 | 20.1%(+62.1)#1,537 |
| 98. | Munday | 82.1% | 19.4%(+62.7)#98 | 20.1%(+62.0)#1,539 |
| 99. | Deer Park | 80.5% | 19.4%(+61.1)#99 | 20.1%(+60.4)#1,553 |
| 100. | Baytown | 80.0% | 19.4%(+60.6)#100 | 20.1%(+59.9)#1,556 |
Common Questions
What are the Top 10 Cities with the Highest Percentage of Births to Unmarried Women over the Age of 35 in Texas?
Top 10 Cities with the Highest Percentage of Births to Unmarried Women over the Age of 35 in Texas are:
#1
100.0%
#2
100.0%
#3
100.0%
#4
100.0%
#5
100.0%
#6
100.0%
#7
100.0%
#8
100.0%
#9
100.0%
#10
100.0%
What city has the Highest Percentage of Births to Unmarried Women over the Age of 35 in Texas?
Greenville has the Highest Percentage of Births to Unmarried Women over the Age of 35 in Texas with 100.0%.
What is the Percentage of Births to Unmarried Women over the Age of 35 in the State of Texas?
Percentage of Births to Unmarried Women over the Age of 35 in Texas is 19.4%.
What is the Percentage of Births to Unmarried Women over the Age of 35 in the United States?
Percentage of Births to Unmarried Women over the Age of 35 in the United States is 20.1%.