Hatton, WA Map & Demographics
Hatton Map
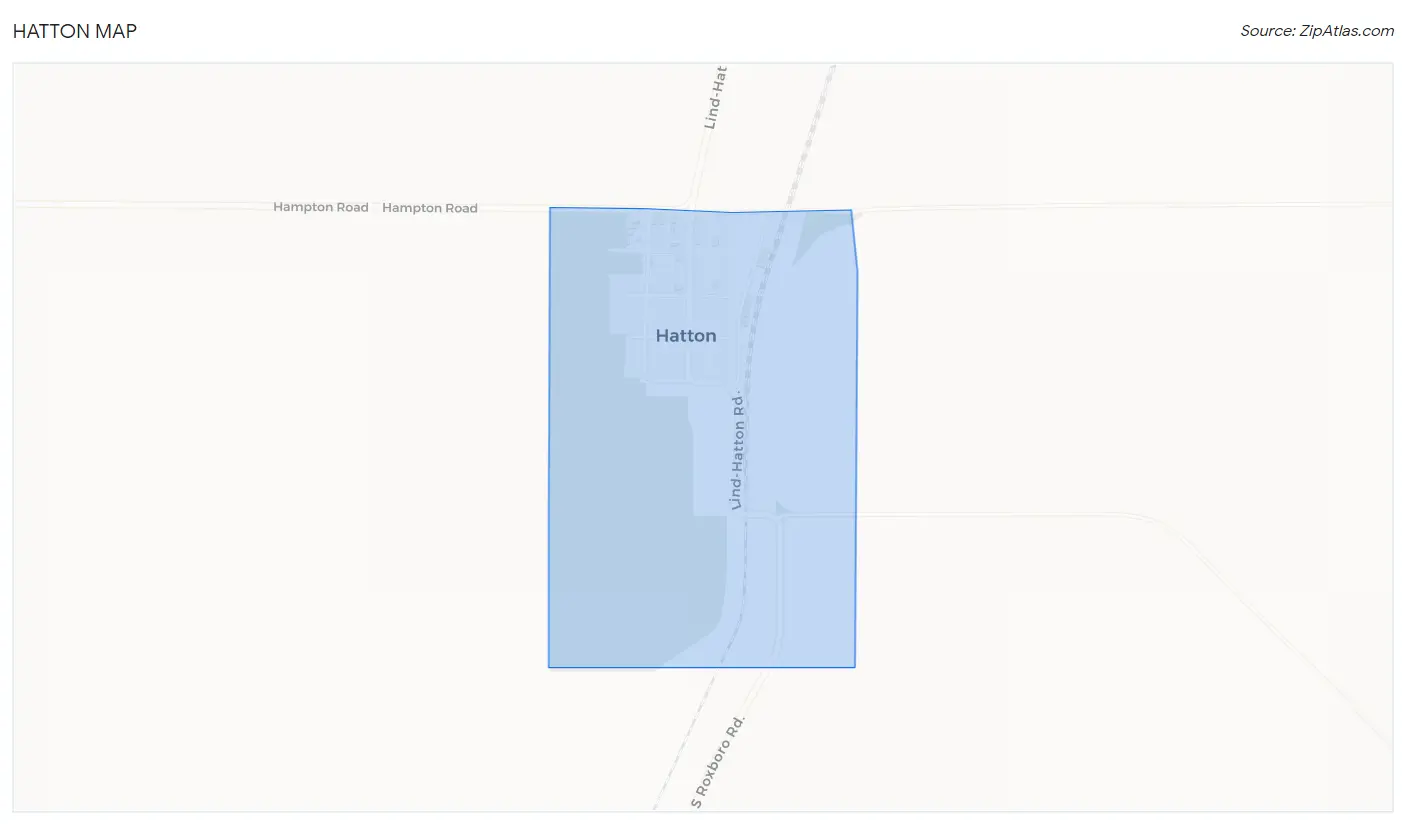
Hatton Overview
$19,264
PER CAPITA INCOME
$86,205
AVG FAMILY INCOME
$85,848
AVG HOUSEHOLD INCOME
33.4%
WAGE / INCOME GAP [ % ]
66.6¢/ $1
WAGE / INCOME GAP [ $ ]
0.20
INEQUALITY / GINI INDEX
492
TOTAL POPULATION
260
MALE POPULATION
232
FEMALE POPULATION
112.07
MALES / 100 FEMALES
89.23
FEMALES / 100 MALES
21.8
MEDIAN AGE
10.0
AVG FAMILY SIZE
8.9
AVG HOUSEHOLD SIZE
248
LABOR FORCE [ PEOPLE ]
77.3%
PERCENT IN LABOR FORCE
Hatton Area Codes
Income in Hatton
Income Overview in Hatton
Per Capita Income in Hatton is $19,264, while median incomes of families and households are $86,205 and $85,848 respectively.
| Characteristic | Number | Measure |
| Per Capita Income | 492 | $19,264 |
| Median Family Income | 47 | $86,205 |
| Mean Family Income | 47 | $76,436 |
| Median Household Income | 55 | $85,848 |
| Mean Household Income | 55 | $73,675 |
| Income Deficit | 47 | $0 |
| Wage / Income Gap (%) | 492 | 33.44% |
| Wage / Income Gap ($) | 492 | 66.56¢ per $1 |
| Gini / Inequality Index | 492 | 0.20 |
Earnings by Sex in Hatton
Average Earnings in Hatton are $33,971, $33,725 for men and $50,665 for women, a difference of 33.4%.
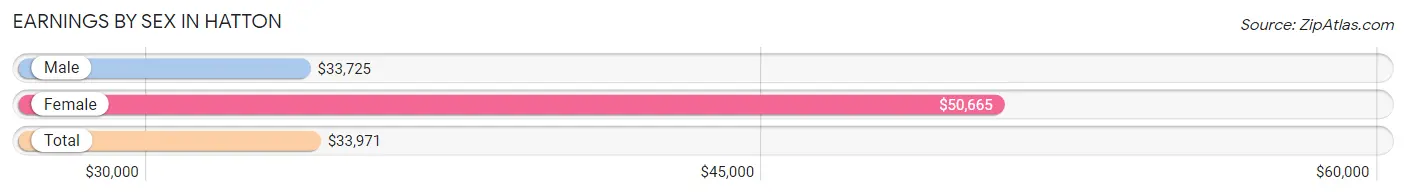
| Sex | Number | Average Earnings |
| Male | 181 (72.4%) | $33,725 |
| Female | 69 (27.6%) | $50,665 |
| Total | 250 (100.0%) | $33,971 |
Earnings by Sex by Income Bracket in Hatton
The most common earnings brackets in Hatton are $30,000 to $34,999 for men (152 | 84.0%) and $50,000 to $54,999 for women (47 | 68.1%).
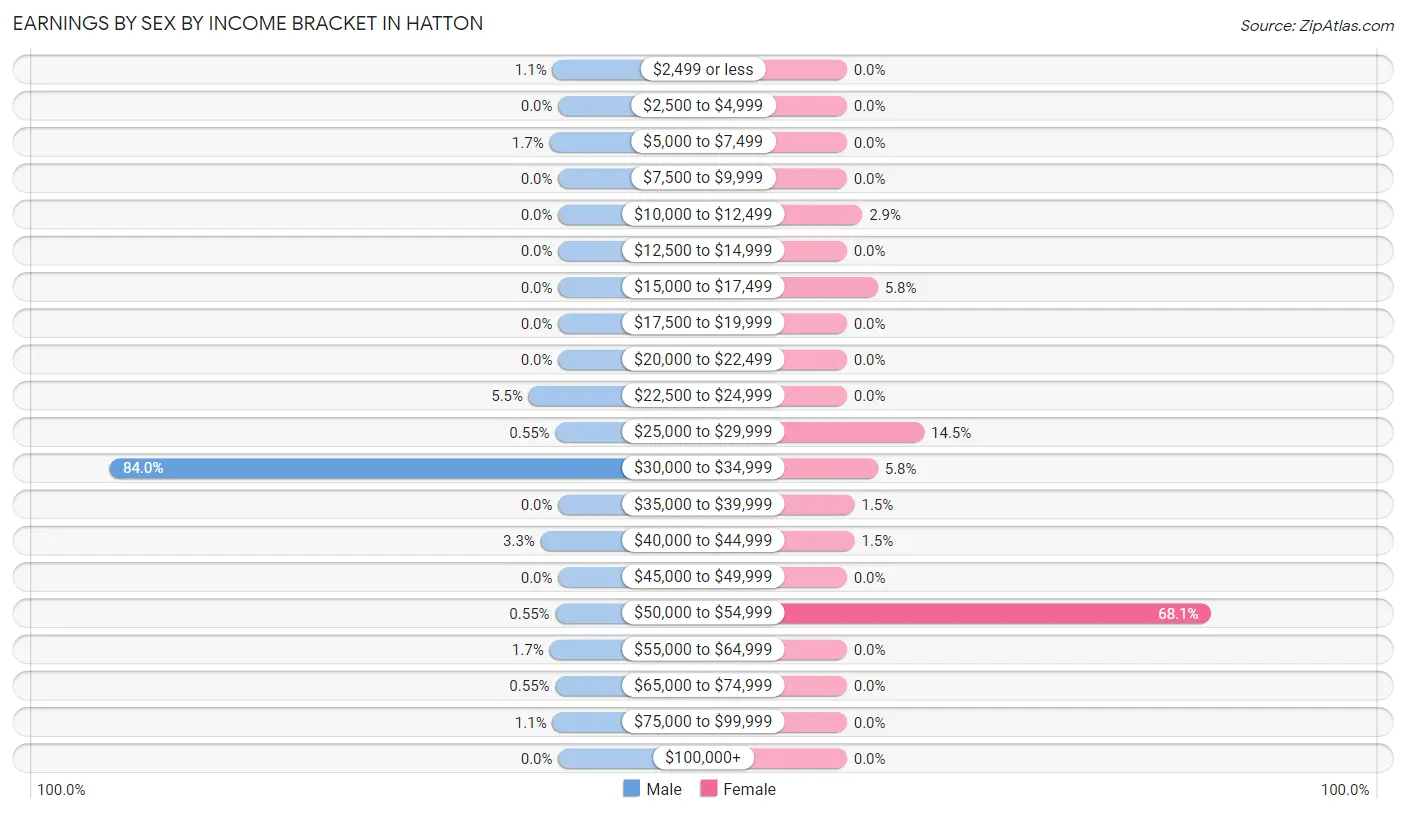
| Income | Male | Female |
| $2,499 or less | 2 (1.1%) | 0 (0.0%) |
| $2,500 to $4,999 | 0 (0.0%) | 0 (0.0%) |
| $5,000 to $7,499 | 3 (1.7%) | 0 (0.0%) |
| $7,500 to $9,999 | 0 (0.0%) | 0 (0.0%) |
| $10,000 to $12,499 | 0 (0.0%) | 2 (2.9%) |
| $12,500 to $14,999 | 0 (0.0%) | 0 (0.0%) |
| $15,000 to $17,499 | 0 (0.0%) | 4 (5.8%) |
| $17,500 to $19,999 | 0 (0.0%) | 0 (0.0%) |
| $20,000 to $22,499 | 0 (0.0%) | 0 (0.0%) |
| $22,500 to $24,999 | 10 (5.5%) | 0 (0.0%) |
| $25,000 to $29,999 | 1 (0.5%) | 10 (14.5%) |
| $30,000 to $34,999 | 152 (84.0%) | 4 (5.8%) |
| $35,000 to $39,999 | 0 (0.0%) | 1 (1.5%) |
| $40,000 to $44,999 | 6 (3.3%) | 1 (1.5%) |
| $45,000 to $49,999 | 0 (0.0%) | 0 (0.0%) |
| $50,000 to $54,999 | 1 (0.5%) | 47 (68.1%) |
| $55,000 to $64,999 | 3 (1.7%) | 0 (0.0%) |
| $65,000 to $74,999 | 1 (0.5%) | 0 (0.0%) |
| $75,000 to $99,999 | 2 (1.1%) | 0 (0.0%) |
| $100,000+ | 0 (0.0%) | 0 (0.0%) |
| Total | 181 (100.0%) | 69 (100.0%) |
Earnings by Sex by Educational Attainment in Hatton
Average earnings in Hatton are $33,758 for men and $28,875 for women, a difference of 14.5%. Men with an educational attainment of less than high school enjoy the highest average annual earnings of $33,775, while those with less than high school education earn the least with $33,775. Women with an educational attainment of high school diploma earn the most with the average annual earnings of $29,750, while those with less than high school education have the smallest earnings of $22,500.
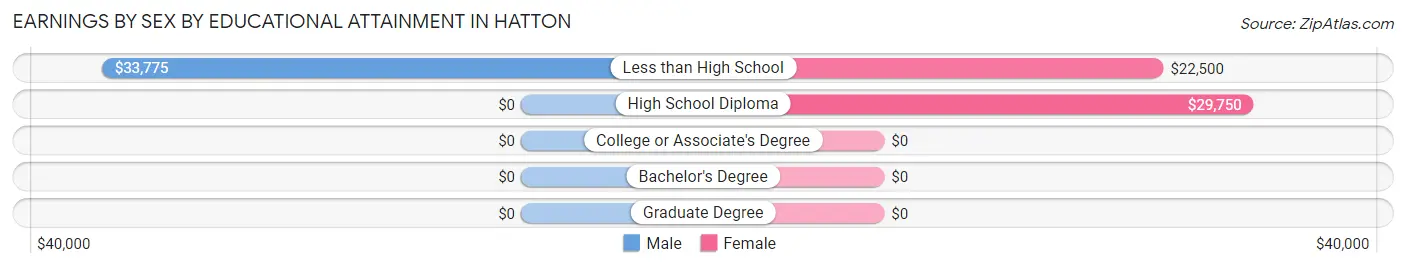
| Educational Attainment | Male Income | Female Income |
| Less than High School | $33,775 | $22,500 |
| High School Diploma | - | - |
| College or Associate's Degree | - | - |
| Bachelor's Degree | - | - |
| Graduate Degree | - | - |
| Total | $33,758 | $28,875 |
Family Income in Hatton
Family Income Brackets in Hatton
According to the Hatton family income data, there are 30 families falling into the $75,000 to $99,999 income range, which is the most common income bracket and makes up 63.8% of all families.
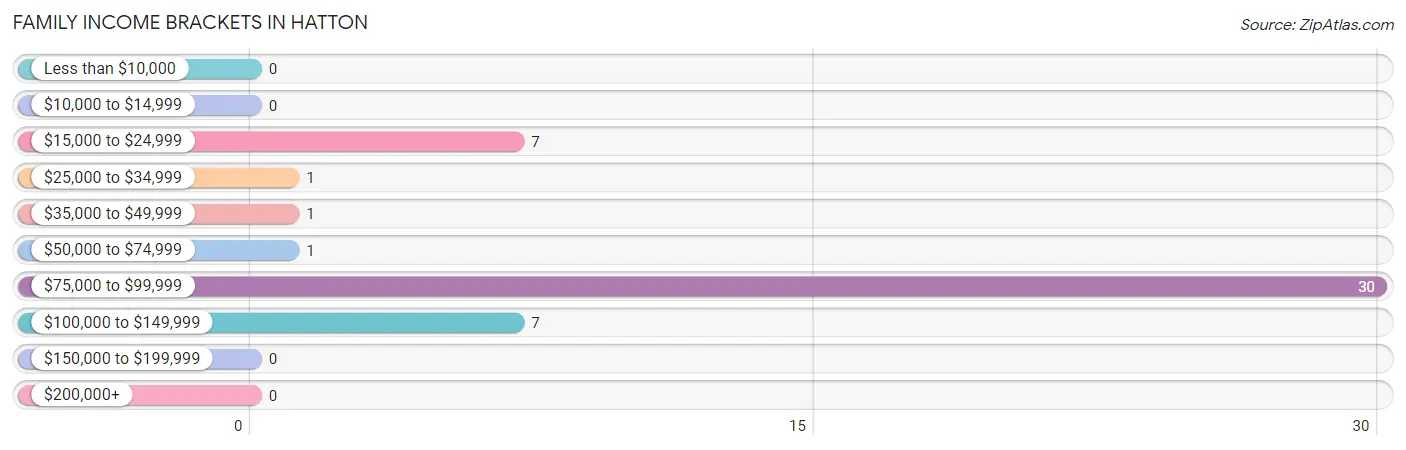
| Income Bracket | # Families | % Families |
| Less than $10,000 | 0 | 0.0% |
| $10,000 to $14,999 | 0 | 0.0% |
| $15,000 to $24,999 | 7 | 14.9% |
| $25,000 to $34,999 | 1 | 2.1% |
| $35,000 to $49,999 | 1 | 2.1% |
| $50,000 to $74,999 | 1 | 2.1% |
| $75,000 to $99,999 | 30 | 63.8% |
| $100,000 to $149,999 | 7 | 14.9% |
| $150,000 to $199,999 | 0 | 0.0% |
| $200,000+ | 0 | 0.0% |
Family Income by Famaliy Size in Hatton
2-person families (4 | 8.5%) account for the highest median family income in Hatton with $103,750 per family, while 2-person families (4 | 8.5%) have the highest median income of $51,875 per family member.
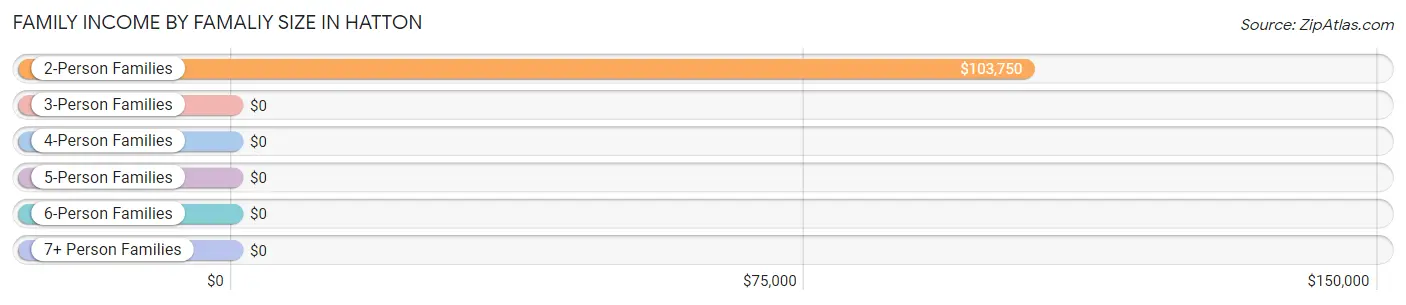
| Income Bracket | # Families | Median Income |
| 2-Person Families | 4 (8.5%) | $103,750 |
| 3-Person Families | 4 (8.5%) | $0 |
| 4-Person Families | 1 (2.1%) | $0 |
| 5-Person Families | 8 (17.0%) | $0 |
| 6-Person Families | 25 (53.2%) | $0 |
| 7+ Person Families | 5 (10.6%) | $0 |
| Total | 47 (100.0%) | $86,205 |
Family Income by Number of Earners in Hatton
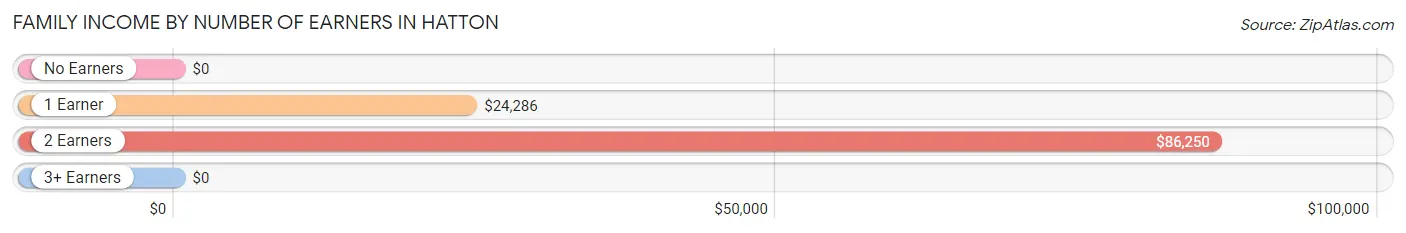
| Number of Earners | # Families | Median Income |
| No Earners | 0 (0.0%) | $0 |
| 1 Earner | 10 (21.3%) | $24,286 |
| 2 Earners | 32 (68.1%) | $86,250 |
| 3+ Earners | 5 (10.6%) | $0 |
| Total | 47 (100.0%) | $86,205 |
Household Income in Hatton
Household Income Brackets in Hatton
With 28 households falling in the category, the $75,000 to $99,999 income range is the most frequent in Hatton, accounting for 50.9% of all households.
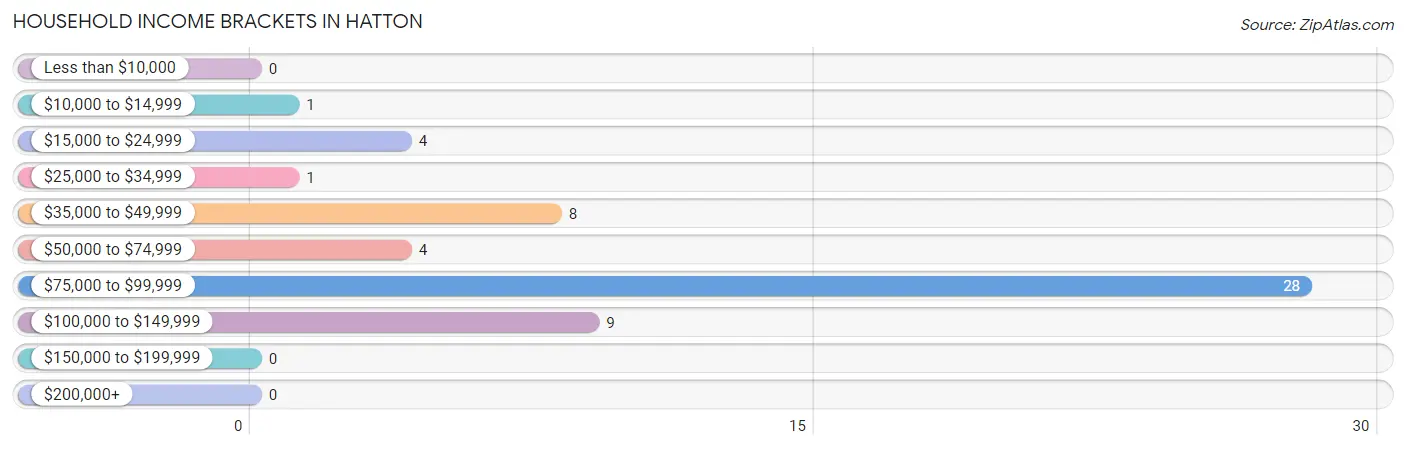
| Income Bracket | # Households | % Households |
| Less than $10,000 | 0 | 0.0% |
| $10,000 to $14,999 | 1 | 1.8% |
| $15,000 to $24,999 | 4 | 7.3% |
| $25,000 to $34,999 | 1 | 1.8% |
| $35,000 to $49,999 | 8 | 14.5% |
| $50,000 to $74,999 | 4 | 7.3% |
| $75,000 to $99,999 | 28 | 50.9% |
| $100,000 to $149,999 | 9 | 16.4% |
| $150,000 to $199,999 | 0 | 0.0% |
| $200,000+ | 0 | 0.0% |
Household Income by Householder Age in Hatton
The median household income in Hatton is $85,848, with the highest median household income of $86,000 found in the 25 to 44 years age bracket for the primary householder. A total of 46 households (83.6%) fall into this category.
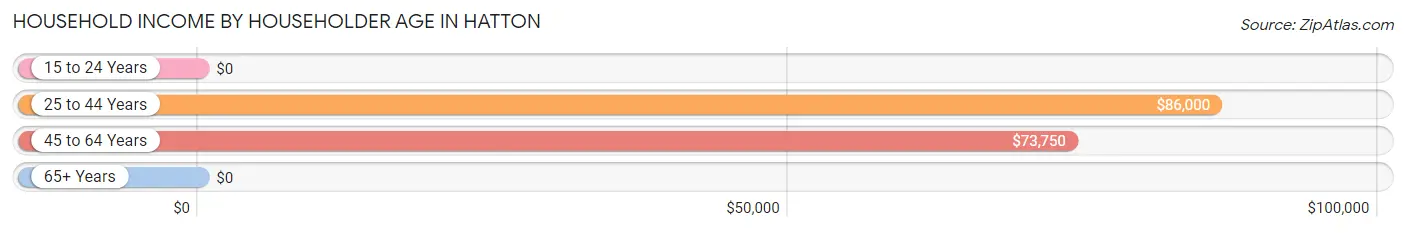
| Income Bracket | # Households | Median Income |
| 15 to 24 Years | 0 (0.0%) | $0 |
| 25 to 44 Years | 46 (83.6%) | $86,000 |
| 45 to 64 Years | 8 (14.5%) | $73,750 |
| 65+ Years | 1 (1.8%) | $0 |
| Total | 55 (100.0%) | $85,848 |
Poverty in Hatton
Income Below Poverty by Sex and Age in Hatton
With 10.0% poverty level for males and 10.8% for females among the residents of Hatton, 15 year old males and 16 and 17 year old females are the most vulnerable to poverty, with 2 males (100.0%) and 1 females (100.0%) in their respective age groups living below the poverty level.
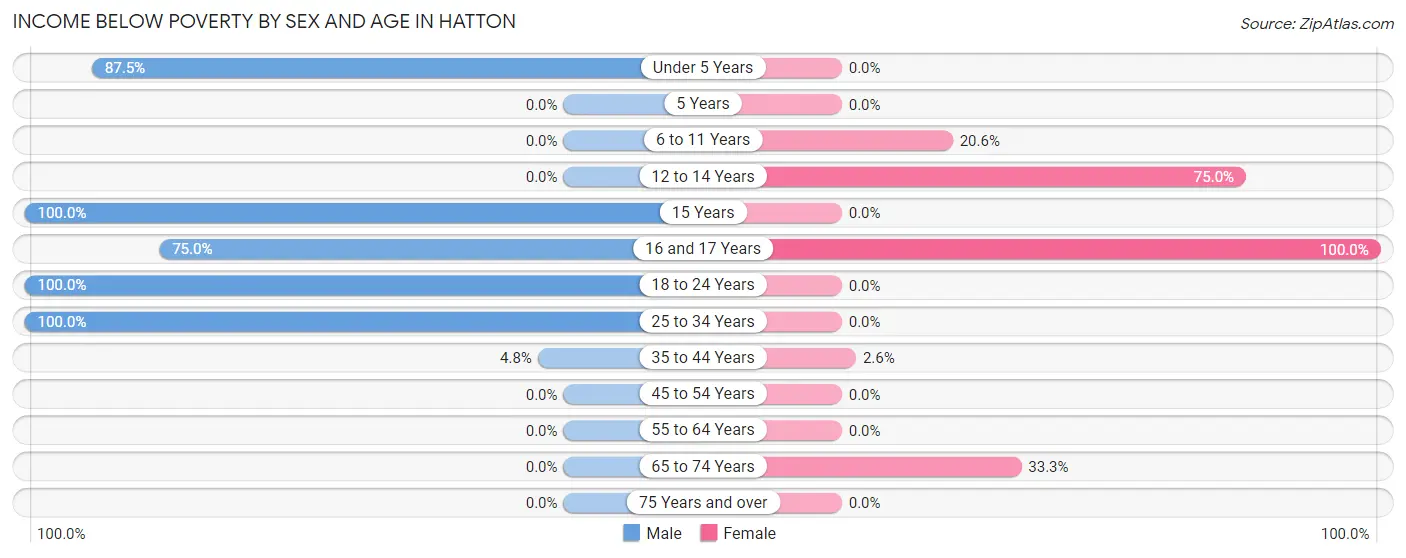
| Age Bracket | Male | Female |
| Under 5 Years | 7 (87.5%) | 0 (0.0%) |
| 5 Years | 0 (0.0%) | 0 (0.0%) |
| 6 to 11 Years | 0 (0.0%) | 7 (20.6%) |
| 12 to 14 Years | 0 (0.0%) | 15 (75.0%) |
| 15 Years | 2 (100.0%) | 0 (0.0%) |
| 16 and 17 Years | 6 (75.0%) | 1 (100.0%) |
| 18 to 24 Years | 2 (100.0%) | 0 (0.0%) |
| 25 to 34 Years | 1 (100.0%) | 0 (0.0%) |
| 35 to 44 Years | 8 (4.8%) | 1 (2.6%) |
| 45 to 54 Years | 0 (0.0%) | 0 (0.0%) |
| 55 to 64 Years | 0 (0.0%) | 0 (0.0%) |
| 65 to 74 Years | 0 (0.0%) | 1 (33.3%) |
| 75 Years and over | 0 (0.0%) | 0 (0.0%) |
| Total | 26 (10.0%) | 25 (10.8%) |
Income Above Poverty by Sex and Age in Hatton
According to the poverty statistics in Hatton, males aged 12 to 14 years and females aged under 5 years are the age groups that are most secure financially, with 100.0% of males and 100.0% of females in these age groups living above the poverty line.
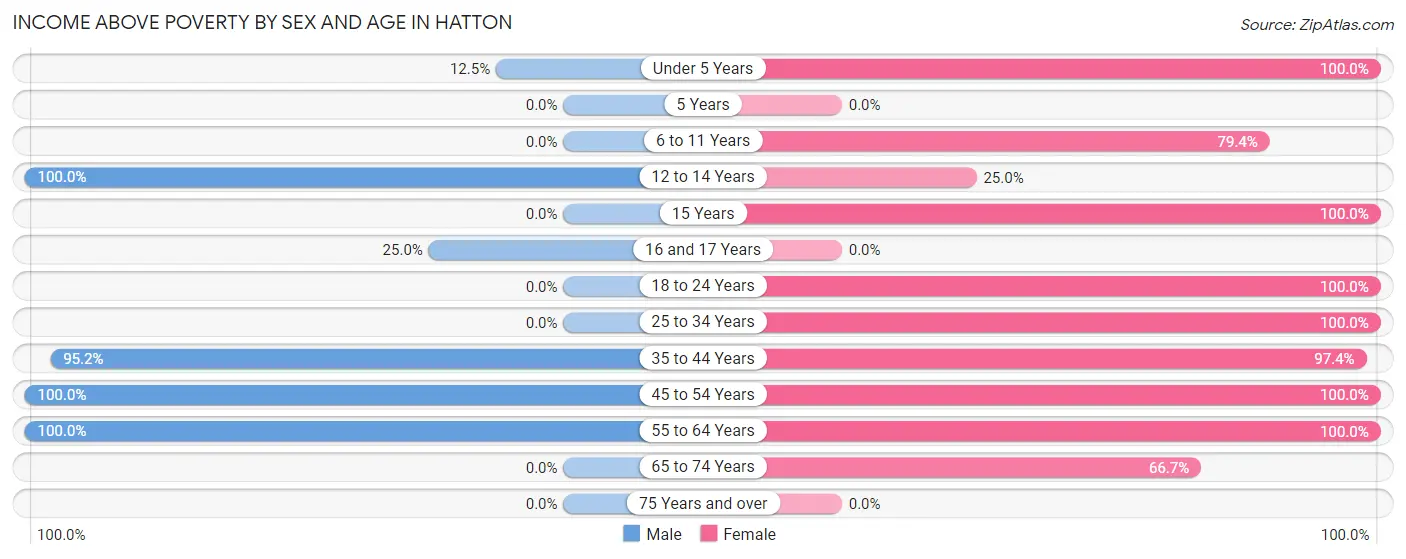
| Age Bracket | Male | Female |
| Under 5 Years | 1 (12.5%) | 8 (100.0%) |
| 5 Years | 0 (0.0%) | 0 (0.0%) |
| 6 to 11 Years | 0 (0.0%) | 27 (79.4%) |
| 12 to 14 Years | 63 (100.0%) | 5 (25.0%) |
| 15 Years | 0 (0.0%) | 36 (100.0%) |
| 16 and 17 Years | 2 (25.0%) | 0 (0.0%) |
| 18 to 24 Years | 0 (0.0%) | 75 (100.0%) |
| 25 to 34 Years | 0 (0.0%) | 12 (100.0%) |
| 35 to 44 Years | 160 (95.2%) | 37 (97.4%) |
| 45 to 54 Years | 4 (100.0%) | 1 (100.0%) |
| 55 to 64 Years | 4 (100.0%) | 4 (100.0%) |
| 65 to 74 Years | 0 (0.0%) | 2 (66.7%) |
| 75 Years and over | 0 (0.0%) | 0 (0.0%) |
| Total | 234 (90.0%) | 207 (89.2%) |
Income Below Poverty Among Married-Couple Families in Hatton
The poverty statistics for married-couple families in Hatton show that 2.9% or 1 of the total 35 families live below the poverty line. Families with 1 or 2 children have the highest poverty rate of 3.8%, comprising of 1 families. On the other hand, families with no children have the lowest poverty rate of 0.0%, which includes 0 families.
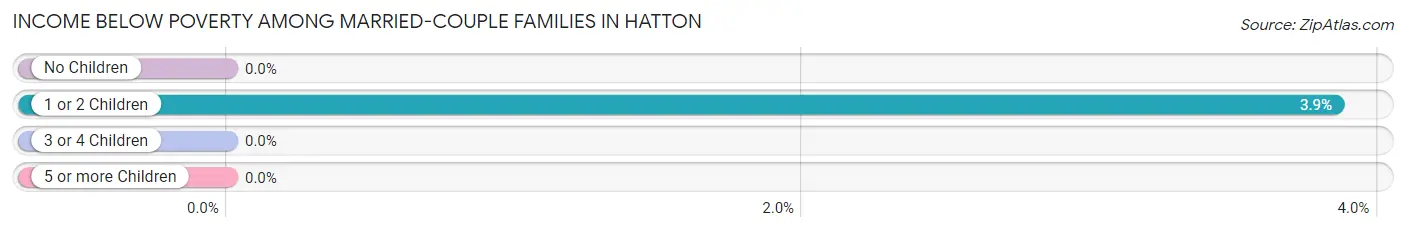
| Children | Above Poverty | Below Poverty |
| No Children | 4 (100.0%) | 0 (0.0%) |
| 1 or 2 Children | 25 (96.2%) | 1 (3.8%) |
| 3 or 4 Children | 0 (0.0%) | 0 (0.0%) |
| 5 or more Children | 5 (100.0%) | 0 (0.0%) |
| Total | 34 (97.1%) | 1 (2.9%) |
Income Below Poverty Among Single-Parent Households in Hatton
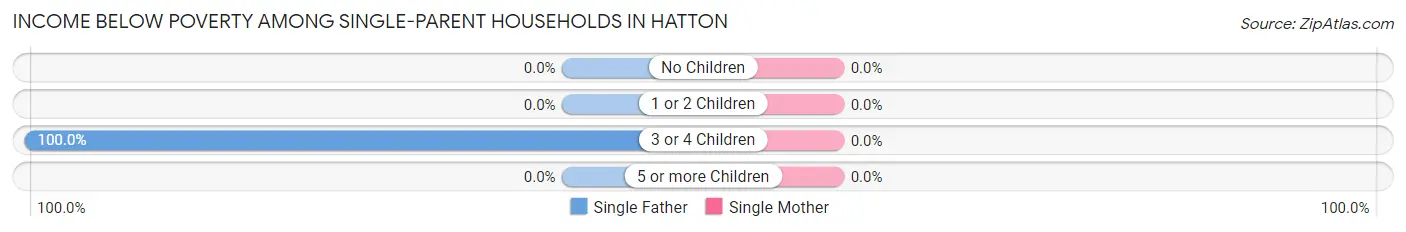
| Children | Single Father | Single Mother |
| No Children | 0 (0.0%) | 0 (0.0%) |
| 1 or 2 Children | 0 (0.0%) | 0 (0.0%) |
| 3 or 4 Children | 7 (100.0%) | 0 (0.0%) |
| 5 or more Children | 0 (0.0%) | 0 (0.0%) |
| Total | 7 (70.0%) | 0 (0.0%) |
Income Below Poverty Among Married-Couple vs Single-Parent Households in Hatton
The poverty data for Hatton shows that 1 of the married-couple family households (2.9%) and 7 of the single-parent households (58.3%) are living below the poverty level. Within the married-couple family households, those with 1 or 2 children have the highest poverty rate, with 1 households (3.8%) falling below the poverty line. Among the single-parent households, those with 3 or 4 children have the highest poverty rate, with 7 household (87.5%) living below poverty.
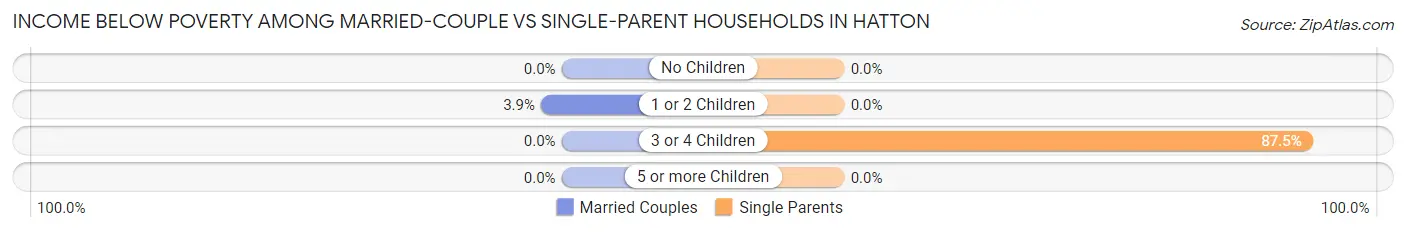
| Children | Married-Couple Families | Single-Parent Households |
| No Children | 0 (0.0%) | 0 (0.0%) |
| 1 or 2 Children | 1 (3.8%) | 0 (0.0%) |
| 3 or 4 Children | 0 (0.0%) | 7 (87.5%) |
| 5 or more Children | 0 (0.0%) | 0 (0.0%) |
| Total | 1 (2.9%) | 7 (58.3%) |
Race in Hatton
The most populous races in Hatton are Hispanic or Latino (469 | 95.3%), Some other Race (419 | 85.2%), and White / Caucasian (45 | 9.1%).
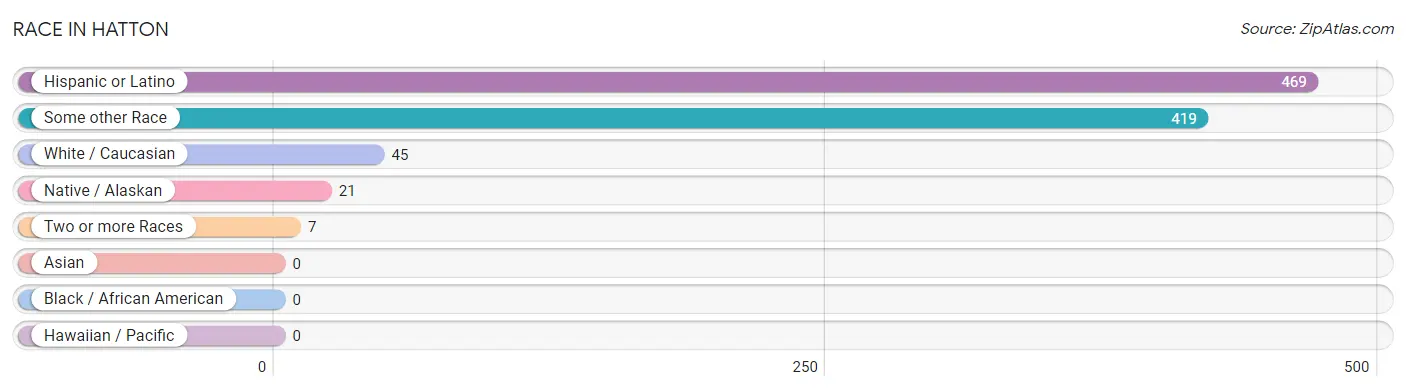
| Race | # Population | % Population |
| Asian | 0 | 0.0% |
| Black / African American | 0 | 0.0% |
| Hawaiian / Pacific | 0 | 0.0% |
| Hispanic or Latino | 469 | 95.3% |
| Native / Alaskan | 21 | 4.3% |
| White / Caucasian | 45 | 9.1% |
| Two or more Races | 7 | 1.4% |
| Some other Race | 419 | 85.2% |
| Total | 492 | 100.0% |
Ancestry in Hatton
The most populous ancestries reported in Hatton are Mexican (463 | 94.1%), English (9 | 1.8%), German (6 | 1.2%), French (5 | 1.0%), and Dutch (3 | 0.6%), together accounting for 98.8% of all Hatton residents.
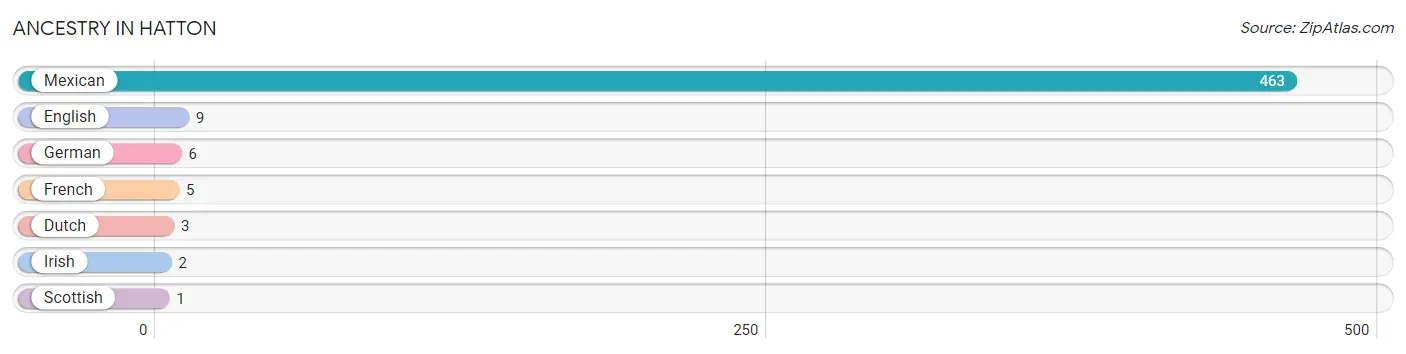
| Ancestry | # Population | % Population |
| Dutch | 3 | 0.6% |
| English | 9 | 1.8% |
| French | 5 | 1.0% |
| German | 6 | 1.2% |
| Irish | 2 | 0.4% |
| Mexican | 463 | 94.1% |
| Scottish | 1 | 0.2% | View All 7 Rows |
Immigrants in Hatton
The most numerous immigrant groups reported in Hatton came from Central America (197 | 40.0%), Latin America (197 | 40.0%), and Mexico (197 | 40.0%), together accounting for 120.1% of all Hatton residents.
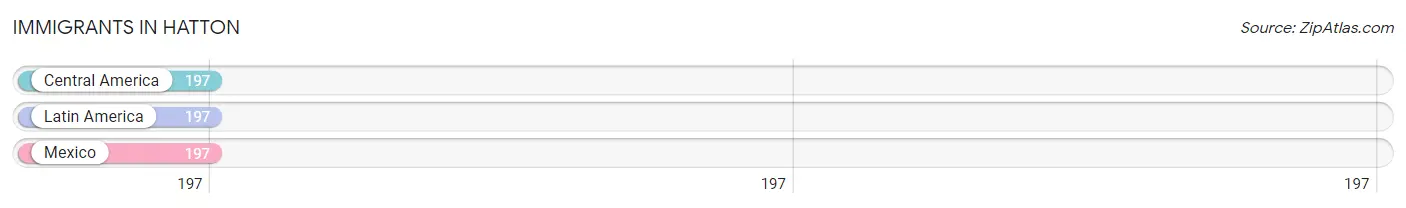
| Immigration Origin | # Population | % Population |
| Central America | 197 | 40.0% |
| Latin America | 197 | 40.0% |
| Mexico | 197 | 40.0% | View All 3 Rows |
Sex and Age in Hatton
Sex and Age in Hatton
The most populous age groups in Hatton are 40 to 44 Years (160 | 61.5%) for men and 15 to 19 Years (66 | 28.4%) for women.
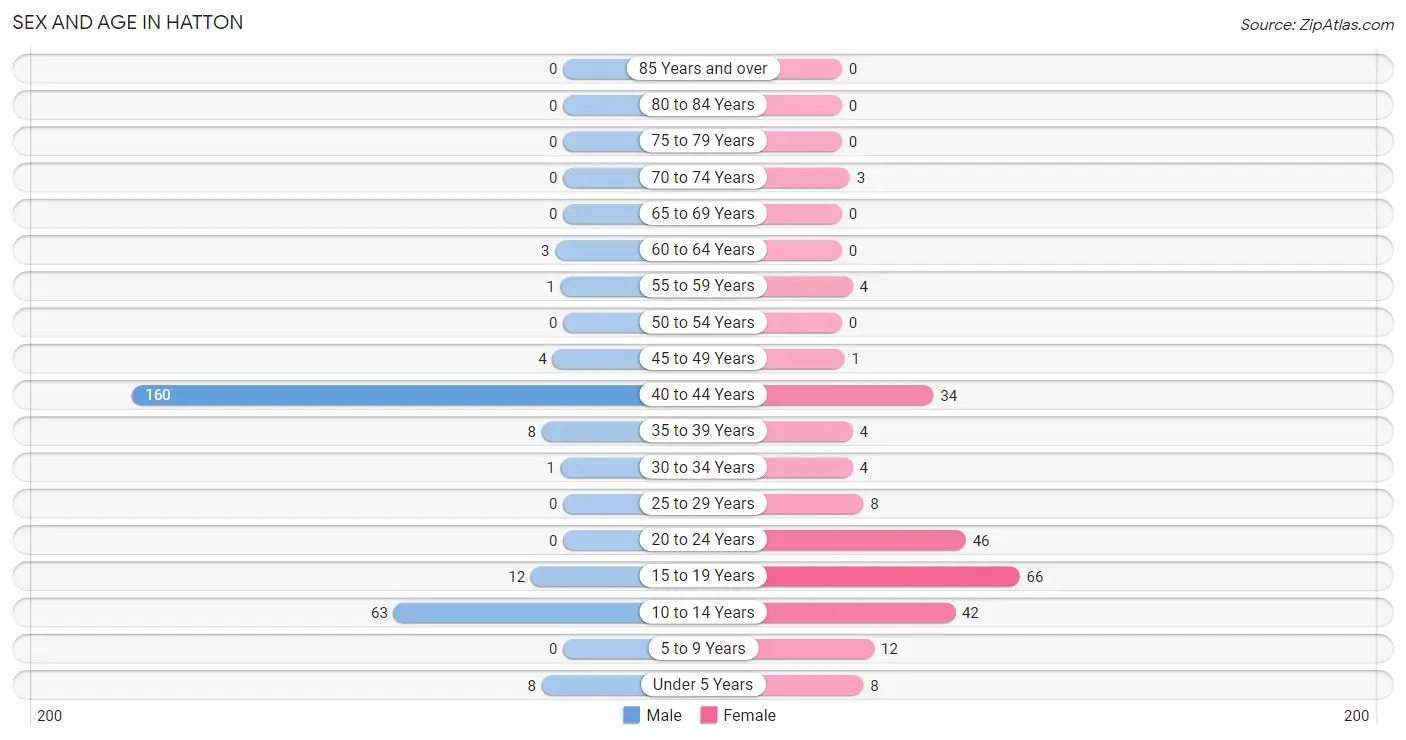
| Age Bracket | Male | Female |
| Under 5 Years | 8 (3.1%) | 8 (3.5%) |
| 5 to 9 Years | 0 (0.0%) | 12 (5.2%) |
| 10 to 14 Years | 63 (24.2%) | 42 (18.1%) |
| 15 to 19 Years | 12 (4.6%) | 66 (28.4%) |
| 20 to 24 Years | 0 (0.0%) | 46 (19.8%) |
| 25 to 29 Years | 0 (0.0%) | 8 (3.5%) |
| 30 to 34 Years | 1 (0.4%) | 4 (1.7%) |
| 35 to 39 Years | 8 (3.1%) | 4 (1.7%) |
| 40 to 44 Years | 160 (61.5%) | 34 (14.7%) |
| 45 to 49 Years | 4 (1.5%) | 1 (0.4%) |
| 50 to 54 Years | 0 (0.0%) | 0 (0.0%) |
| 55 to 59 Years | 1 (0.4%) | 4 (1.7%) |
| 60 to 64 Years | 3 (1.1%) | 0 (0.0%) |
| 65 to 69 Years | 0 (0.0%) | 0 (0.0%) |
| 70 to 74 Years | 0 (0.0%) | 3 (1.3%) |
| 75 to 79 Years | 0 (0.0%) | 0 (0.0%) |
| 80 to 84 Years | 0 (0.0%) | 0 (0.0%) |
| 85 Years and over | 0 (0.0%) | 0 (0.0%) |
| Total | 260 (100.0%) | 232 (100.0%) |
Families and Households in Hatton
Median Family Size in Hatton
The median family size in Hatton is 10.02 persons per family, with married-couple families (35 | 74.5%) accounting for the largest median family size of 11.97 persons per family. On the other hand, single male/father families (10 | 21.3%) represent the smallest median family size with 4.10 persons per family.
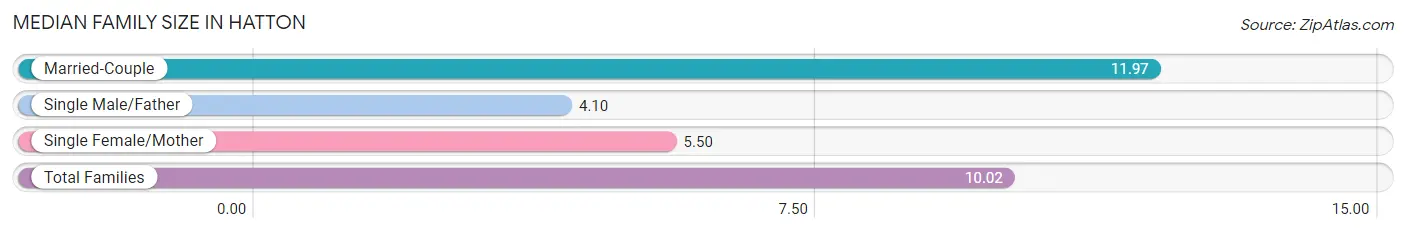
| Family Type | # Families | Family Size |
| Married-Couple | 35 (74.5%) | 11.97 |
| Single Male/Father | 10 (21.3%) | 4.10 |
| Single Female/Mother | 2 (4.3%) | 5.50 |
| Total Families | 47 (100.0%) | 10.02 |
Median Household Size in Hatton
The median household size in Hatton is 8.95 persons per household, with married-couple households (35 | 63.6%) accounting for the largest median household size of 11.97 persons per household. non-family households (8 | 14.5%) represent the smallest median household size with 1.75 persons per household.
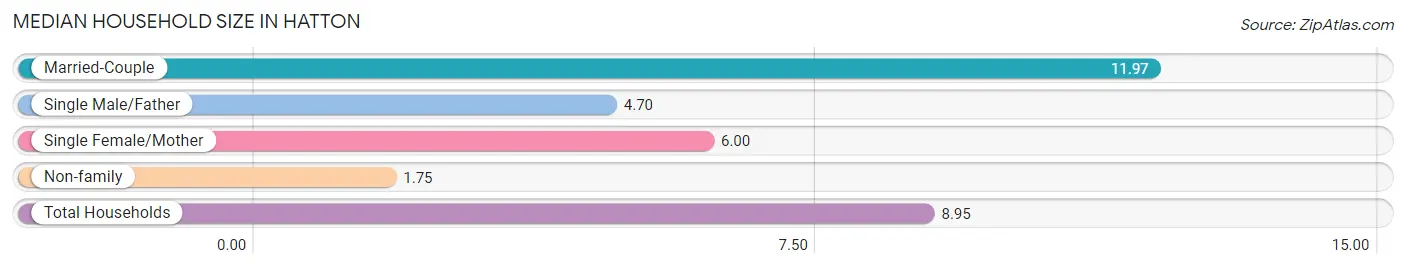
| Household Type | # Households | Household Size |
| Married-Couple | 35 (63.6%) | 11.97 |
| Single Male/Father | 10 (18.2%) | 4.70 |
| Single Female/Mother | 2 (3.6%) | 6.00 |
| Non-family | 8 (14.5%) | 1.75 |
| Total Households | 55 (100.0%) | 8.95 |
Household Size by Marriage Status in Hatton
Out of a total of 55 households in Hatton, 47 (85.5%) are family households, while 8 (14.5%) are nonfamily households. The most numerous type of family households are 6-person households, comprising 32, and the most common type of nonfamily households are 1-person households, comprising 4.
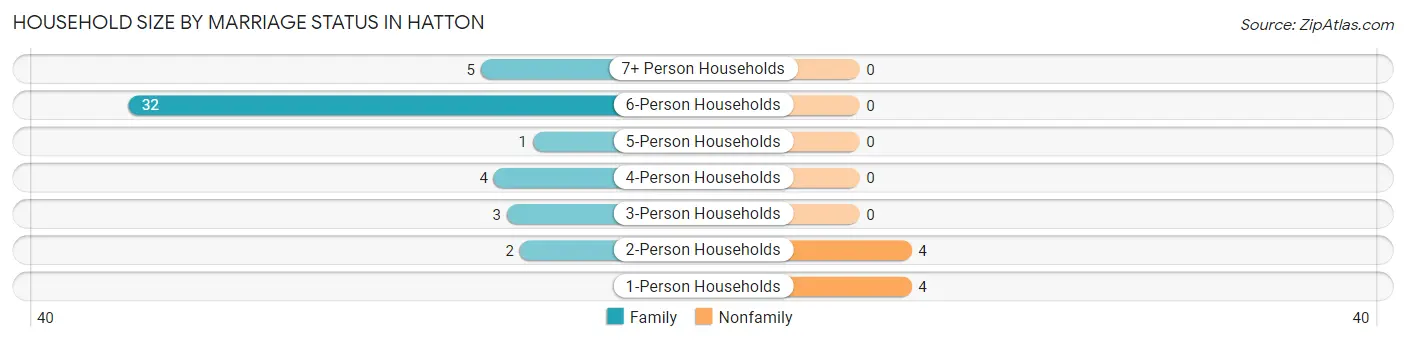
| Household Size | Family Households | Nonfamily Households |
| 1-Person Households | - | 4 (7.3%) |
| 2-Person Households | 2 (3.6%) | 4 (7.3%) |
| 3-Person Households | 3 (5.4%) | 0 (0.0%) |
| 4-Person Households | 4 (7.3%) | 0 (0.0%) |
| 5-Person Households | 1 (1.8%) | 0 (0.0%) |
| 6-Person Households | 32 (58.2%) | 0 (0.0%) |
| 7+ Person Households | 5 (9.1%) | 0 (0.0%) |
| Total | 47 (85.5%) | 8 (14.5%) |
Female Fertility in Hatton
Fertility by Age in Hatton
Average fertility rate in Hatton is 6.0 births per 1,000 women. Women in the age bracket of 35 to 50 years have the highest fertility rate with 26.0 births per 1,000 women. Women in the age bracket of 35 to 50 years acount for 100.0% of all women with births.
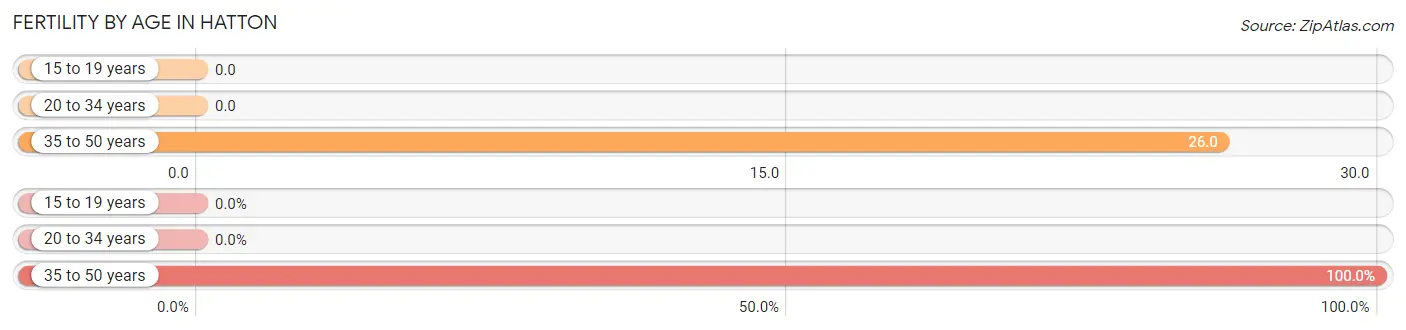
| Age Bracket | Women with Births | Births / 1,000 Women |
| 15 to 19 years | 0 (0.0%) | 0.0 |
| 20 to 34 years | 0 (0.0%) | 0.0 |
| 35 to 50 years | 1 (100.0%) | 26.0 |
| Total | 1 (100.0%) | 6.0 |
Fertility by Age by Marriage Status in Hatton
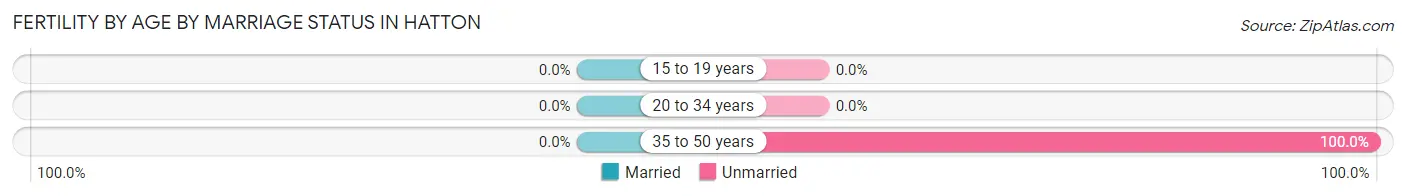
| Age Bracket | Married | Unmarried |
| 15 to 19 years | 0 (0.0%) | 0 (0.0%) |
| 20 to 34 years | 0 (0.0%) | 0 (0.0%) |
| 35 to 50 years | 0 (0.0%) | 1 (100.0%) |
| Total | 0 (0.0%) | 1 (100.0%) |
Fertility by Education in Hatton
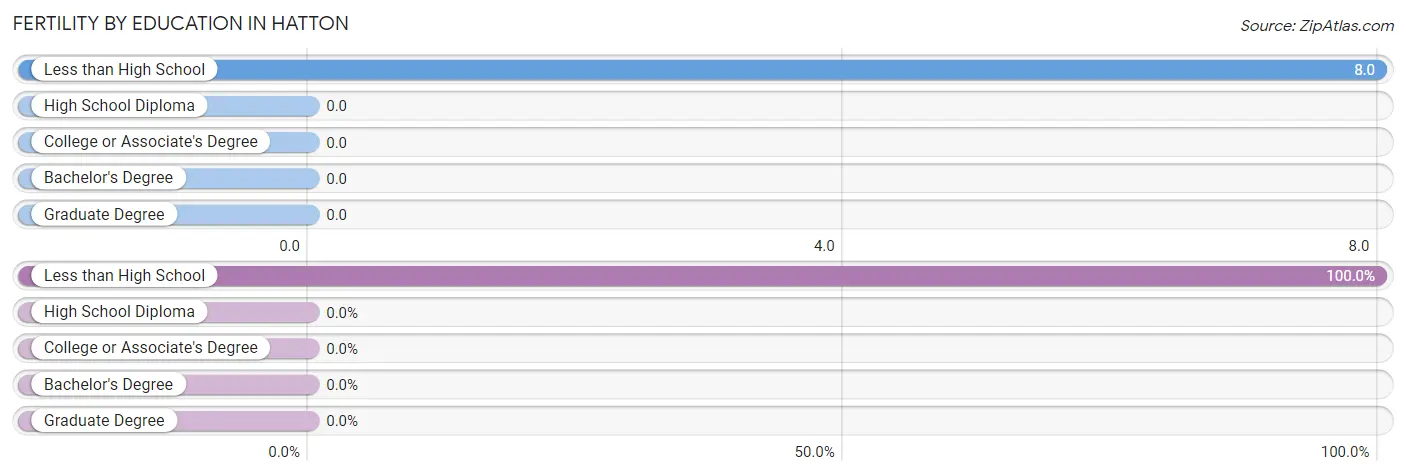
| Educational Attainment | Women with Births | Births / 1,000 Women |
| Less than High School | 1 (100.0%) | 8.0 |
| High School Diploma | 0 (0.0%) | 0.0 |
| College or Associate's Degree | 0 (0.0%) | 0.0 |
| Bachelor's Degree | 0 (0.0%) | 0.0 |
| Graduate Degree | 0 (0.0%) | 0.0 |
| Total | 1 (100.0%) | 6.0 |
Fertility by Education by Marriage Status in Hatton
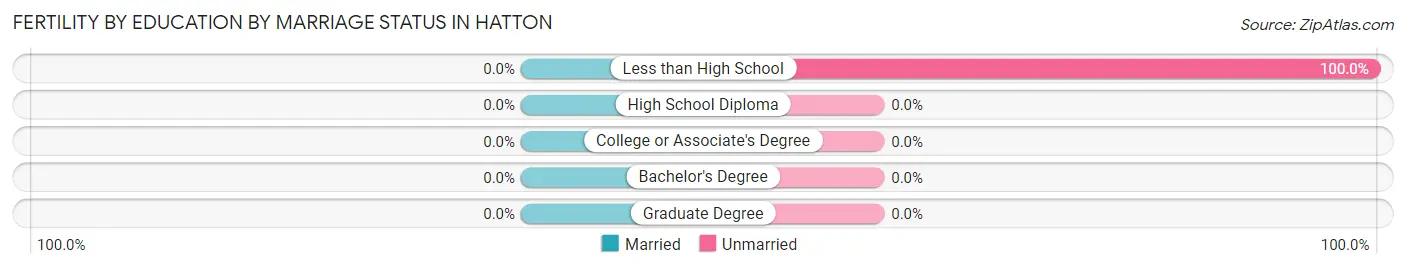
| Educational Attainment | Married | Unmarried |
| Less than High School | 0 (0.0%) | 1 (100.0%) |
| High School Diploma | 0 (0.0%) | 0 (0.0%) |
| College or Associate's Degree | 0 (0.0%) | 0 (0.0%) |
| Bachelor's Degree | 0 (0.0%) | 0 (0.0%) |
| Graduate Degree | 0 (0.0%) | 0 (0.0%) |
| Total | 0 (0.0%) | 1 (100.0%) |
Employment Characteristics in Hatton
Employment by Class of Employer in Hatton
Among the 248 employed individuals in Hatton, self-employed (incorporated) (153 | 61.7%), private company employees (87 | 35.1%), and state government employees (5 | 2.0%) make up the most common classes of employment.
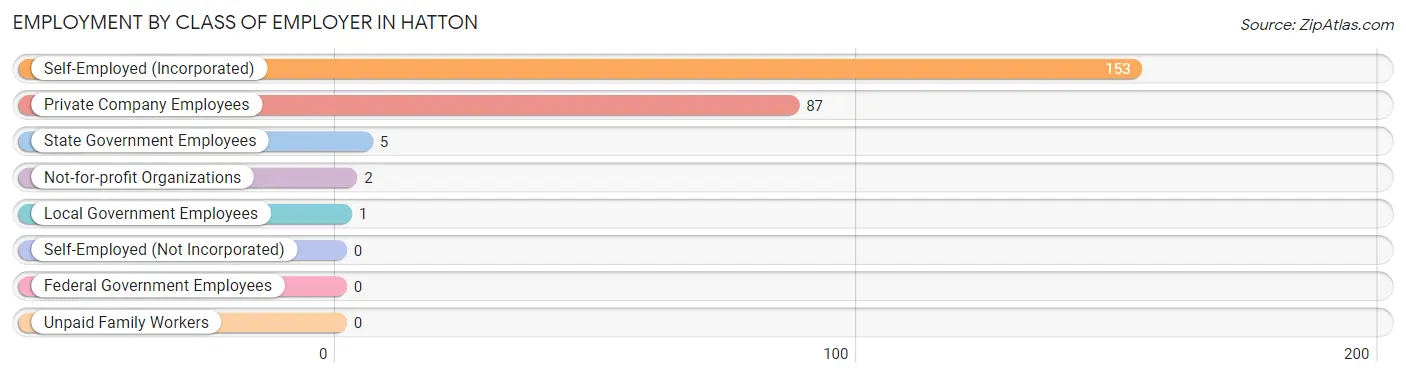
| Employer Class | # Employees | % Employees |
| Private Company Employees | 87 | 35.1% |
| Self-Employed (Incorporated) | 153 | 61.7% |
| Self-Employed (Not Incorporated) | 0 | 0.0% |
| Not-for-profit Organizations | 2 | 0.8% |
| Local Government Employees | 1 | 0.4% |
| State Government Employees | 5 | 2.0% |
| Federal Government Employees | 0 | 0.0% |
| Unpaid Family Workers | 0 | 0.0% |
| Total | 248 | 100.0% |
Employment Status by Age in Hatton
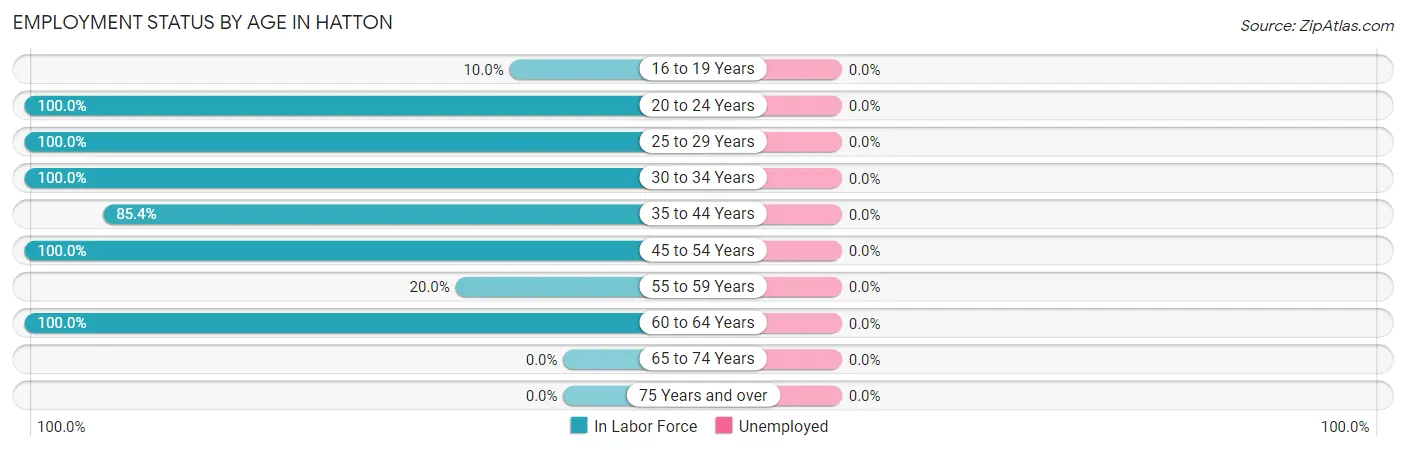
| Age Bracket | In Labor Force | Unemployed |
| 16 to 19 Years | 4 (10.0%) | 0 (0.0%) |
| 20 to 24 Years | 46 (100.0%) | 0 (0.0%) |
| 25 to 29 Years | 8 (100.0%) | 0 (0.0%) |
| 30 to 34 Years | 5 (100.0%) | 0 (0.0%) |
| 35 to 44 Years | 176 (85.4%) | 0 (0.0%) |
| 45 to 54 Years | 5 (100.0%) | 0 (0.0%) |
| 55 to 59 Years | 1 (20.0%) | 0 (0.0%) |
| 60 to 64 Years | 3 (100.0%) | 0 (0.0%) |
| 65 to 74 Years | 0 (0.0%) | 0 (0.0%) |
| 75 Years and over | 0 (0.0%) | 0 (0.0%) |
| Total | 248 (77.3%) | 0 (0.0%) |
Employment Status by Educational Attainment in Hatton
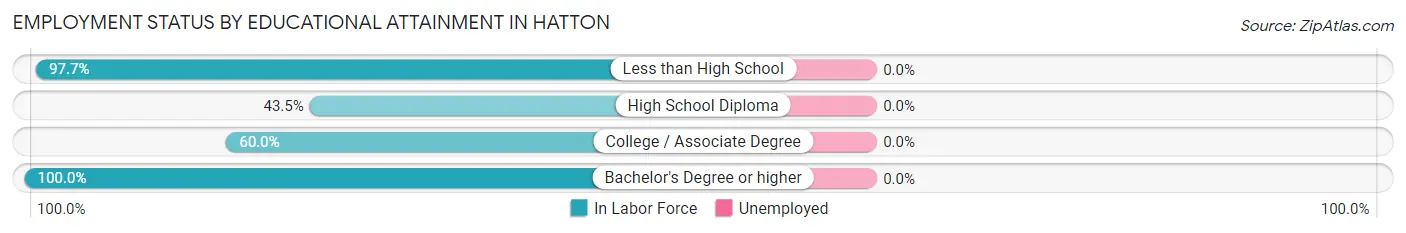
| Educational Attainment | In Labor Force | Unemployed |
| Less than High School | 171 (97.7%) | 0 (0.0%) |
| High School Diploma | 20 (43.5%) | 0 (0.0%) |
| College / Associate Degree | 6 (60.0%) | 0 (0.0%) |
| Bachelor's Degree or higher | 1 (100.0%) | 0 (0.0%) |
| Total | 198 (85.3%) | 0 (0.0%) |
Employment Occupations by Sex in Hatton
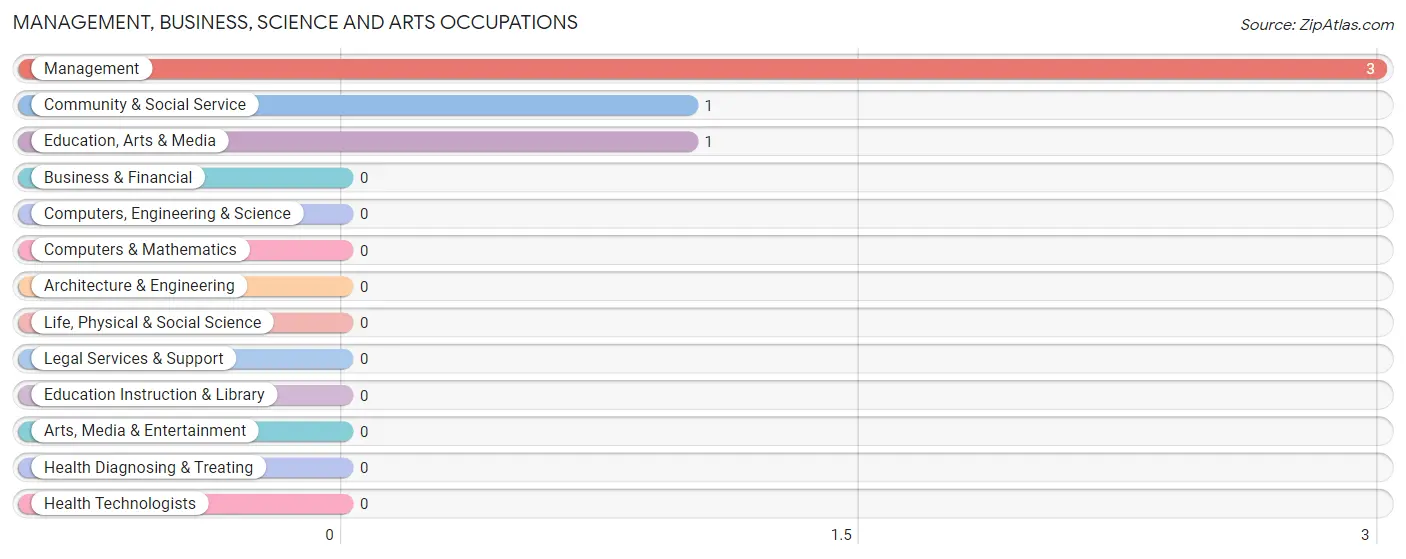
Management, Business, Science and Arts Occupations
The most common Management, Business, Science and Arts occupations in Hatton are Management (3 | 1.2%), Community & Social Service (1 | 0.4%), and Education, Arts & Media (1 | 0.4%).
Management, Business, Science and Arts Occupations by Sex
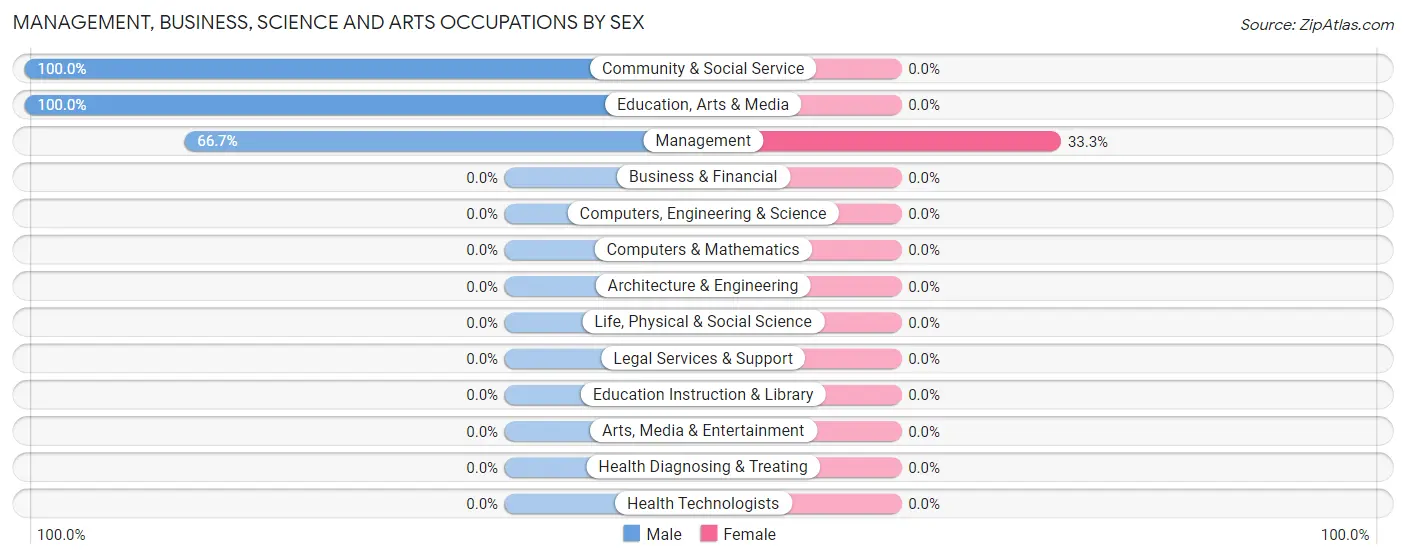
| Occupation | Male | Female |
| Management | 2 (66.7%) | 1 (33.3%) |
| Business & Financial | 0 (0.0%) | 0 (0.0%) |
| Computers, Engineering & Science | 0 (0.0%) | 0 (0.0%) |
| Computers & Mathematics | 0 (0.0%) | 0 (0.0%) |
| Architecture & Engineering | 0 (0.0%) | 0 (0.0%) |
| Life, Physical & Social Science | 0 (0.0%) | 0 (0.0%) |
| Community & Social Service | 1 (100.0%) | 0 (0.0%) |
| Education, Arts & Media | 1 (100.0%) | 0 (0.0%) |
| Legal Services & Support | 0 (0.0%) | 0 (0.0%) |
| Education Instruction & Library | 0 (0.0%) | 0 (0.0%) |
| Arts, Media & Entertainment | 0 (0.0%) | 0 (0.0%) |
| Health Diagnosing & Treating | 0 (0.0%) | 0 (0.0%) |
| Health Technologists | 0 (0.0%) | 0 (0.0%) |
| Total (Category) | 3 (75.0%) | 1 (25.0%) |
| Total (Overall) | 181 (73.0%) | 67 (27.0%) |
Services Occupations
The most common Services occupations in Hatton are Cleaning & Maintenance (52 | 21.0%), Security & Protection (4 | 1.6%), Law Enforcement (4 | 1.6%), Healthcare Support (3 | 1.2%), and Food Preparation & Serving (3 | 1.2%).
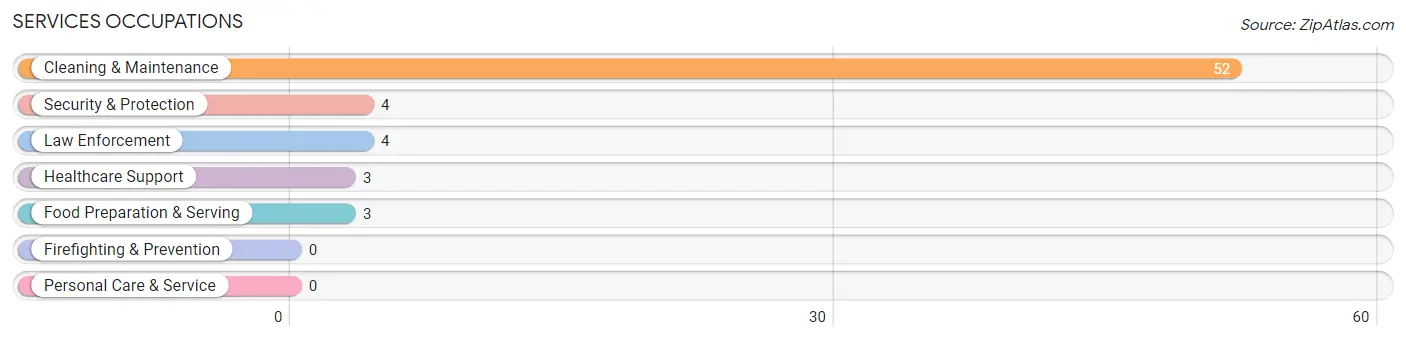
Services Occupations by Sex
Within the Services occupations in Hatton, the most male-oriented occupations are Security & Protection (75.0%), Law Enforcement (75.0%), and Food Preparation & Serving (66.7%), while the most female-oriented occupations are Healthcare Support (100.0%), Cleaning & Maintenance (88.5%), and Food Preparation & Serving (33.3%).
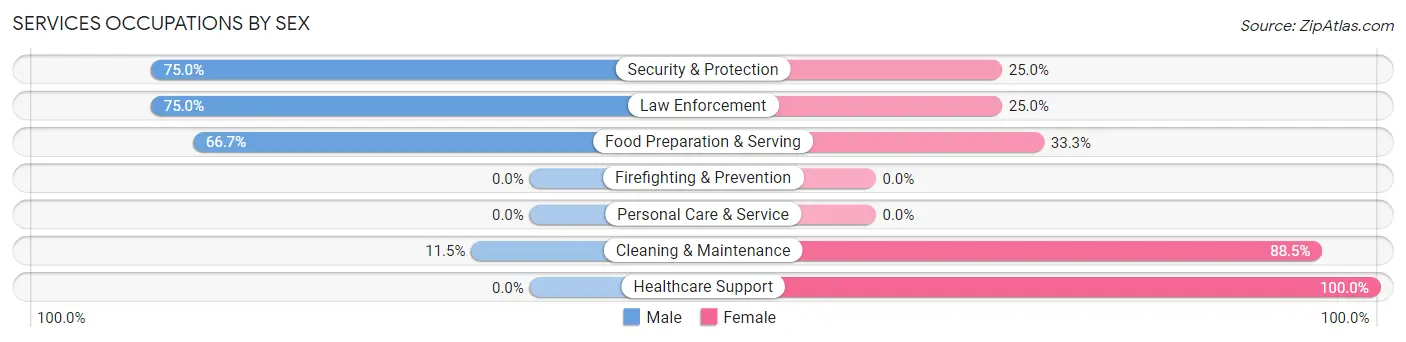
| Occupation | Male | Female |
| Healthcare Support | 0 (0.0%) | 3 (100.0%) |
| Security & Protection | 3 (75.0%) | 1 (25.0%) |
| Firefighting & Prevention | 0 (0.0%) | 0 (0.0%) |
| Law Enforcement | 3 (75.0%) | 1 (25.0%) |
| Food Preparation & Serving | 2 (66.7%) | 1 (33.3%) |
| Cleaning & Maintenance | 6 (11.5%) | 46 (88.5%) |
| Personal Care & Service | 0 (0.0%) | 0 (0.0%) |
| Total (Category) | 11 (17.7%) | 51 (82.3%) |
| Total (Overall) | 181 (73.0%) | 67 (27.0%) |
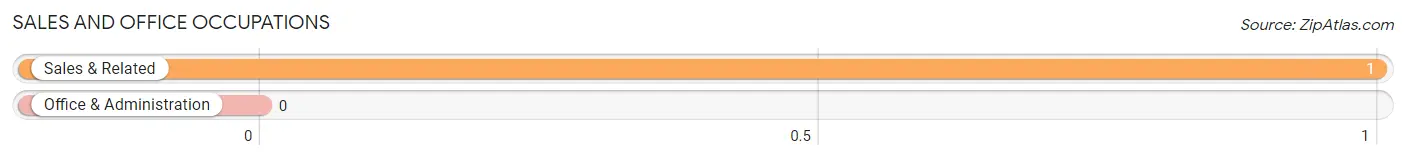
Sales and Office Occupations
The most common Sales and Office occupations in Hatton are , and Sales & Related (1 | 0.4%).
Sales and Office Occupations by Sex
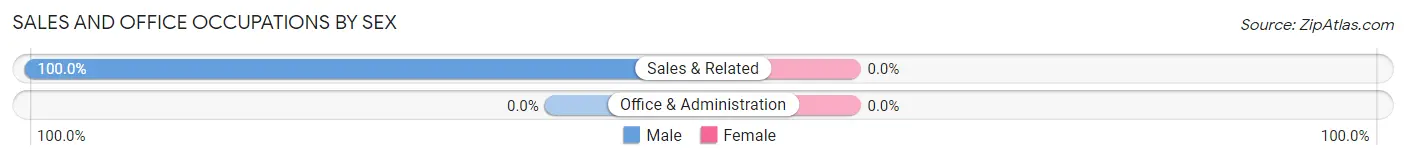
| Occupation | Male | Female |
| Sales & Related | 1 (100.0%) | 0 (0.0%) |
| Office & Administration | 0 (0.0%) | 0 (0.0%) |
| Total (Category) | 1 (100.0%) | 0 (0.0%) |
| Total (Overall) | 181 (73.0%) | 67 (27.0%) |
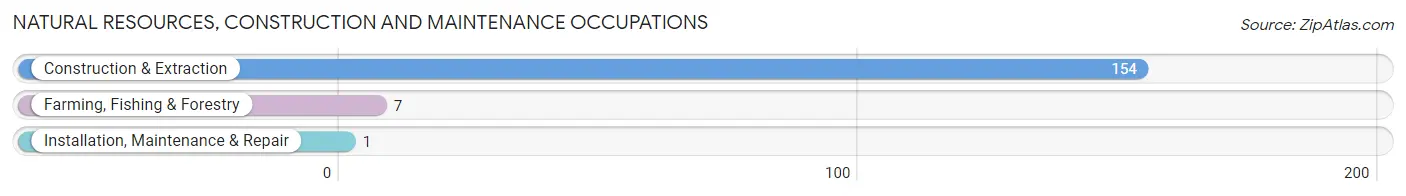
Natural Resources, Construction and Maintenance Occupations
The most common Natural Resources, Construction and Maintenance occupations in Hatton are Construction & Extraction (154 | 62.1%), Farming, Fishing & Forestry (7 | 2.8%), and Installation, Maintenance & Repair (1 | 0.4%).
Natural Resources, Construction and Maintenance Occupations by Sex
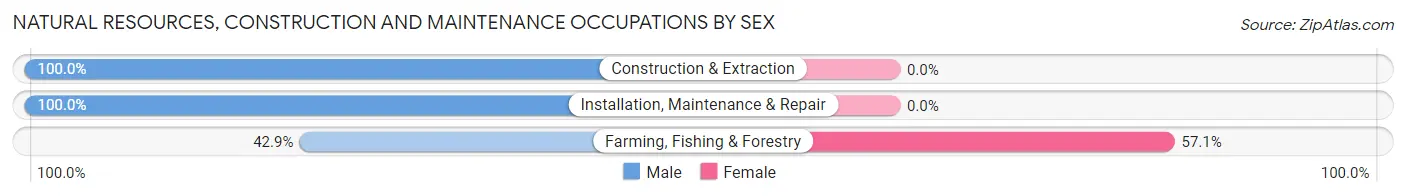
| Occupation | Male | Female |
| Farming, Fishing & Forestry | 3 (42.9%) | 4 (57.1%) |
| Construction & Extraction | 154 (100.0%) | 0 (0.0%) |
| Installation, Maintenance & Repair | 1 (100.0%) | 0 (0.0%) |
| Total (Category) | 158 (97.5%) | 4 (2.5%) |
| Total (Overall) | 181 (73.0%) | 67 (27.0%) |
Production, Transportation and Moving Occupations
The most common Production, Transportation and Moving occupations in Hatton are Material Moving (17 | 6.9%), Production (1 | 0.4%), and Transportation (1 | 0.4%).
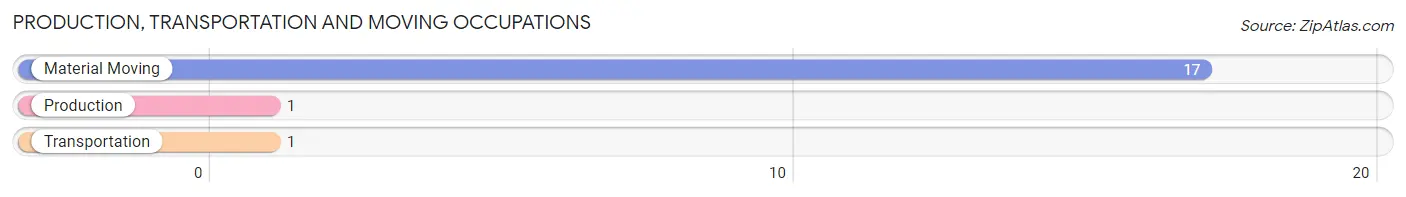
Production, Transportation and Moving Occupations by Sex
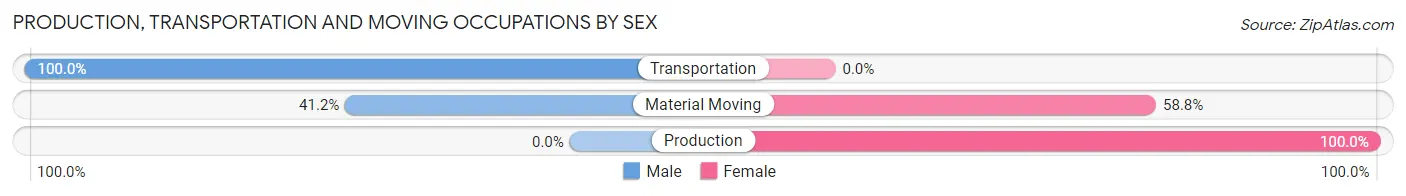
| Occupation | Male | Female |
| Production | 0 (0.0%) | 1 (100.0%) |
| Transportation | 1 (100.0%) | 0 (0.0%) |
| Material Moving | 7 (41.2%) | 10 (58.8%) |
| Total (Category) | 8 (42.1%) | 11 (57.9%) |
| Total (Overall) | 181 (73.0%) | 67 (27.0%) |
Employment Industries by Sex in Hatton
Employment Industries in Hatton
The major employment industries in Hatton include Construction (155 | 62.5%), Administrative & Support (52 | 21.0%), Agriculture, Fishing & Hunting (17 | 6.9%), Manufacturing (10 | 4.0%), and Public Administration (6 | 2.4%).
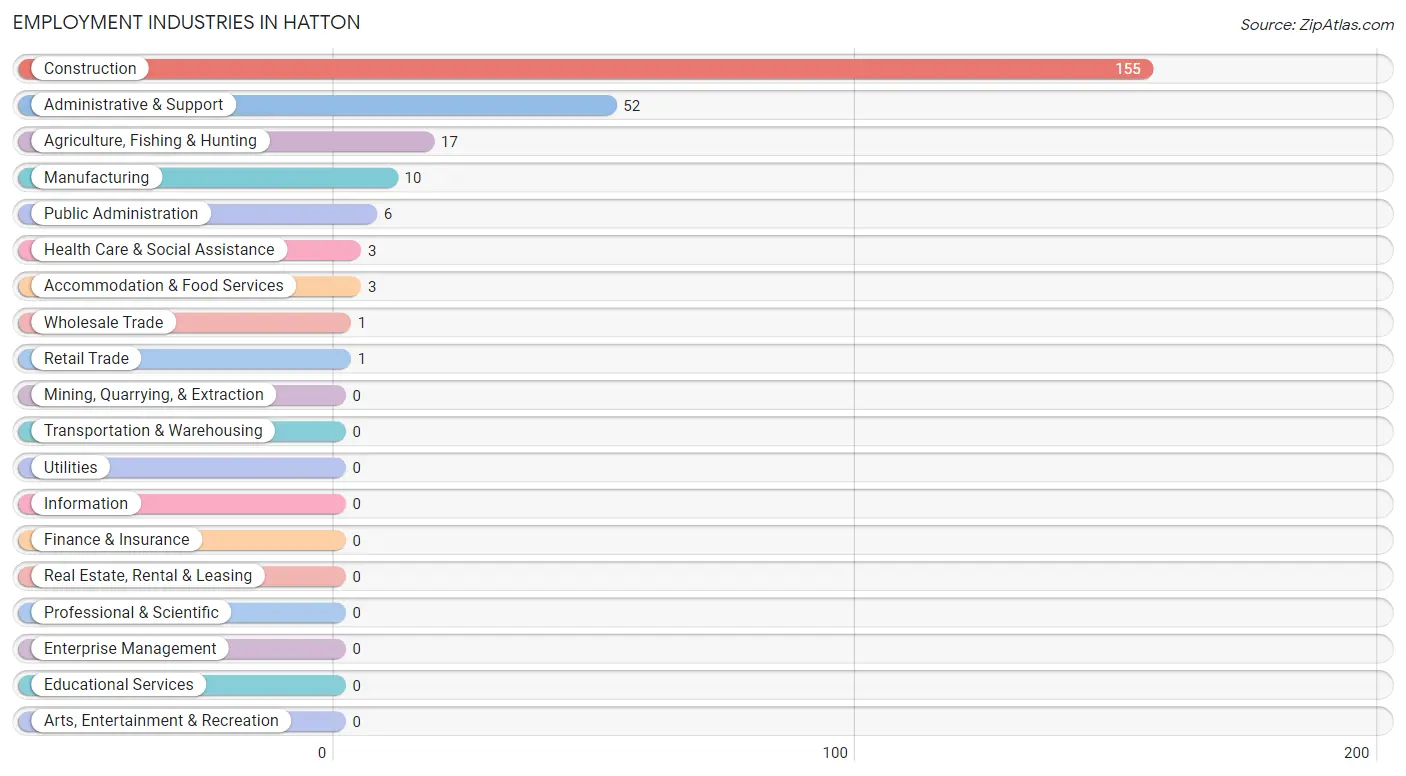
Employment Industries by Sex in Hatton
The Hatton industries that see more men than women are Construction (100.0%), Wholesale Trade (100.0%), and Retail Trade (100.0%), whereas the industries that tend to have a higher number of women are Health Care & Social Assistance (100.0%), Administrative & Support (88.5%), and Agriculture, Fishing & Hunting (82.4%).
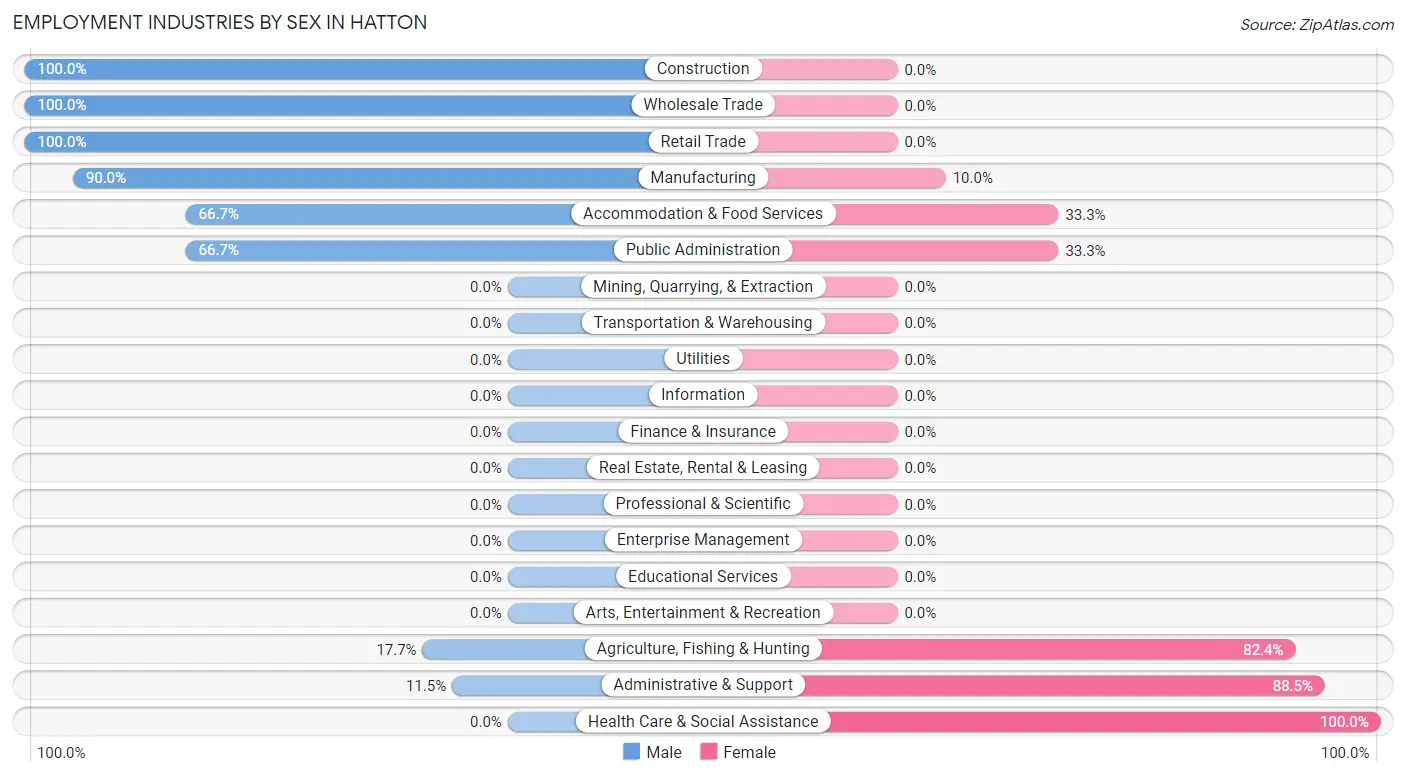
| Industry | Male | Female |
| Agriculture, Fishing & Hunting | 3 (17.6%) | 14 (82.4%) |
| Mining, Quarrying, & Extraction | 0 (0.0%) | 0 (0.0%) |
| Construction | 155 (100.0%) | 0 (0.0%) |
| Manufacturing | 9 (90.0%) | 1 (10.0%) |
| Wholesale Trade | 1 (100.0%) | 0 (0.0%) |
| Retail Trade | 1 (100.0%) | 0 (0.0%) |
| Transportation & Warehousing | 0 (0.0%) | 0 (0.0%) |
| Utilities | 0 (0.0%) | 0 (0.0%) |
| Information | 0 (0.0%) | 0 (0.0%) |
| Finance & Insurance | 0 (0.0%) | 0 (0.0%) |
| Real Estate, Rental & Leasing | 0 (0.0%) | 0 (0.0%) |
| Professional & Scientific | 0 (0.0%) | 0 (0.0%) |
| Enterprise Management | 0 (0.0%) | 0 (0.0%) |
| Administrative & Support | 6 (11.5%) | 46 (88.5%) |
| Educational Services | 0 (0.0%) | 0 (0.0%) |
| Health Care & Social Assistance | 0 (0.0%) | 3 (100.0%) |
| Arts, Entertainment & Recreation | 0 (0.0%) | 0 (0.0%) |
| Accommodation & Food Services | 2 (66.7%) | 1 (33.3%) |
| Public Administration | 4 (66.7%) | 2 (33.3%) |
| Total | 181 (73.0%) | 67 (27.0%) |
Education in Hatton
School Enrollment in Hatton
The most common levels of schooling among the 195 students in Hatton are high school (85 | 43.6%), middle school (80 | 41.0%), and elementary school (30 | 15.4%).
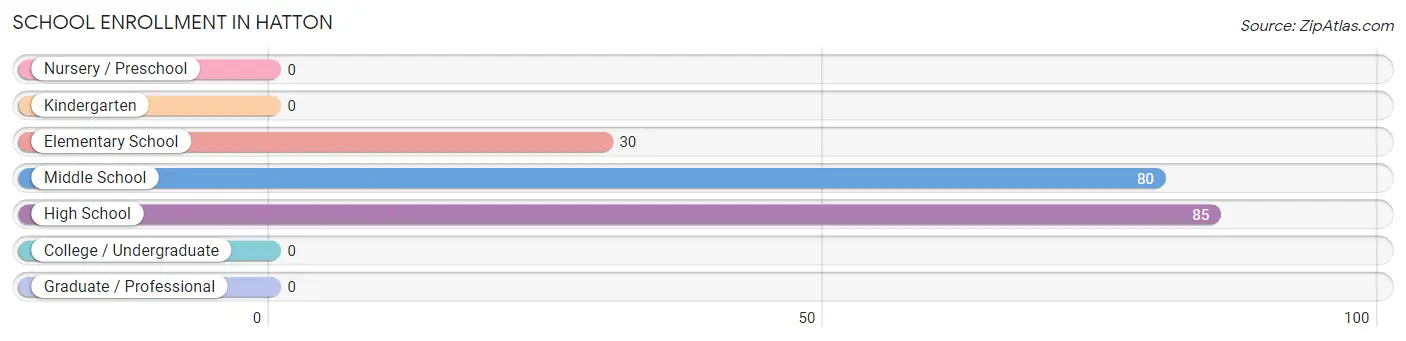
| School Level | # Students | % Students |
| Nursery / Preschool | 0 | 0.0% |
| Kindergarten | 0 | 0.0% |
| Elementary School | 30 | 15.4% |
| Middle School | 80 | 41.0% |
| High School | 85 | 43.6% |
| College / Undergraduate | 0 | 0.0% |
| Graduate / Professional | 0 | 0.0% |
| Total | 195 | 100.0% |
School Enrollment by Age by Funding Source in Hatton
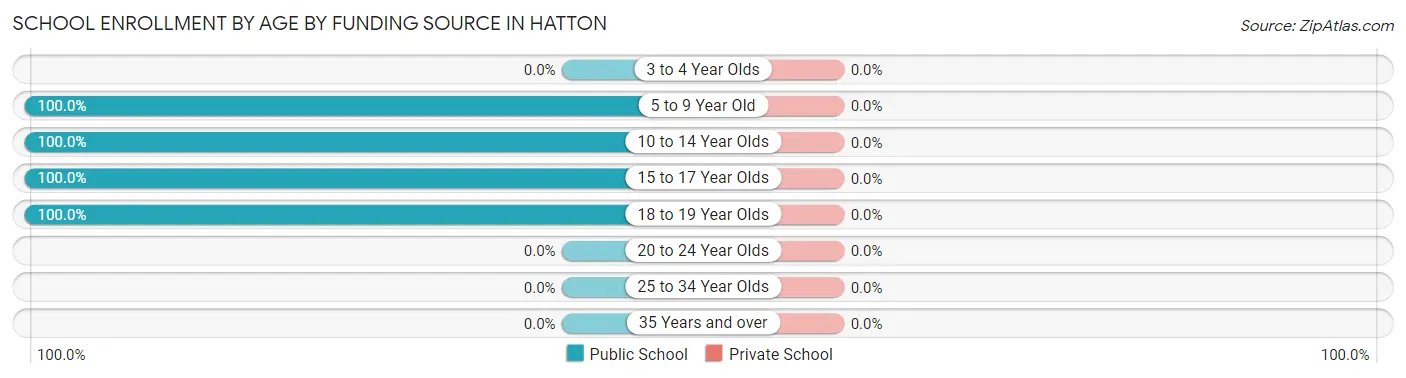
| Age Bracket | Public School | Private School |
| 3 to 4 Year Olds | 0 (0.0%) | 0 (0.0%) |
| 5 to 9 Year Old | 12 (100.0%) | 0 (0.0%) |
| 10 to 14 Year Olds | 105 (100.0%) | 0 (0.0%) |
| 15 to 17 Year Olds | 47 (100.0%) | 0 (0.0%) |
| 18 to 19 Year Olds | 31 (100.0%) | 0 (0.0%) |
| 20 to 24 Year Olds | 0 (0.0%) | 0 (0.0%) |
| 25 to 34 Year Olds | 0 (0.0%) | 0 (0.0%) |
| 35 Years and over | 0 (0.0%) | 0 (0.0%) |
| Total | 195 (100.0%) | 0 (0.0%) |
Educational Attainment by Field of Study in Hatton
, and arts & humanities (1 | 100.0%) are the most common fields of study among 1 individuals in Hatton who have obtained a bachelor's degree or higher.
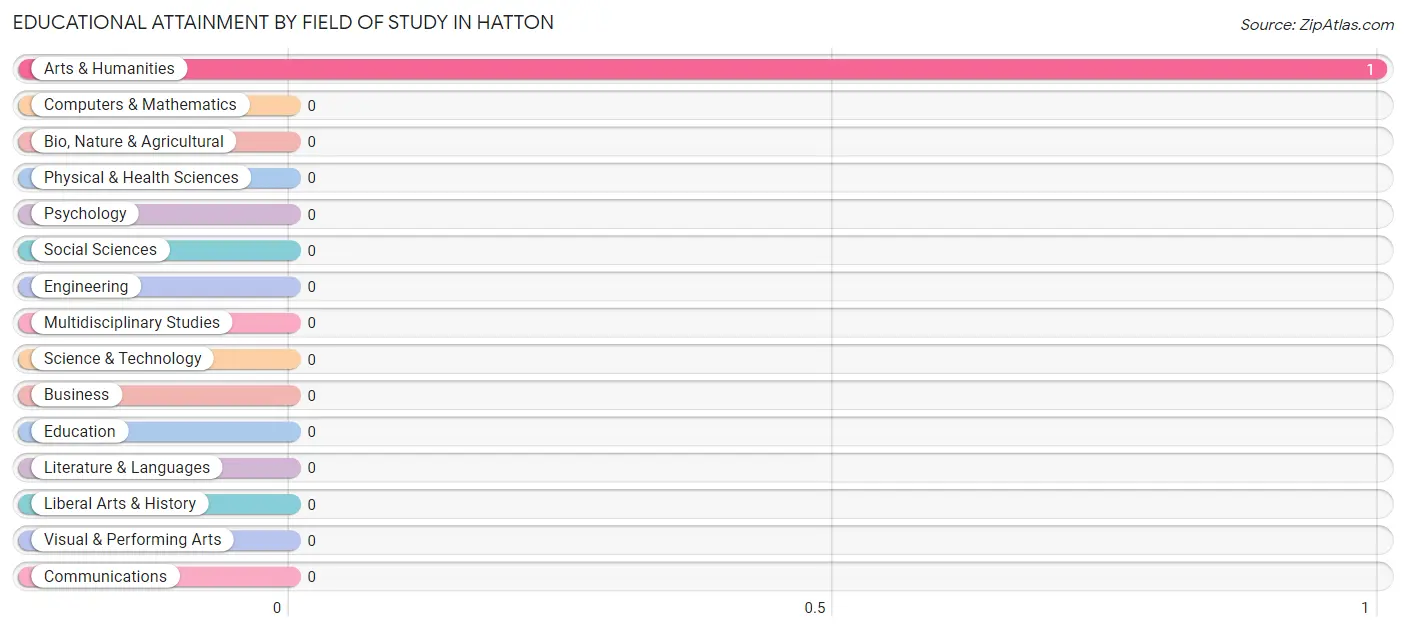
| Field of Study | # Graduates | % Graduates |
| Computers & Mathematics | 0 | 0.0% |
| Bio, Nature & Agricultural | 0 | 0.0% |
| Physical & Health Sciences | 0 | 0.0% |
| Psychology | 0 | 0.0% |
| Social Sciences | 0 | 0.0% |
| Engineering | 0 | 0.0% |
| Multidisciplinary Studies | 0 | 0.0% |
| Science & Technology | 0 | 0.0% |
| Business | 0 | 0.0% |
| Education | 0 | 0.0% |
| Literature & Languages | 0 | 0.0% |
| Liberal Arts & History | 0 | 0.0% |
| Visual & Performing Arts | 0 | 0.0% |
| Communications | 0 | 0.0% |
| Arts & Humanities | 1 | 100.0% |
| Total | 1 | 100.0% |
Transportation & Commute in Hatton
Vehicle Availability by Sex in Hatton
The most prevalent vehicle ownership categories in Hatton are males with 4 vehicles (165, accounting for 91.2%) and females with 4 vehicles (50, making up 246.3%).
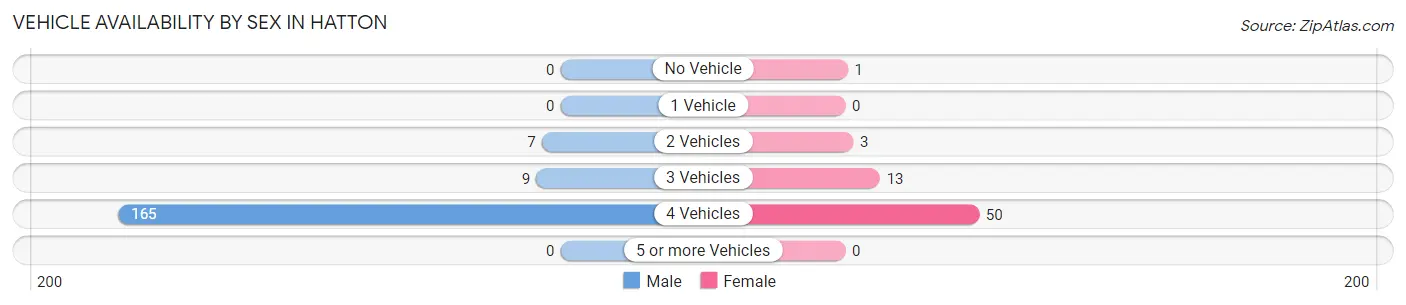
| Vehicles Available | Male | Female |
| No Vehicle | 0 (0.0%) | 1 (1.5%) |
| 1 Vehicle | 0 (0.0%) | 0 (0.0%) |
| 2 Vehicles | 7 (3.9%) | 3 (4.5%) |
| 3 Vehicles | 9 (5.0%) | 13 (19.4%) |
| 4 Vehicles | 165 (91.2%) | 50 (74.6%) |
| 5 or more Vehicles | 0 (0.0%) | 0 (0.0%) |
| Total | 181 (100.0%) | 67 (100.0%) |
Commute Time in Hatton
The most frequently occuring commute durations in Hatton are 60 to 89 minutes (198 commuters, 79.8%), 10 to 14 minutes (13 commuters, 5.2%), and 15 to 19 minutes (11 commuters, 4.4%).
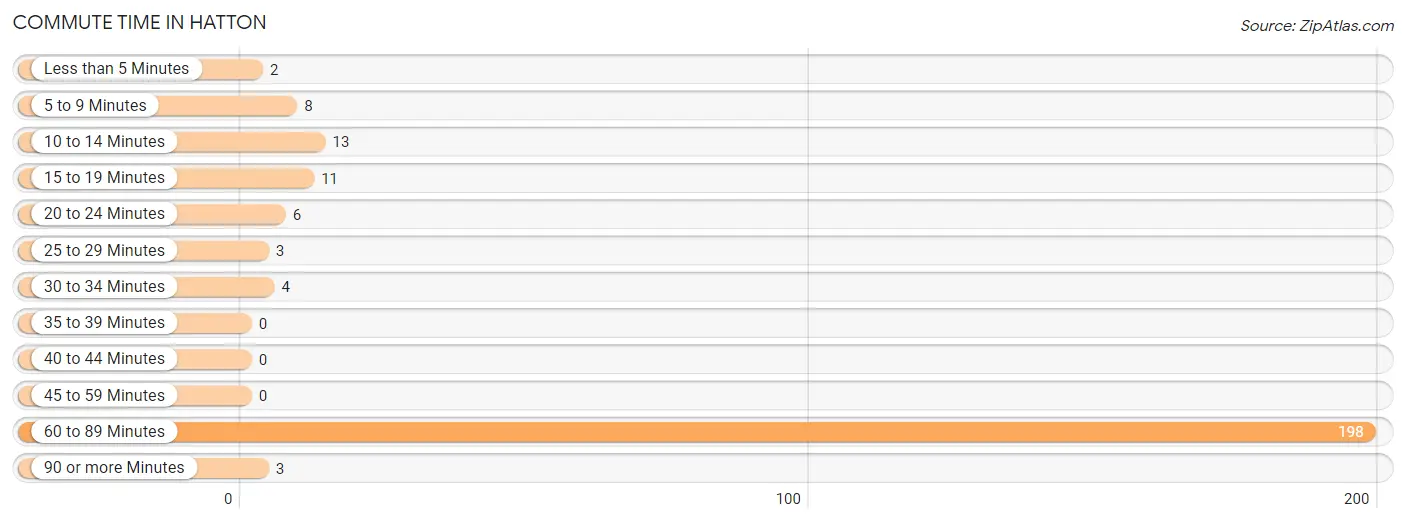
| Commute Time | # Commuters | % Commuters |
| Less than 5 Minutes | 2 | 0.8% |
| 5 to 9 Minutes | 8 | 3.2% |
| 10 to 14 Minutes | 13 | 5.2% |
| 15 to 19 Minutes | 11 | 4.4% |
| 20 to 24 Minutes | 6 | 2.4% |
| 25 to 29 Minutes | 3 | 1.2% |
| 30 to 34 Minutes | 4 | 1.6% |
| 35 to 39 Minutes | 0 | 0.0% |
| 40 to 44 Minutes | 0 | 0.0% |
| 45 to 59 Minutes | 0 | 0.0% |
| 60 to 89 Minutes | 198 | 79.8% |
| 90 or more Minutes | 3 | 1.2% |
Commute Time by Sex in Hatton
The most common commute times in Hatton are 60 to 89 minutes (152 commuters, 84.0%) for males and 60 to 89 minutes (46 commuters, 68.7%) for females.
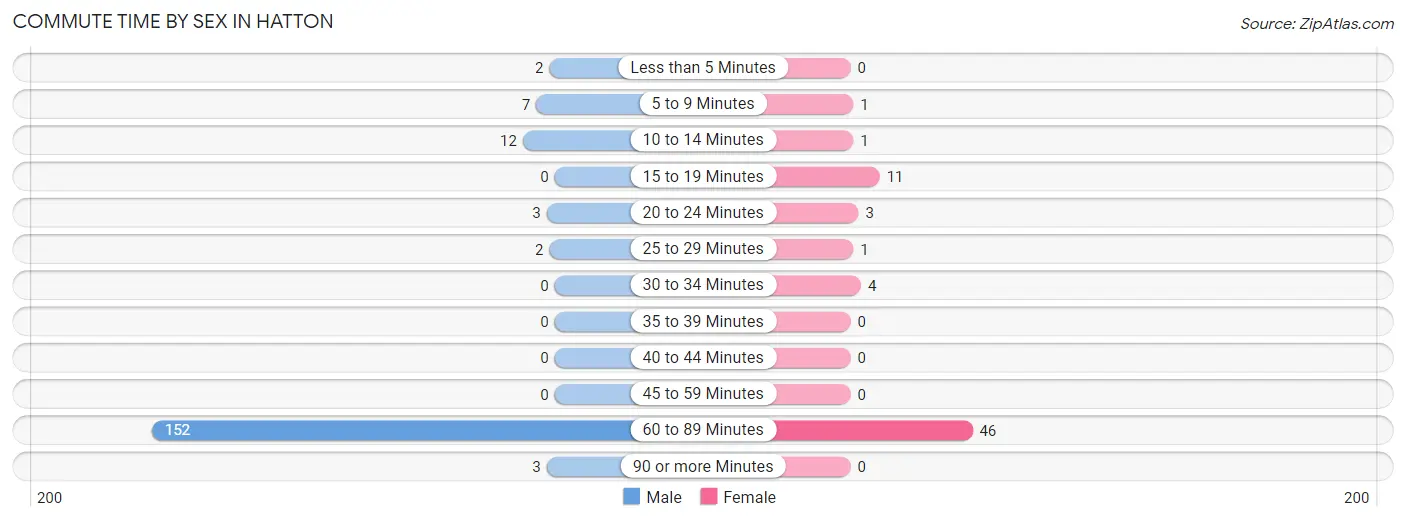
| Commute Time | Male | Female |
| Less than 5 Minutes | 2 (1.1%) | 0 (0.0%) |
| 5 to 9 Minutes | 7 (3.9%) | 1 (1.5%) |
| 10 to 14 Minutes | 12 (6.6%) | 1 (1.5%) |
| 15 to 19 Minutes | 0 (0.0%) | 11 (16.4%) |
| 20 to 24 Minutes | 3 (1.7%) | 3 (4.5%) |
| 25 to 29 Minutes | 2 (1.1%) | 1 (1.5%) |
| 30 to 34 Minutes | 0 (0.0%) | 4 (6.0%) |
| 35 to 39 Minutes | 0 (0.0%) | 0 (0.0%) |
| 40 to 44 Minutes | 0 (0.0%) | 0 (0.0%) |
| 45 to 59 Minutes | 0 (0.0%) | 0 (0.0%) |
| 60 to 89 Minutes | 152 (84.0%) | 46 (68.7%) |
| 90 or more Minutes | 3 (1.7%) | 0 (0.0%) |
Time of Departure to Work by Sex in Hatton
The most frequent times of departure to work in Hatton are 12:00 AM to 4:59 AM (153, 84.5%) for males and 4:00 PM to 11:59 PM (49, 73.1%) for females.
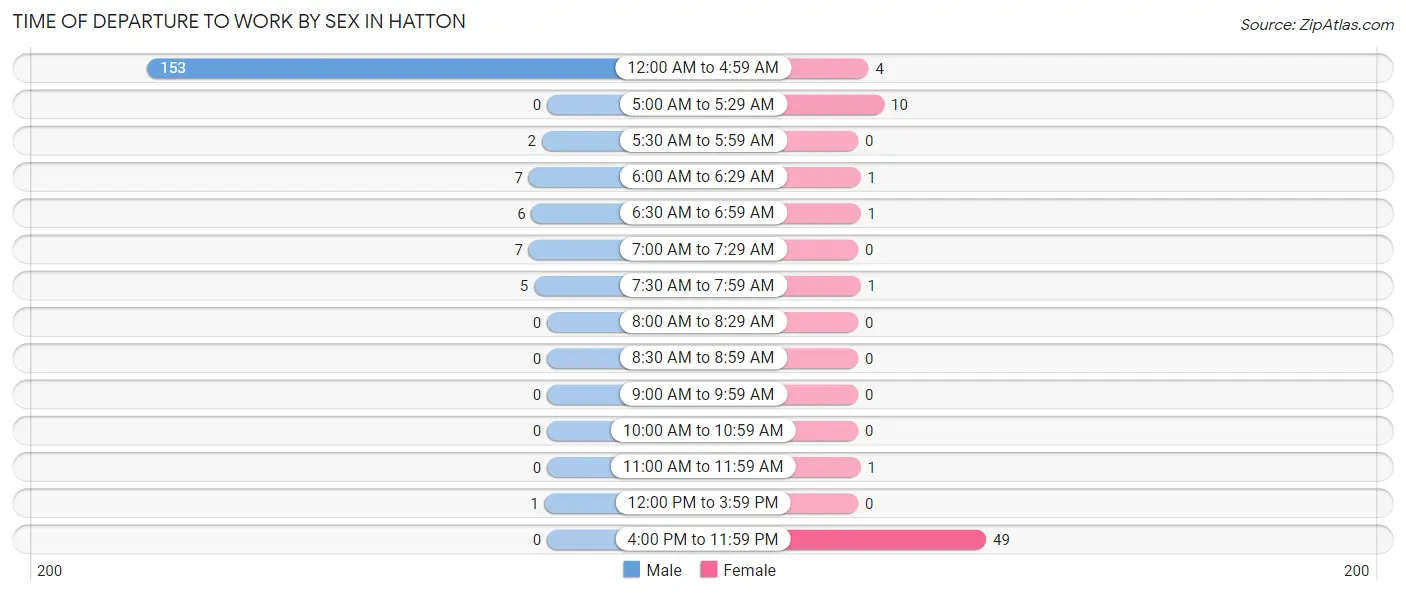
| Time of Departure | Male | Female |
| 12:00 AM to 4:59 AM | 153 (84.5%) | 4 (6.0%) |
| 5:00 AM to 5:29 AM | 0 (0.0%) | 10 (14.9%) |
| 5:30 AM to 5:59 AM | 2 (1.1%) | 0 (0.0%) |
| 6:00 AM to 6:29 AM | 7 (3.9%) | 1 (1.5%) |
| 6:30 AM to 6:59 AM | 6 (3.3%) | 1 (1.5%) |
| 7:00 AM to 7:29 AM | 7 (3.9%) | 0 (0.0%) |
| 7:30 AM to 7:59 AM | 5 (2.8%) | 1 (1.5%) |
| 8:00 AM to 8:29 AM | 0 (0.0%) | 0 (0.0%) |
| 8:30 AM to 8:59 AM | 0 (0.0%) | 0 (0.0%) |
| 9:00 AM to 9:59 AM | 0 (0.0%) | 0 (0.0%) |
| 10:00 AM to 10:59 AM | 0 (0.0%) | 0 (0.0%) |
| 11:00 AM to 11:59 AM | 0 (0.0%) | 1 (1.5%) |
| 12:00 PM to 3:59 PM | 1 (0.5%) | 0 (0.0%) |
| 4:00 PM to 11:59 PM | 0 (0.0%) | 49 (73.1%) |
| Total | 181 (100.0%) | 67 (100.0%) |
Housing Occupancy in Hatton
Occupancy by Ownership in Hatton
Of the total 55 dwellings in Hatton, owner-occupied units account for 22 (40.0%), while renter-occupied units make up 33 (60.0%).
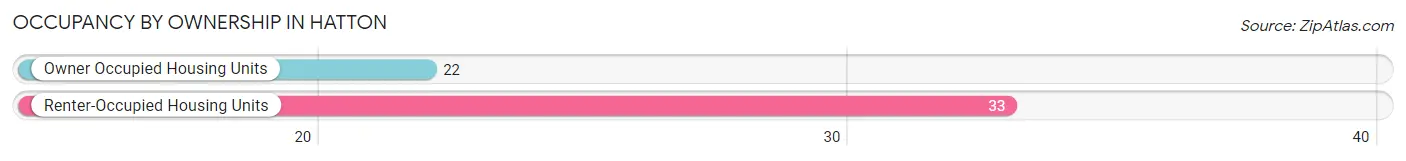
| Occupancy | # Housing Units | % Housing Units |
| Owner Occupied Housing Units | 22 | 40.0% |
| Renter-Occupied Housing Units | 33 | 60.0% |
| Total Occupied Housing Units | 55 | 100.0% |
Occupancy by Household Size in Hatton
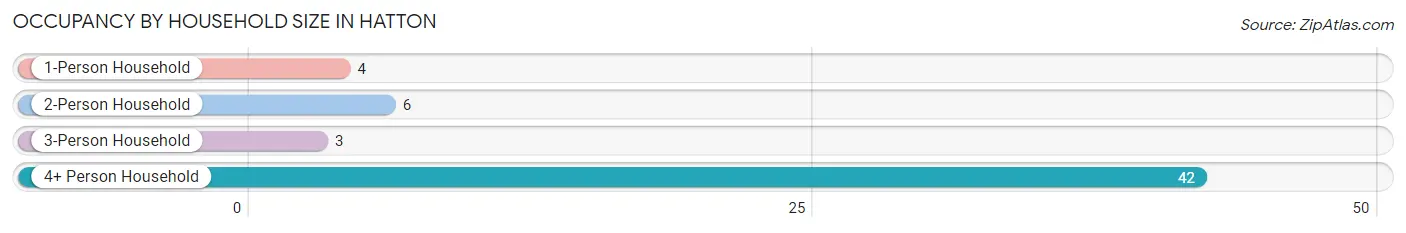
| Household Size | # Housing Units | % Housing Units |
| 1-Person Household | 4 | 7.3% |
| 2-Person Household | 6 | 10.9% |
| 3-Person Household | 3 | 5.4% |
| 4+ Person Household | 42 | 76.4% |
| Total Housing Units | 55 | 100.0% |
Occupancy by Ownership by Household Size in Hatton
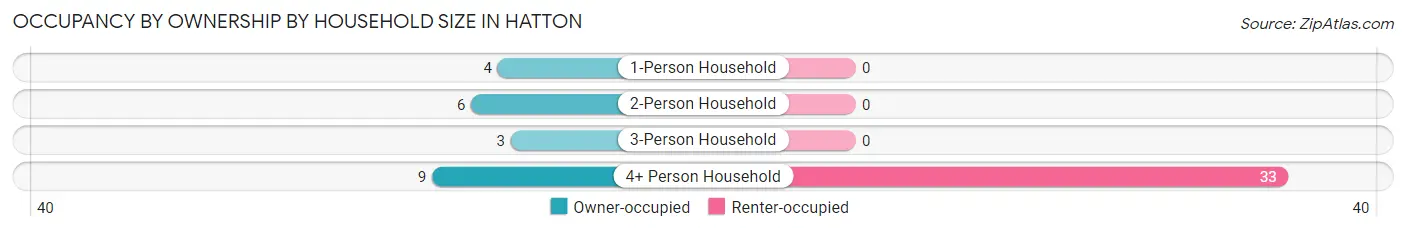
| Household Size | Owner-occupied | Renter-occupied |
| 1-Person Household | 4 (100.0%) | 0 (0.0%) |
| 2-Person Household | 6 (100.0%) | 0 (0.0%) |
| 3-Person Household | 3 (100.0%) | 0 (0.0%) |
| 4+ Person Household | 9 (21.4%) | 33 (78.6%) |
| Total Housing Units | 22 (40.0%) | 33 (60.0%) |
Occupancy by Educational Attainment in Hatton
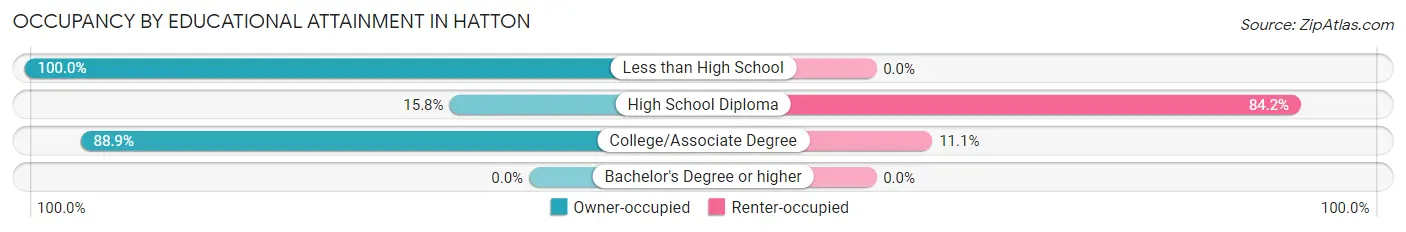
| Household Size | Owner-occupied | Renter-occupied |
| Less than High School | 8 (100.0%) | 0 (0.0%) |
| High School Diploma | 6 (15.8%) | 32 (84.2%) |
| College/Associate Degree | 8 (88.9%) | 1 (11.1%) |
| Bachelor's Degree or higher | 0 (0.0%) | 0 (0.0%) |
Occupancy by Age of Householder in Hatton
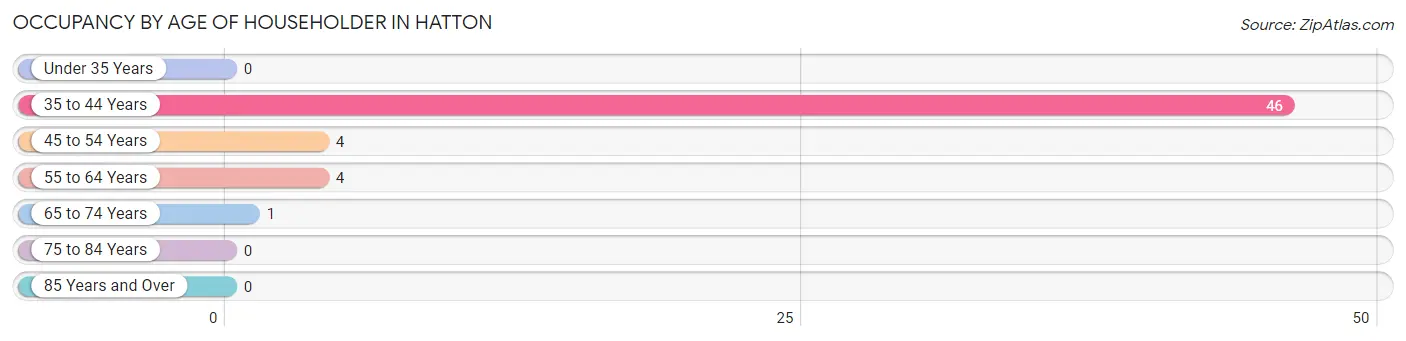
| Age Bracket | # Households | % Households |
| Under 35 Years | 0 | 0.0% |
| 35 to 44 Years | 46 | 83.6% |
| 45 to 54 Years | 4 | 7.3% |
| 55 to 64 Years | 4 | 7.3% |
| 65 to 74 Years | 1 | 1.8% |
| 75 to 84 Years | 0 | 0.0% |
| 85 Years and Over | 0 | 0.0% |
| Total | 55 | 100.0% |
Housing Finances in Hatton
Median Income by Occupancy in Hatton
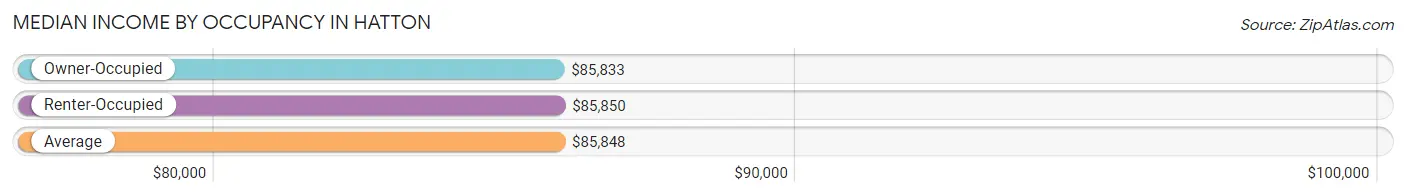
| Occupancy Type | # Households | Median Income |
| Owner-Occupied | 22 (40.0%) | $85,833 |
| Renter-Occupied | 33 (60.0%) | $85,850 |
| Average | 55 (100.0%) | $85,848 |
Occupancy by Householder Income Bracket in Hatton
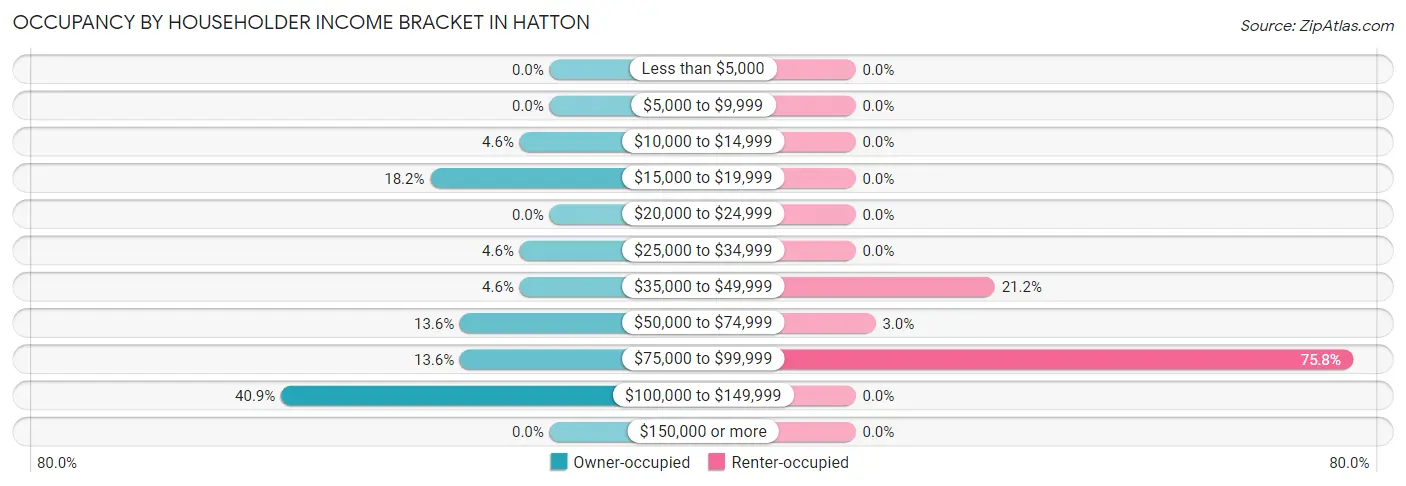
| Income Bracket | Owner-occupied | Renter-occupied |
| Less than $5,000 | 0 (0.0%) | 0 (0.0%) |
| $5,000 to $9,999 | 0 (0.0%) | 0 (0.0%) |
| $10,000 to $14,999 | 1 (4.5%) | 0 (0.0%) |
| $15,000 to $19,999 | 4 (18.2%) | 0 (0.0%) |
| $20,000 to $24,999 | 0 (0.0%) | 0 (0.0%) |
| $25,000 to $34,999 | 1 (4.5%) | 0 (0.0%) |
| $35,000 to $49,999 | 1 (4.5%) | 7 (21.2%) |
| $50,000 to $74,999 | 3 (13.6%) | 1 (3.0%) |
| $75,000 to $99,999 | 3 (13.6%) | 25 (75.8%) |
| $100,000 to $149,999 | 9 (40.9%) | 0 (0.0%) |
| $150,000 or more | 0 (0.0%) | 0 (0.0%) |
| Total | 22 (100.0%) | 33 (100.0%) |
Monthly Housing Cost Tiers in Hatton
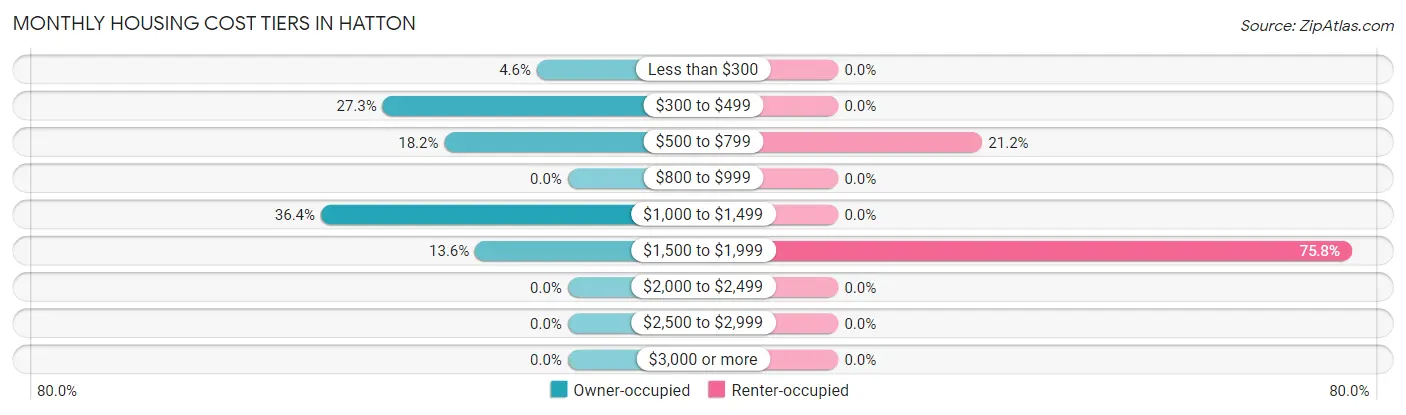
| Monthly Cost | Owner-occupied | Renter-occupied |
| Less than $300 | 1 (4.5%) | 0 (0.0%) |
| $300 to $499 | 6 (27.3%) | 0 (0.0%) |
| $500 to $799 | 4 (18.2%) | 7 (21.2%) |
| $800 to $999 | 0 (0.0%) | 0 (0.0%) |
| $1,000 to $1,499 | 8 (36.4%) | 0 (0.0%) |
| $1,500 to $1,999 | 3 (13.6%) | 25 (75.8%) |
| $2,000 to $2,499 | 0 (0.0%) | 0 (0.0%) |
| $2,500 to $2,999 | 0 (0.0%) | 0 (0.0%) |
| $3,000 or more | 0 (0.0%) | 0 (0.0%) |
| Total | 22 (100.0%) | 33 (100.0%) |
Physical Housing Characteristics in Hatton
Housing Structures in Hatton
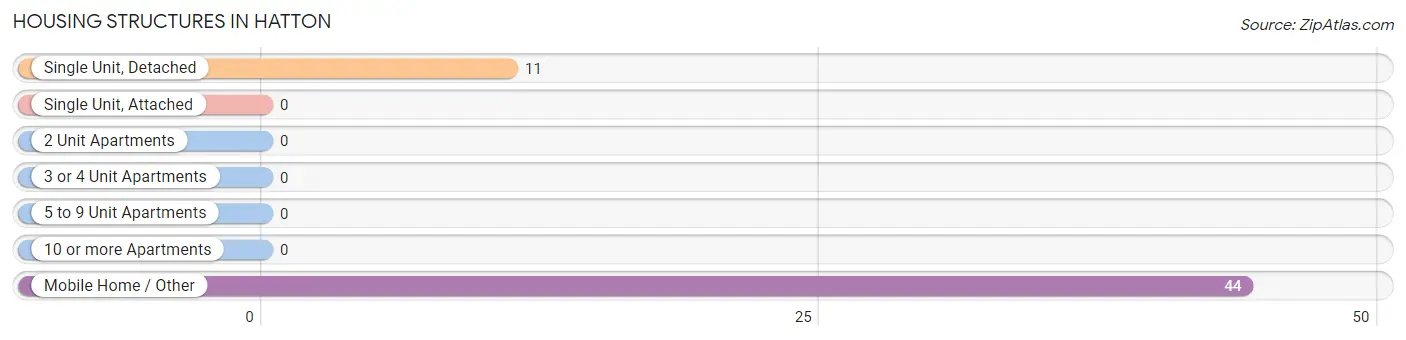
| Structure Type | # Housing Units | % Housing Units |
| Single Unit, Detached | 11 | 20.0% |
| Single Unit, Attached | 0 | 0.0% |
| 2 Unit Apartments | 0 | 0.0% |
| 3 or 4 Unit Apartments | 0 | 0.0% |
| 5 to 9 Unit Apartments | 0 | 0.0% |
| 10 or more Apartments | 0 | 0.0% |
| Mobile Home / Other | 44 | 80.0% |
| Total | 55 | 100.0% |
Housing Structures by Occupancy in Hatton
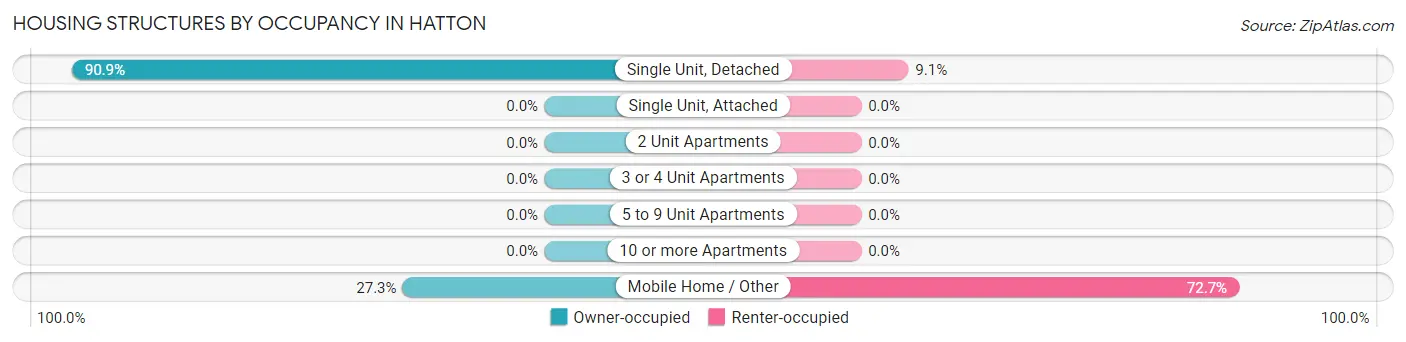
| Structure Type | Owner-occupied | Renter-occupied |
| Single Unit, Detached | 10 (90.9%) | 1 (9.1%) |
| Single Unit, Attached | 0 (0.0%) | 0 (0.0%) |
| 2 Unit Apartments | 0 (0.0%) | 0 (0.0%) |
| 3 or 4 Unit Apartments | 0 (0.0%) | 0 (0.0%) |
| 5 to 9 Unit Apartments | 0 (0.0%) | 0 (0.0%) |
| 10 or more Apartments | 0 (0.0%) | 0 (0.0%) |
| Mobile Home / Other | 12 (27.3%) | 32 (72.7%) |
| Total | 22 (40.0%) | 33 (60.0%) |
Housing Structures by Number of Rooms in Hatton
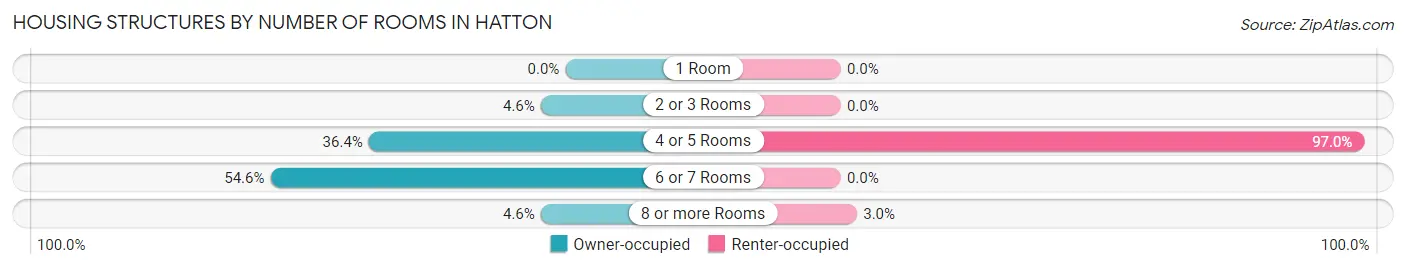
| Number of Rooms | Owner-occupied | Renter-occupied |
| 1 Room | 0 (0.0%) | 0 (0.0%) |
| 2 or 3 Rooms | 1 (4.5%) | 0 (0.0%) |
| 4 or 5 Rooms | 8 (36.4%) | 32 (97.0%) |
| 6 or 7 Rooms | 12 (54.5%) | 0 (0.0%) |
| 8 or more Rooms | 1 (4.5%) | 1 (3.0%) |
| Total | 22 (100.0%) | 33 (100.0%) |
Housing Structure by Heating Type in Hatton
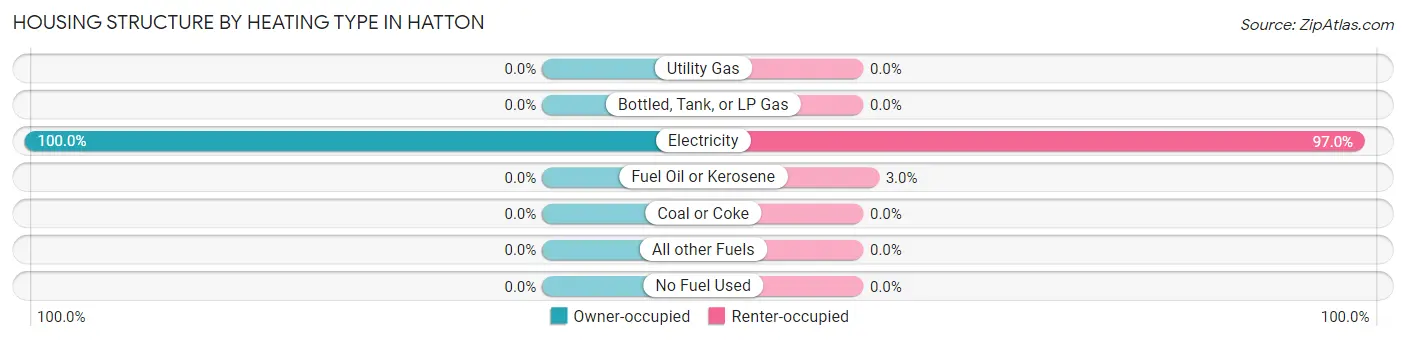
| Heating Type | Owner-occupied | Renter-occupied |
| Utility Gas | 0 (0.0%) | 0 (0.0%) |
| Bottled, Tank, or LP Gas | 0 (0.0%) | 0 (0.0%) |
| Electricity | 22 (100.0%) | 32 (97.0%) |
| Fuel Oil or Kerosene | 0 (0.0%) | 1 (3.0%) |
| Coal or Coke | 0 (0.0%) | 0 (0.0%) |
| All other Fuels | 0 (0.0%) | 0 (0.0%) |
| No Fuel Used | 0 (0.0%) | 0 (0.0%) |
| Total | 22 (100.0%) | 33 (100.0%) |
Household Vehicle Usage in Hatton
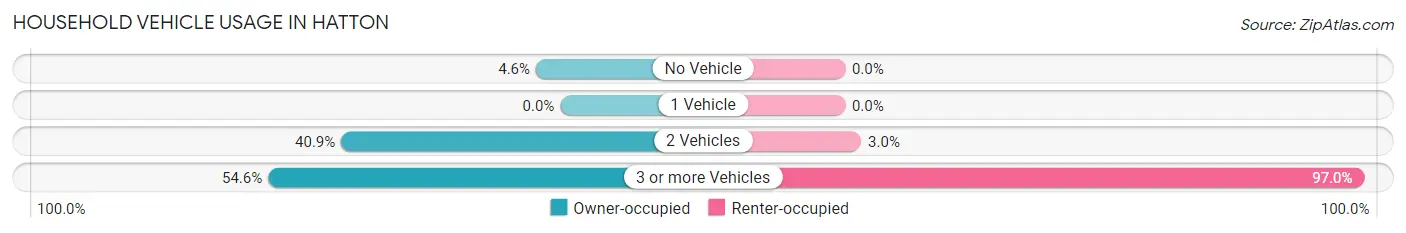
| Vehicles per Household | Owner-occupied | Renter-occupied |
| No Vehicle | 1 (4.5%) | 0 (0.0%) |
| 1 Vehicle | 0 (0.0%) | 0 (0.0%) |
| 2 Vehicles | 9 (40.9%) | 1 (3.0%) |
| 3 or more Vehicles | 12 (54.5%) | 32 (97.0%) |
| Total | 22 (100.0%) | 33 (100.0%) |
Real Estate & Mortgages in Hatton
Real Estate and Mortgage Overview in Hatton
| Characteristic | Without Mortgage | With Mortgage |
| Housing Units | 7 | 15 |
| Median Property Value | $9,999 | $117,500 |
| Median Household Income | $100,750 | $0 |
| Monthly Housing Costs | $442 | $0 |
| Real Estate Taxes | - | - |
Property Value by Mortgage Status in Hatton
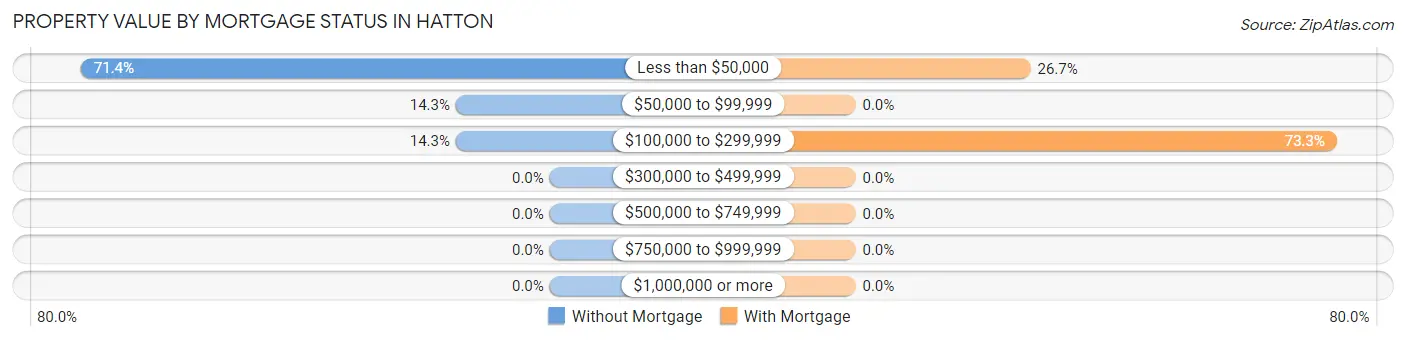
| Property Value | Without Mortgage | With Mortgage |
| Less than $50,000 | 5 (71.4%) | 4 (26.7%) |
| $50,000 to $99,999 | 1 (14.3%) | 0 (0.0%) |
| $100,000 to $299,999 | 1 (14.3%) | 11 (73.3%) |
| $300,000 to $499,999 | 0 (0.0%) | 0 (0.0%) |
| $500,000 to $749,999 | 0 (0.0%) | 0 (0.0%) |
| $750,000 to $999,999 | 0 (0.0%) | 0 (0.0%) |
| $1,000,000 or more | 0 (0.0%) | 0 (0.0%) |
| Total | 7 (100.0%) | 15 (100.0%) |
Household Income by Mortgage Status in Hatton
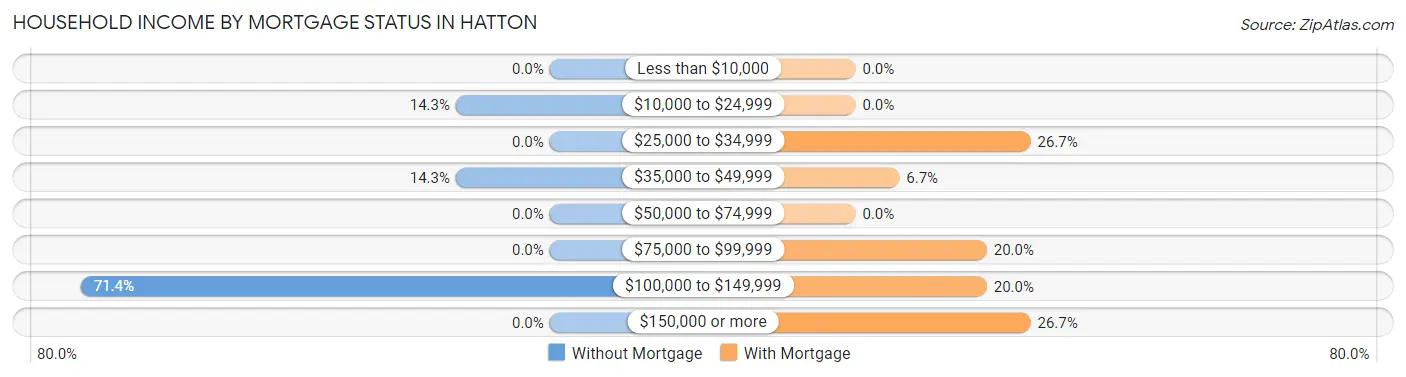
| Household Income | Without Mortgage | With Mortgage |
| Less than $10,000 | 0 (0.0%) | 0 (0.0%) |
| $10,000 to $24,999 | 1 (14.3%) | 0 (0.0%) |
| $25,000 to $34,999 | 0 (0.0%) | 4 (26.7%) |
| $35,000 to $49,999 | 1 (14.3%) | 1 (6.7%) |
| $50,000 to $74,999 | 0 (0.0%) | 0 (0.0%) |
| $75,000 to $99,999 | 0 (0.0%) | 3 (20.0%) |
| $100,000 to $149,999 | 5 (71.4%) | 3 (20.0%) |
| $150,000 or more | 0 (0.0%) | 4 (26.7%) |
| Total | 7 (100.0%) | 15 (100.0%) |
Property Value to Household Income Ratio in Hatton
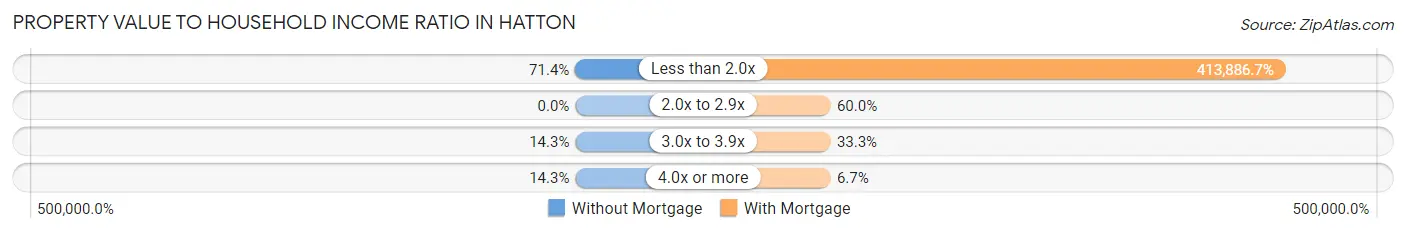
| Value-to-Income Ratio | Without Mortgage | With Mortgage |
| Less than 2.0x | 5 (71.4%) | 62,083 (413,886.7%) |
| 2.0x to 2.9x | 0 (0.0%) | 9 (60.0%) |
| 3.0x to 3.9x | 1 (14.3%) | 5 (33.3%) |
| 4.0x or more | 1 (14.3%) | 1 (6.7%) |
| Total | 7 (100.0%) | 15 (100.0%) |
Real Estate Taxes by Mortgage Status in Hatton
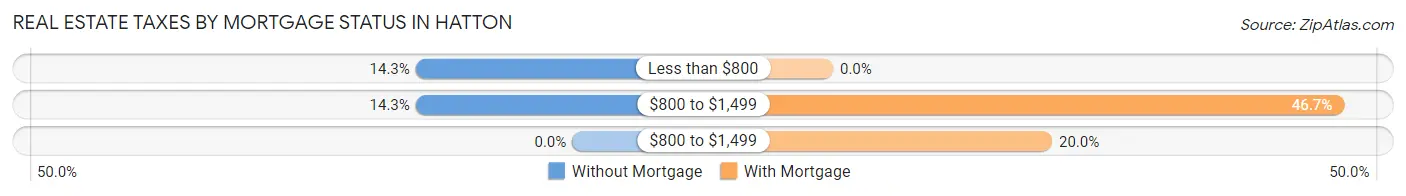
| Property Taxes | Without Mortgage | With Mortgage |
| Less than $800 | 1 (14.3%) | 0 (0.0%) |
| $800 to $1,499 | 1 (14.3%) | 7 (46.7%) |
| $800 to $1,499 | 0 (0.0%) | 3 (20.0%) |
| Total | 7 (100.0%) | 15 (100.0%) |
Health & Disability in Hatton
Health Insurance Coverage by Age in Hatton
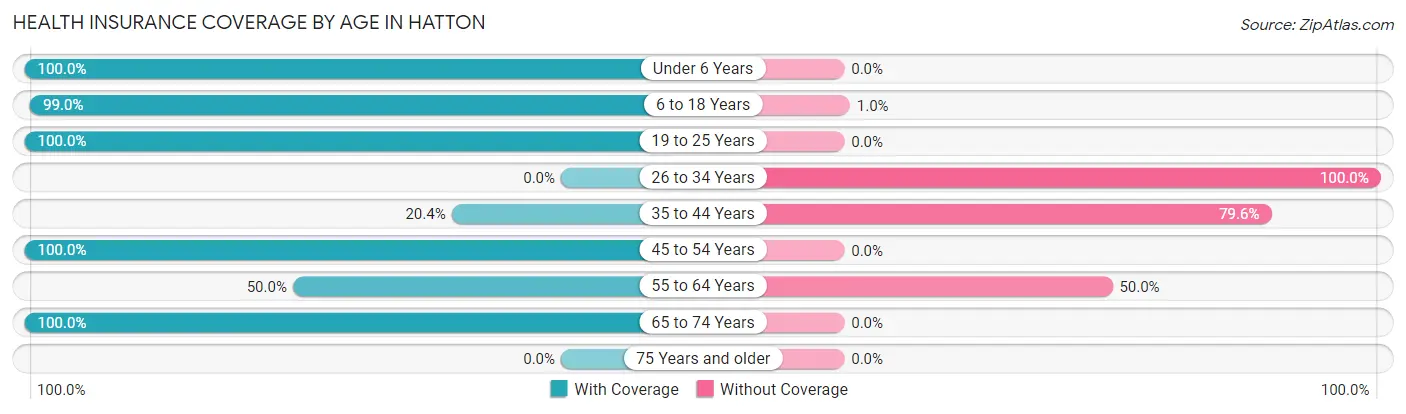
| Age Bracket | With Coverage | Without Coverage |
| Under 6 Years | 16 (100.0%) | 0 (0.0%) |
| 6 to 18 Years | 193 (99.0%) | 2 (1.0%) |
| 19 to 25 Years | 46 (100.0%) | 0 (0.0%) |
| 26 to 34 Years | 0 (0.0%) | 13 (100.0%) |
| 35 to 44 Years | 42 (20.4%) | 164 (79.6%) |
| 45 to 54 Years | 5 (100.0%) | 0 (0.0%) |
| 55 to 64 Years | 4 (50.0%) | 4 (50.0%) |
| 65 to 74 Years | 3 (100.0%) | 0 (0.0%) |
| 75 Years and older | 0 (0.0%) | 0 (0.0%) |
| Total | 309 (62.8%) | 183 (37.2%) |
Health Insurance Coverage by Citizenship Status in Hatton
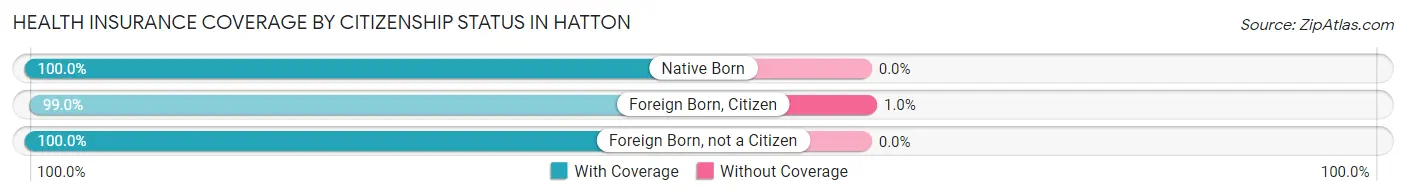
| Citizenship Status | With Coverage | Without Coverage |
| Native Born | 16 (100.0%) | 0 (0.0%) |
| Foreign Born, Citizen | 193 (99.0%) | 2 (1.0%) |
| Foreign Born, not a Citizen | 46 (100.0%) | 0 (0.0%) |
Health Insurance Coverage by Household Income in Hatton
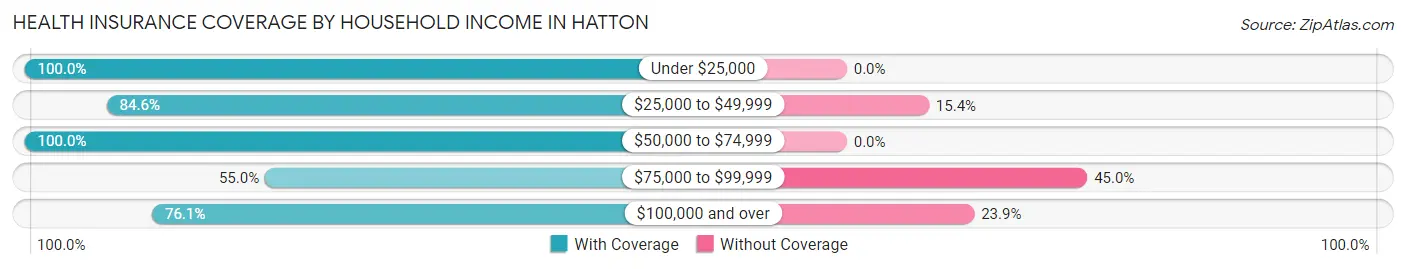
| Household Income | With Coverage | Without Coverage |
| Under $25,000 | 11 (100.0%) | 0 (0.0%) |
| $25,000 to $49,999 | 44 (84.6%) | 8 (15.4%) |
| $50,000 to $74,999 | 9 (100.0%) | 0 (0.0%) |
| $75,000 to $99,999 | 194 (55.0%) | 159 (45.0%) |
| $100,000 and over | 51 (76.1%) | 16 (23.9%) |
Public vs Private Health Insurance Coverage by Age in Hatton
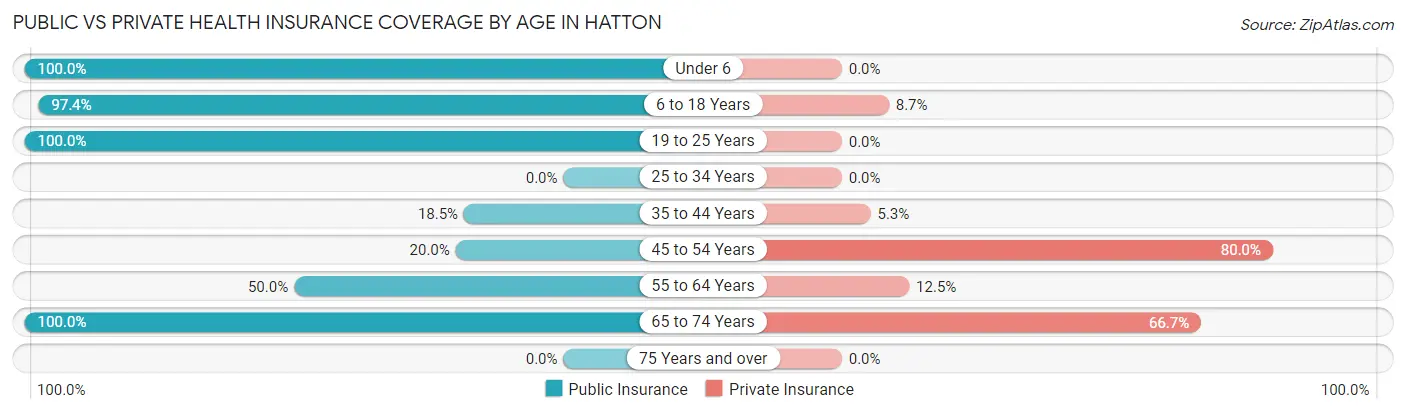
| Age Bracket | Public Insurance | Private Insurance |
| Under 6 | 16 (100.0%) | 0 (0.0%) |
| 6 to 18 Years | 190 (97.4%) | 17 (8.7%) |
| 19 to 25 Years | 46 (100.0%) | 0 (0.0%) |
| 25 to 34 Years | 0 (0.0%) | 0 (0.0%) |
| 35 to 44 Years | 38 (18.4%) | 11 (5.3%) |
| 45 to 54 Years | 1 (20.0%) | 4 (80.0%) |
| 55 to 64 Years | 4 (50.0%) | 1 (12.5%) |
| 65 to 74 Years | 3 (100.0%) | 2 (66.7%) |
| 75 Years and over | 0 (0.0%) | 0 (0.0%) |
| Total | 298 (60.6%) | 35 (7.1%) |
Disability Status by Sex by Age in Hatton
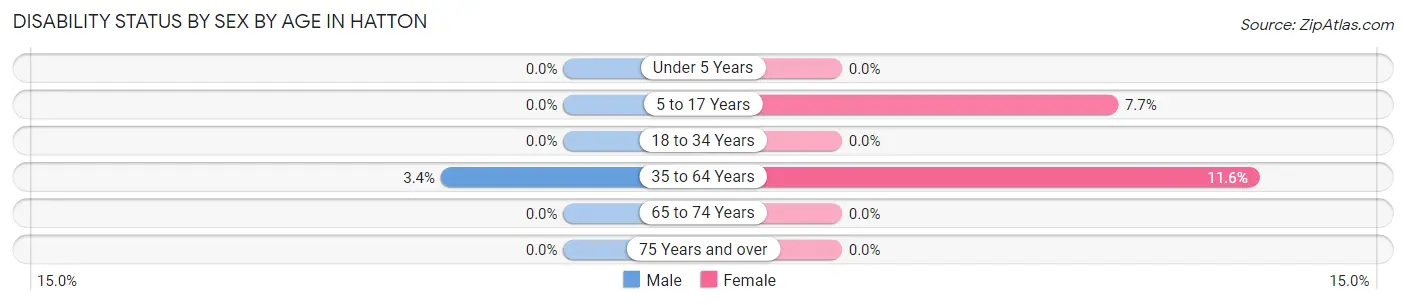
| Age Bracket | Male | Female |
| Under 5 Years | 0 (0.0%) | 0 (0.0%) |
| 5 to 17 Years | 0 (0.0%) | 7 (7.7%) |
| 18 to 34 Years | 0 (0.0%) | 0 (0.0%) |
| 35 to 64 Years | 6 (3.4%) | 5 (11.6%) |
| 65 to 74 Years | 0 (0.0%) | 0 (0.0%) |
| 75 Years and over | 0 (0.0%) | 0 (0.0%) |
Disability Class by Sex by Age in Hatton
Disability Class: Hearing Difficulty
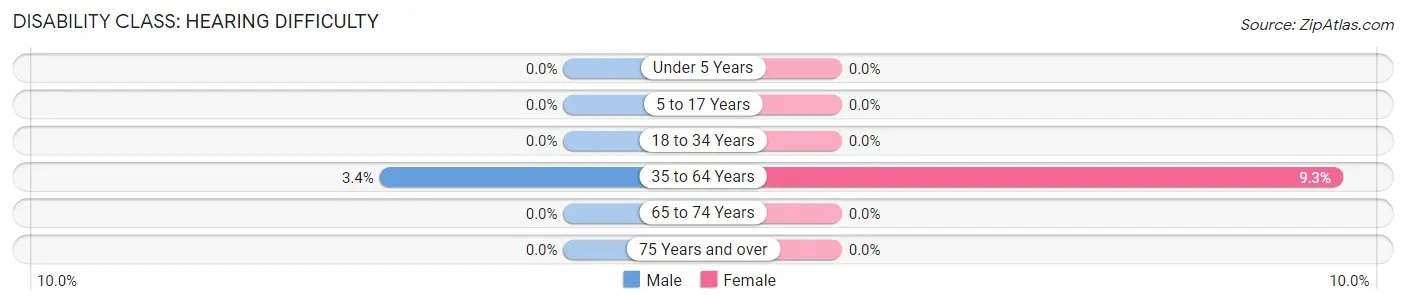
| Age Bracket | Male | Female |
| Under 5 Years | 0 (0.0%) | 0 (0.0%) |
| 5 to 17 Years | 0 (0.0%) | 0 (0.0%) |
| 18 to 34 Years | 0 (0.0%) | 0 (0.0%) |
| 35 to 64 Years | 6 (3.4%) | 4 (9.3%) |
| 65 to 74 Years | 0 (0.0%) | 0 (0.0%) |
| 75 Years and over | 0 (0.0%) | 0 (0.0%) |
Disability Class: Vision Difficulty
| Age Bracket | Male | Female |
| Under 5 Years | 0 (0.0%) | 0 (0.0%) |
| 5 to 17 Years | 0 (0.0%) | 0 (0.0%) |
| 18 to 34 Years | 0 (0.0%) | 0 (0.0%) |
| 35 to 64 Years | 0 (0.0%) | 0 (0.0%) |
| 65 to 74 Years | 0 (0.0%) | 0 (0.0%) |
| 75 Years and over | 0 (0.0%) | 0 (0.0%) |
Disability Class: Cognitive Difficulty
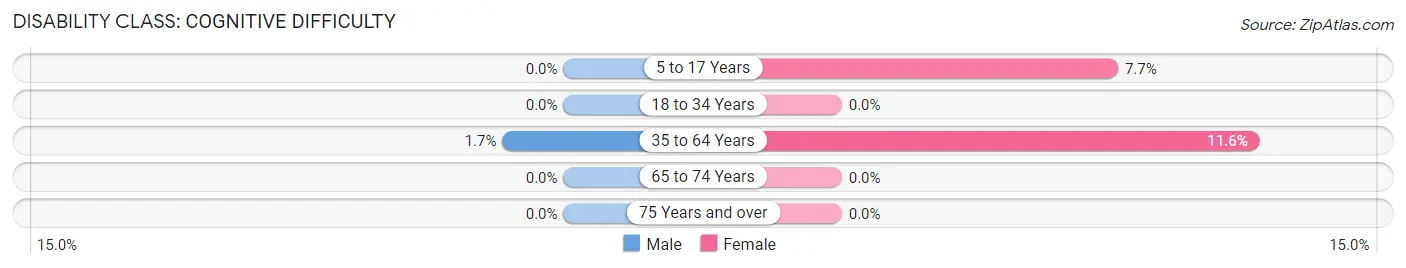
| Age Bracket | Male | Female |
| 5 to 17 Years | 0 (0.0%) | 7 (7.7%) |
| 18 to 34 Years | 0 (0.0%) | 0 (0.0%) |
| 35 to 64 Years | 3 (1.7%) | 5 (11.6%) |
| 65 to 74 Years | 0 (0.0%) | 0 (0.0%) |
| 75 Years and over | 0 (0.0%) | 0 (0.0%) |
Disability Class: Ambulatory Difficulty
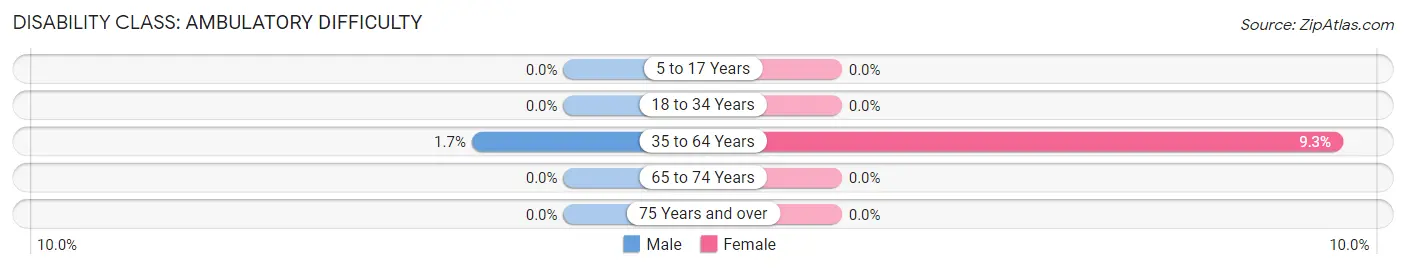
| Age Bracket | Male | Female |
| 5 to 17 Years | 0 (0.0%) | 0 (0.0%) |
| 18 to 34 Years | 0 (0.0%) | 0 (0.0%) |
| 35 to 64 Years | 3 (1.7%) | 4 (9.3%) |
| 65 to 74 Years | 0 (0.0%) | 0 (0.0%) |
| 75 Years and over | 0 (0.0%) | 0 (0.0%) |
Disability Class: Self-Care Difficulty
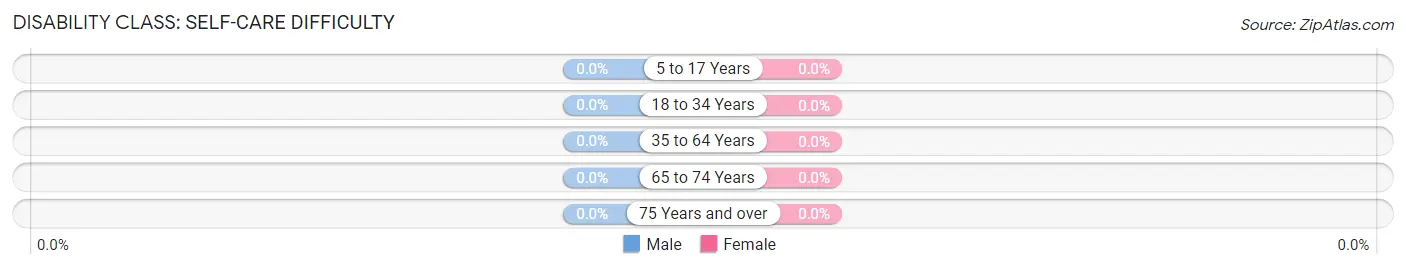
| Age Bracket | Male | Female |
| 5 to 17 Years | 0 (0.0%) | 0 (0.0%) |
| 18 to 34 Years | 0 (0.0%) | 0 (0.0%) |
| 35 to 64 Years | 0 (0.0%) | 0 (0.0%) |
| 65 to 74 Years | 0 (0.0%) | 0 (0.0%) |
| 75 Years and over | 0 (0.0%) | 0 (0.0%) |
Technology Access in Hatton
Computing Device Access in Hatton
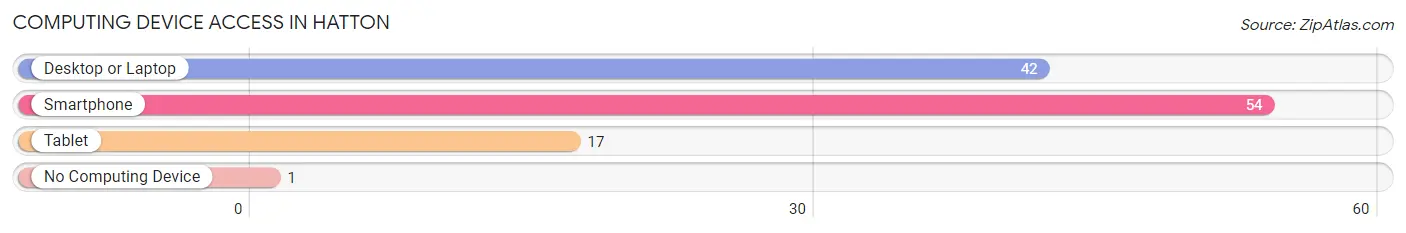
| Device Type | # Households | % Households |
| Desktop or Laptop | 42 | 76.4% |
| Smartphone | 54 | 98.2% |
| Tablet | 17 | 30.9% |
| No Computing Device | 1 | 1.8% |
| Total | 55 | 100.0% |
Internet Access in Hatton
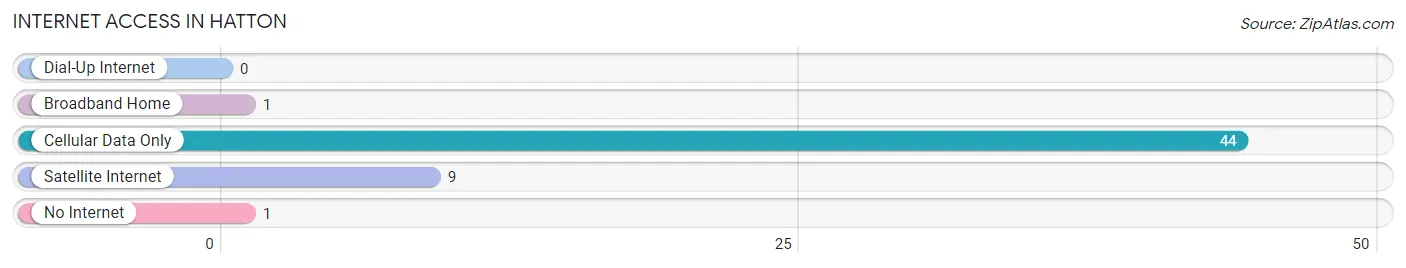
| Internet Type | # Households | % Households |
| Dial-Up Internet | 0 | 0.0% |
| Broadband Home | 1 | 1.8% |
| Cellular Data Only | 44 | 80.0% |
| Satellite Internet | 9 | 16.4% |
| No Internet | 1 | 1.8% |
| Total | 55 | 100.0% |
Hatton Summary
Hatton is a small town located in the state of Washington, United States. It is situated in the northern part of the state, in the county of Whatcom. The town is located on the banks of the Nooksack River, and is surrounded by the Cascade Mountains. The town has a population of approximately 1,000 people, and is a popular destination for outdoor recreation.
Geography
Hatton is located in the northern part of Washington State, in the county of Whatcom. The town is situated on the banks of the Nooksack River, and is surrounded by the Cascade Mountains. The town is located at an elevation of approximately 1,000 feet, and has a total area of 0.7 square miles. The town is located approximately 25 miles north of Bellingham, and is accessible by car via State Route 539.
Climate
Hatton has a temperate climate, with warm summers and cool winters. The average temperature in the summer months is around 70 degrees Fahrenheit, while the average temperature in the winter months is around 40 degrees Fahrenheit. The town receives an average of 40 inches of precipitation per year, with most of the precipitation occurring in the winter months.
Demographics
As of the 2010 census, the population of Hatton was 1,000 people. The racial makeup of the town was 94.2% White, 0.7% African American, 0.7% Native American, 0.7% Asian, 0.7% from other races, and 2.7% from two or more races. The median household income in the town was $45,000, and the median age was 44 years.
Economy
Hatton’s economy is largely based on tourism and outdoor recreation. The town is a popular destination for fishing, camping, and hiking, and is home to several popular outdoor attractions, such as the Nooksack Falls and the Hatton Lake Trail. The town is also home to several small businesses, including restaurants, cafes, and retail stores.
History
Hatton was first settled in the late 1800s by settlers from the East Coast. The town was originally known as “Hatton’s Landing”, and was a popular stop for travelers heading to the nearby towns of Bellingham and Ferndale. The town was officially incorporated in 1910, and the population began to grow steadily over the next few decades. In the 1950s, the town began to attract more tourists, and the economy shifted to focus on outdoor recreation and tourism.
Today, Hatton is a popular destination for outdoor recreation and tourism. The town is home to several popular attractions, such as the Nooksack Falls and the Hatton Lake Trail. The town is also home to several small businesses, including restaurants, cafes, and retail stores.
Common Questions
What is Per Capita Income in Hatton?
Per Capita income in Hatton is $19,264.
What is the Median Family Income in Hatton?
Median Family Income in Hatton is $86,205.
What is the Median Household income in Hatton?
Median Household Income in Hatton is $85,848.
What is Income or Wage Gap in Hatton?
Income or Wage Gap in Hatton is 33.4%.
Women in Hatton earn 66.6 cents for every dollar earned by a man.
What is Inequality or Gini Index in Hatton?
Inequality or Gini Index in Hatton is 0.20.
What is the Total Population of Hatton?
Total Population of Hatton is 492.
What is the Total Male Population of Hatton?
Total Male Population of Hatton is 260.
What is the Total Female Population of Hatton?
Total Female Population of Hatton is 232.
What is the Ratio of Males per 100 Females in Hatton?
There are 112.07 Males per 100 Females in Hatton.
What is the Ratio of Females per 100 Males in Hatton?
There are 89.23 Females per 100 Males in Hatton.
What is the Median Population Age in Hatton?
Median Population Age in Hatton is 21.8 Years.
What is the Average Family Size in Hatton
Average Family Size in Hatton is 10.0 People.
What is the Average Household Size in Hatton
Average Household Size in Hatton is 8.9 People.
How Large is the Labor Force in Hatton?
There are 248 People in the Labor Forcein in Hatton.
What is the Percentage of People in the Labor Force in Hatton?
77.3% of People are in the Labor Force in Hatton.