Cities with the Highest Percentage of Births to Unmarried Women over the Age of 35 in Michigan
RELATED REPORTS & OPTIONS
Highest Illegitimacy | Women 35+
Michigan
Compare Cities
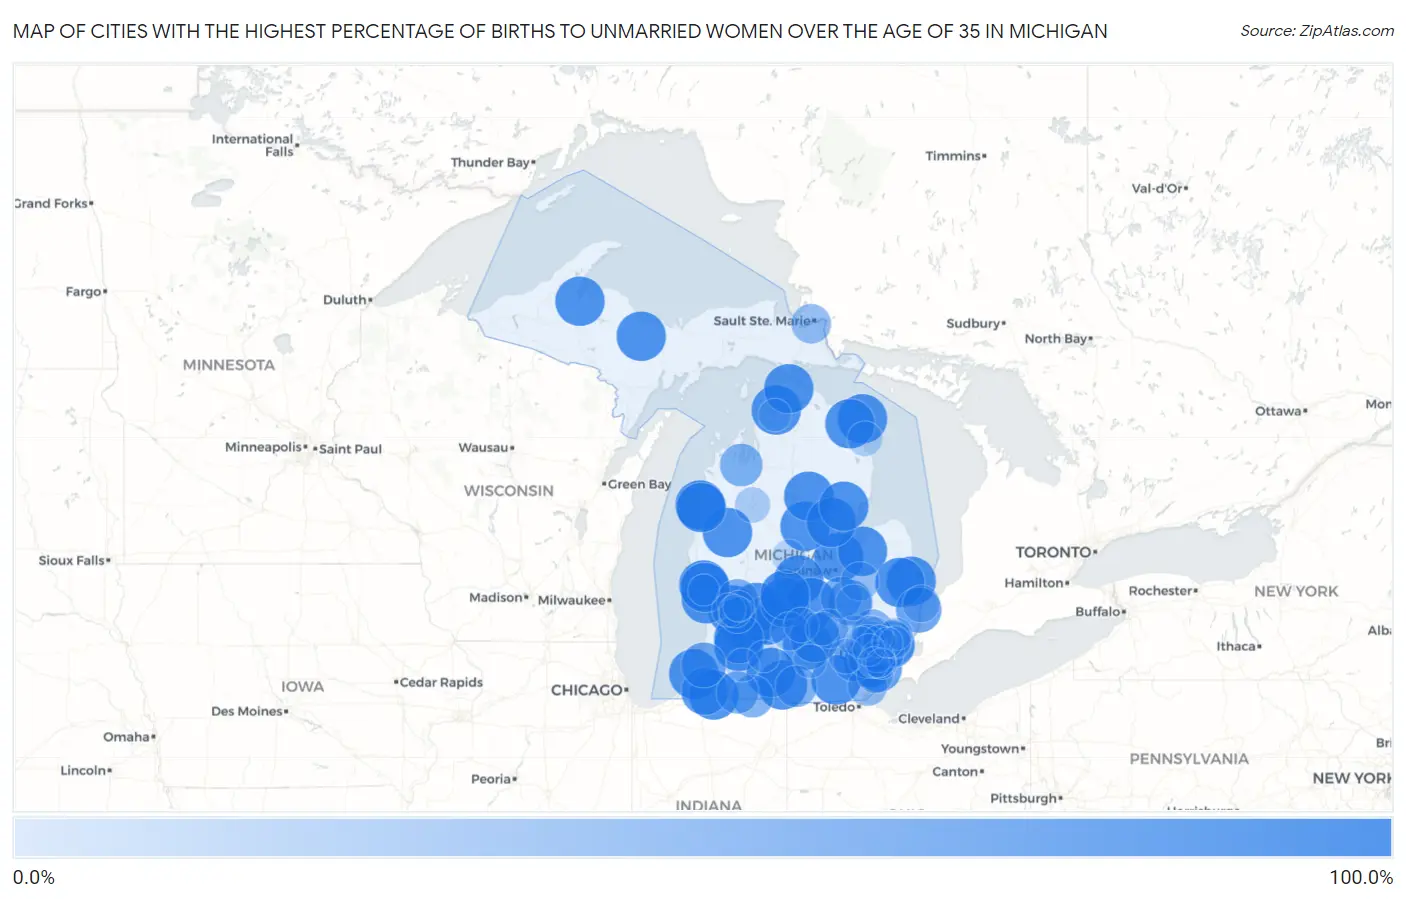
Map of Cities with the Highest Percentage of Births to Unmarried Women over the Age of 35 in Michigan
0.0%
100.0%
Cities with the Highest Percentage of Births to Unmarried Women over the Age of 35 in Michigan
| City | % Unmarried | vs State | vs National | |
| 1. | Muskegon | 100.0% | 20.9%(+79.1)#1 | 20.1%(+79.9)#4 |
| 2. | Bay City | 100.0% | 20.9%(+79.1)#2 | 20.1%(+79.9)#8 |
| 3. | Inkster | 100.0% | 20.9%(+79.1)#3 | 20.1%(+79.9)#19 |
| 4. | Romulus | 100.0% | 20.9%(+79.1)#4 | 20.1%(+79.9)#22 |
| 5. | Grandville | 100.0% | 20.9%(+79.1)#5 | 20.1%(+79.9)#75 |
| 6. | Grand Haven | 100.0% | 20.9%(+79.1)#6 | 20.1%(+79.9)#154 |
| 7. | Muskegon Heights | 100.0% | 20.9%(+79.1)#7 | 20.1%(+79.9)#187 |
| 8. | Tecumseh | 100.0% | 20.9%(+79.1)#8 | 20.1%(+79.9)#224 |
| 9. | Fair Plain | 100.0% | 20.9%(+79.1)#9 | 20.1%(+79.9)#284 |
| 10. | Manistee | 100.0% | 20.9%(+79.1)#10 | 20.1%(+79.9)#306 |
| 11. | Middleville | 100.0% | 20.9%(+79.1)#11 | 20.1%(+79.9)#436 |
| 12. | Lowell | 100.0% | 20.9%(+79.1)#12 | 20.1%(+79.9)#451 |
| 13. | Plainwell | 100.0% | 20.9%(+79.1)#13 | 20.1%(+79.9)#471 |
| 14. | Gladwin | 100.0% | 20.9%(+79.1)#14 | 20.1%(+79.9)#538 |
| 15. | Ithaca | 100.0% | 20.9%(+79.1)#15 | 20.1%(+79.9)#561 |
| 16. | K I Sawyer | 100.0% | 20.9%(+79.1)#16 | 20.1%(+79.9)#563 |
| 17. | St Helen | 100.0% | 20.9%(+79.1)#17 | 20.1%(+79.9)#566 |
| 18. | Croswell | 100.0% | 20.9%(+79.1)#18 | 20.1%(+79.9)#610 |
| 19. | Leslie | 100.0% | 20.9%(+79.1)#19 | 20.1%(+79.9)#681 |
| 20. | Lake Odessa | 100.0% | 20.9%(+79.1)#20 | 20.1%(+79.9)#686 |
| 21. | L Anse | 100.0% | 20.9%(+79.1)#21 | 20.1%(+79.9)#725 |
| 22. | Ovid | 100.0% | 20.9%(+79.1)#22 | 20.1%(+79.9)#844 |
| 23. | Quincy | 100.0% | 20.9%(+79.1)#23 | 20.1%(+79.9)#882 |
| 24. | Edwardsburg | 100.0% | 20.9%(+79.1)#24 | 20.1%(+79.9)#892 |
| 25. | Harbor Springs | 100.0% | 20.9%(+79.1)#25 | 20.1%(+79.9)#942 |
| 26. | Baldwin | 100.0% | 20.9%(+79.1)#26 | 20.1%(+79.9)#965 |
| 27. | Presque Isle Harbor | 100.0% | 20.9%(+79.1)#27 | 20.1%(+79.9)#1,106 |
| 28. | Unionville | 100.0% | 20.9%(+79.1)#28 | 20.1%(+79.9)#1,150 |
| 29. | Peck | 100.0% | 20.9%(+79.1)#29 | 20.1%(+79.9)#1,178 |
| 30. | Martin | 100.0% | 20.9%(+79.1)#30 | 20.1%(+79.9)#1,197 |
| 31. | Dansville | 100.0% | 20.9%(+79.1)#31 | 20.1%(+79.9)#1,198 |
| 32. | Oak Hill | 100.0% | 20.9%(+79.1)#32 | 20.1%(+79.9)#1,206 |
| 33. | Pewamo | 100.0% | 20.9%(+79.1)#33 | 20.1%(+79.9)#1,219 |
| 34. | Sterling | 100.0% | 20.9%(+79.1)#34 | 20.1%(+79.9)#1,224 |
| 35. | Whittemore | 100.0% | 20.9%(+79.1)#35 | 20.1%(+79.9)#1,245 |
| 36. | Carp Lake | 100.0% | 20.9%(+79.1)#36 | 20.1%(+79.9)#1,255 |
| 37. | Hubbardston | 100.0% | 20.9%(+79.1)#37 | 20.1%(+79.9)#1,257 |
| 38. | Ramsay | 100.0% | 20.9%(+79.1)#38 | 20.1%(+79.9)#1,332 |
| 39. | Posen | 100.0% | 20.9%(+79.1)#39 | 20.1%(+79.9)#1,353 |
| 40. | Burlington | 100.0% | 20.9%(+79.1)#40 | 20.1%(+79.9)#1,361 |
| 41. | Niles | 90.5% | 20.9%(+69.6)#41 | 20.1%(+70.4)#1,476 |
| 42. | Trenton | 85.4% | 20.9%(+64.5)#42 | 20.1%(+65.3)#1,508 |
| 43. | Marysville | 81.1% | 20.9%(+60.2)#43 | 20.1%(+61.0)#1,549 |
| 44. | Flint | 81.0% | 20.9%(+60.1)#44 | 20.1%(+60.9)#1,550 |
| 45. | Watervliet | 80.0% | 20.9%(+59.1)#45 | 20.1%(+59.9)#1,560 |
| 46. | Eastpointe | 77.5% | 20.9%(+56.6)#46 | 20.1%(+57.4)#1,587 |
| 47. | Traverse City | 68.4% | 20.9%(+47.5)#47 | 20.1%(+48.3)#1,704 |
| 48. | Sturgis | 67.7% | 20.9%(+46.8)#48 | 20.1%(+47.6)#1,711 |
| 49. | Constantine | 66.7% | 20.9%(+45.8)#49 | 20.1%(+46.6)#1,734 |
| 50. | Harper Woods | 65.4% | 20.9%(+44.5)#50 | 20.1%(+45.3)#1,755 |
| 51. | Comstock Park | 64.7% | 20.9%(+43.8)#51 | 20.1%(+44.6)#1,769 |
| 52. | Flushing | 64.3% | 20.9%(+43.4)#52 | 20.1%(+44.2)#1,784 |
| 53. | Hillsdale | 62.9% | 20.9%(+42.0)#53 | 20.1%(+42.8)#1,813 |
| 54. | Pontiac | 61.5% | 20.9%(+40.6)#54 | 20.1%(+41.4)#1,853 |
| 55. | Ypsilanti | 59.7% | 20.9%(+38.8)#55 | 20.1%(+39.6)#1,897 |
| 56. | Detroit | 58.5% | 20.9%(+37.6)#56 | 20.1%(+38.4)#1,916 |
| 57. | Chassell | 57.1% | 20.9%(+36.2)#57 | 20.1%(+37.0)#1,961 |
| 58. | Sault Ste Marie | 54.5% | 20.9%(+33.6)#58 | 20.1%(+34.4)#2,006 |
| 59. | Monroe | 53.1% | 20.9%(+32.2)#59 | 20.1%(+33.0)#2,036 |
| 60. | Milford | 52.9% | 20.9%(+32.0)#60 | 20.1%(+32.8)#2,042 |
| 61. | Fowlerville | 52.6% | 20.9%(+31.7)#61 | 20.1%(+32.5)#2,051 |
| 62. | Southfield | 50.3% | 20.9%(+29.4)#62 | 20.1%(+30.2)#2,105 |
| 63. | Wayne | 50.0% | 20.9%(+29.1)#63 | 20.1%(+29.9)#2,117 |
| 64. | Potterville | 50.0% | 20.9%(+29.1)#64 | 20.1%(+29.9)#2,134 |
| 65. | Millington | 50.0% | 20.9%(+29.1)#65 | 20.1%(+29.9)#2,146 |
| 66. | Fraser | 47.6% | 20.9%(+26.7)#66 | 20.1%(+27.5)#2,207 |
| 67. | Port Huron | 43.5% | 20.9%(+22.6)#67 | 20.1%(+23.4)#2,331 |
| 68. | Oak Park | 42.5% | 20.9%(+21.6)#68 | 20.1%(+22.4)#2,362 |
| 69. | Franklin | 40.0% | 20.9%(+19.1)#69 | 20.1%(+19.9)#2,440 |
| 70. | South Rockwood | 40.0% | 20.9%(+19.1)#70 | 20.1%(+19.9)#2,443 |
| 71. | Cutlerville | 39.6% | 20.9%(+18.7)#71 | 20.1%(+19.5)#2,461 |
| 72. | Bloomfield Hills | 38.5% | 20.9%(+17.6)#72 | 20.1%(+18.4)#2,488 |
| 73. | Burton | 38.3% | 20.9%(+17.4)#73 | 20.1%(+18.2)#2,492 |
| 74. | Allen Park | 38.0% | 20.9%(+17.1)#74 | 20.1%(+17.9)#2,509 |
| 75. | Keego Harbor | 37.5% | 20.9%(+16.6)#75 | 20.1%(+17.4)#2,532 |
| 76. | Farmington Hills | 37.1% | 20.9%(+16.2)#76 | 20.1%(+17.0)#2,548 |
| 77. | Cadillac | 35.9% | 20.9%(+15.0)#77 | 20.1%(+15.8)#2,588 |
| 78. | Alpena | 33.3% | 20.9%(+12.4)#78 | 20.1%(+13.2)#2,694 |
| 79. | Barton Hills | 33.3% | 20.9%(+12.4)#79 | 20.1%(+13.2)#2,726 |
| 80. | Lansing | 33.0% | 20.9%(+12.1)#80 | 20.1%(+12.9)#2,735 |
| 81. | Jackson | 27.3% | 20.9%(+6.40)#81 | 20.1%(+7.20)#2,969 |
| 82. | Webberville | 27.3% | 20.9%(+6.40)#82 | 20.1%(+7.20)#2,974 |
| 83. | Mount Pleasant | 27.1% | 20.9%(+6.20)#83 | 20.1%(+7.00)#2,980 |
| 84. | Jenison | 27.0% | 20.9%(+6.10)#84 | 20.1%(+6.90)#2,986 |
| 85. | Portage | 25.8% | 20.9%(+4.90)#85 | 20.1%(+5.70)#3,042 |
| 86. | Petoskey | 23.1% | 20.9%(+2.20)#86 | 20.1%(+3.00)#3,164 |
| 87. | Mount Clemens | 22.5% | 20.9%(+1.60)#87 | 20.1%(+2.40)#3,181 |
| 88. | Lincoln Park | 21.7% | 20.9%(+0.800)#88 | 20.1%(+1.60)#3,216 |
| 89. | Wyoming | 21.6% | 20.9%(+0.700)#89 | 20.1%(+1.50)#3,221 |
| 90. | Berkley | 21.1% | 20.9%(+0.200)#90 | 20.1%(+1.00)#3,250 |
| 91. | Dearborn | 21.0% | 20.9%(+0.100)#91 | 20.1%(+0.900)#3,255 |
| 92. | St Clair Shores | 20.2% | 20.9%(-0.700)#92 | 20.1%(+0.100)#3,296 |
| 93. | Novi | 19.9% | 20.9%(-1.00)#93 | 20.1%(-0.200)#3,319 |
| 94. | Battle Creek | 19.7% | 20.9%(-1.20)#94 | 20.1%(-0.400)#3,325 |
| 95. | Livonia | 19.6% | 20.9%(-1.30)#95 | 20.1%(-0.500)#3,326 |
| 96. | Norton Shores | 15.9% | 20.9%(-5.00)#96 | 20.1%(-4.20)#3,518 |
| 97. | Grand Rapids | 15.3% | 20.9%(-5.60)#97 | 20.1%(-4.80)#3,550 |
| 98. | Taylor | 15.3% | 20.9%(-5.60)#98 | 20.1%(-4.80)#3,553 |
| 99. | Wyandotte | 13.9% | 20.9%(-7.00)#99 | 20.1%(-6.20)#3,645 |
| 100. | Warren | 12.3% | 20.9%(-8.60)#100 | 20.1%(-7.80)#3,733 |
Common Questions
What are the Top 10 Cities with the Highest Percentage of Births to Unmarried Women over the Age of 35 in Michigan?
Top 10 Cities with the Highest Percentage of Births to Unmarried Women over the Age of 35 in Michigan are:
#1
100.0%
#2
100.0%
#3
100.0%
#4
100.0%
#5
100.0%
#6
100.0%
#7
100.0%
#8
100.0%
#9
100.0%
#10
100.0%
What city has the Highest Percentage of Births to Unmarried Women over the Age of 35 in Michigan?
Muskegon has the Highest Percentage of Births to Unmarried Women over the Age of 35 in Michigan with 100.0%.
What is the Percentage of Births to Unmarried Women over the Age of 35 in the State of Michigan?
Percentage of Births to Unmarried Women over the Age of 35 in Michigan is 20.9%.
What is the Percentage of Births to Unmarried Women over the Age of 35 in the United States?
Percentage of Births to Unmarried Women over the Age of 35 in the United States is 20.1%.