Cities with the Highest Percentage of Births to Unmarried Women over the Age of 35 in Pennsylvania
RELATED REPORTS & OPTIONS
Highest Illegitimacy | Women 35+
Pennsylvania
Compare Cities
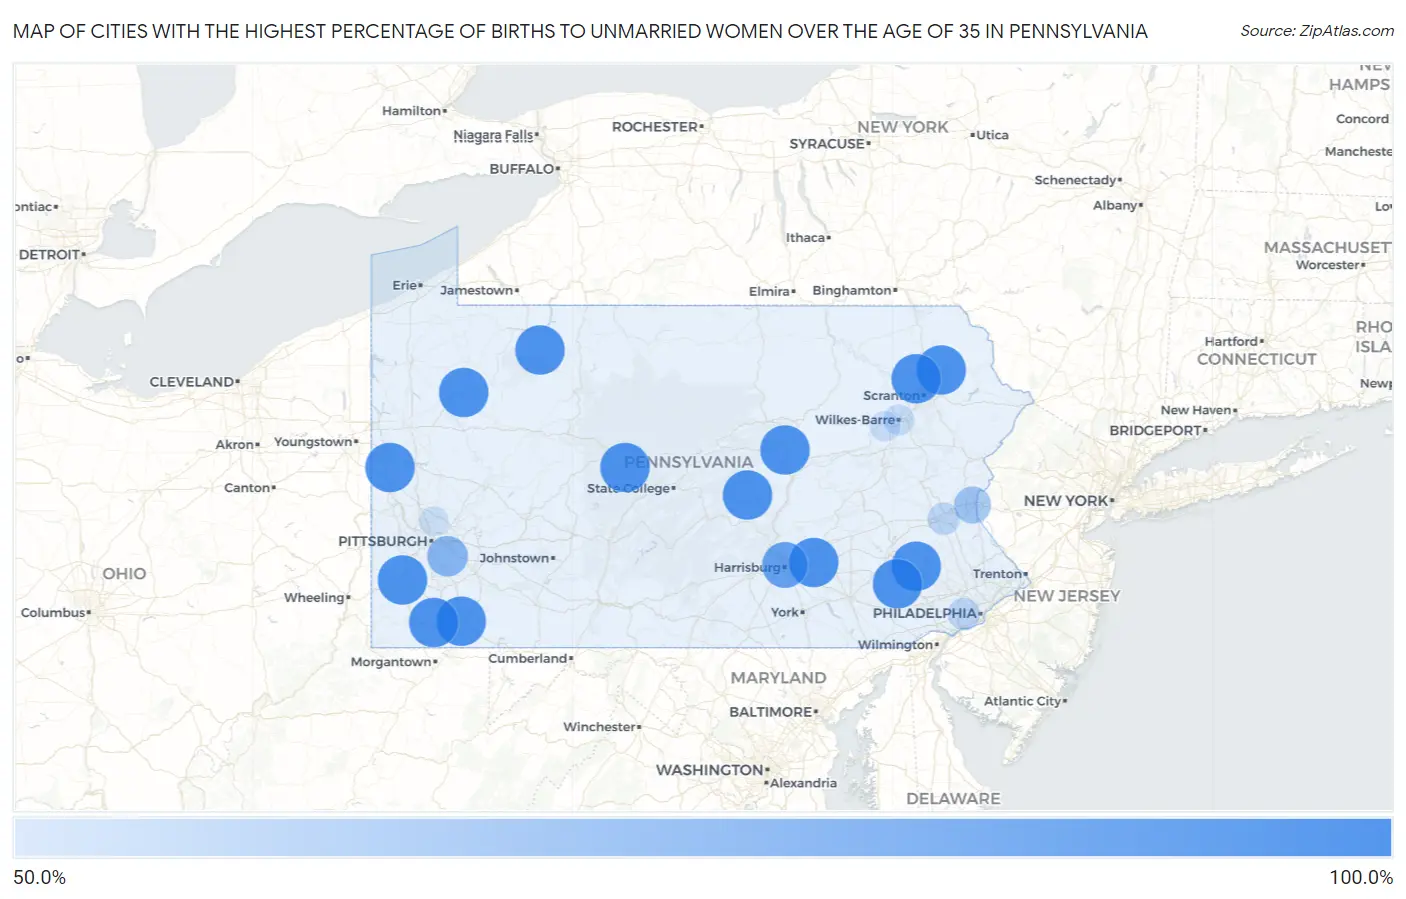
Map of Cities with the Highest Percentage of Births to Unmarried Women over the Age of 35 in Pennsylvania
0.0%
100.0%
Cities with the Highest Percentage of Births to Unmarried Women over the Age of 35 in Pennsylvania
| City | % Unmarried | vs State | vs National | |
| 1. | Washington | 100.0% | 19.9%(+80.1)#1 | 20.1%(+79.9)#111 |
| 2. | Uniontown | 100.0% | 19.9%(+80.1)#2 | 20.1%(+79.9)#188 |
| 3. | Oil City | 100.0% | 19.9%(+80.1)#3 | 20.1%(+79.9)#199 |
| 4. | East Stroudsburg Borough | 100.0% | 19.9%(+80.1)#4 | 20.1%(+79.9)#205 |
| 5. | Carbondale | 100.0% | 19.9%(+80.1)#5 | 20.1%(+79.9)#220 |
| 6. | Ambridge Borough | 100.0% | 19.9%(+80.1)#6 | 20.1%(+79.9)#276 |
| 7. | Tamaqua Borough | 100.0% | 19.9%(+80.1)#7 | 20.1%(+79.9)#280 |
| 8. | Plymouth Borough | 100.0% | 19.9%(+80.1)#8 | 20.1%(+79.9)#337 |
| 9. | Oxford Borough | 100.0% | 19.9%(+80.1)#9 | 20.1%(+79.9)#340 |
| 10. | Exeter Borough | 100.0% | 19.9%(+80.1)#10 | 20.1%(+79.9)#352 |
| 11. | Olyphant Borough | 100.0% | 19.9%(+80.1)#11 | 20.1%(+79.9)#364 |
| 12. | Collegeville Borough | 100.0% | 19.9%(+80.1)#12 | 20.1%(+79.9)#374 |
| 13. | Edinboro Borough | 100.0% | 19.9%(+80.1)#13 | 20.1%(+79.9)#387 |
| 14. | Littlestown Borough | 100.0% | 19.9%(+80.1)#14 | 20.1%(+79.9)#397 |
| 15. | Jessup Borough | 100.0% | 19.9%(+80.1)#15 | 20.1%(+79.9)#417 |
| 16. | Tarentum Borough | 100.0% | 19.9%(+80.1)#16 | 20.1%(+79.9)#432 |
| 17. | Forty Fort Borough | 100.0% | 19.9%(+80.1)#17 | 20.1%(+79.9)#438 |
| 18. | Amity Gardens | 100.0% | 19.9%(+80.1)#18 | 20.1%(+79.9)#439 |
| 19. | Lansford Borough | 100.0% | 19.9%(+80.1)#19 | 20.1%(+79.9)#450 |
| 20. | North East Borough | 100.0% | 19.9%(+80.1)#20 | 20.1%(+79.9)#453 |
| 21. | Northern Cambria Borough | 100.0% | 19.9%(+80.1)#21 | 20.1%(+79.9)#490 |
| 22. | Churchill Borough | 100.0% | 19.9%(+80.1)#22 | 20.1%(+79.9)#531 |
| 23. | Summit Hill Borough | 100.0% | 19.9%(+80.1)#23 | 20.1%(+79.9)#532 |
| 24. | Mountville Borough | 100.0% | 19.9%(+80.1)#24 | 20.1%(+79.9)#545 |
| 25. | Portage Borough | 100.0% | 19.9%(+80.1)#25 | 20.1%(+79.9)#606 |
| 26. | Marysville Borough | 100.0% | 19.9%(+80.1)#26 | 20.1%(+79.9)#607 |
| 27. | Dillsburg Borough | 100.0% | 19.9%(+80.1)#27 | 20.1%(+79.9)#609 |
| 28. | Ashley Borough | 100.0% | 19.9%(+80.1)#28 | 20.1%(+79.9)#612 |
| 29. | Curwensville Borough | 100.0% | 19.9%(+80.1)#29 | 20.1%(+79.9)#624 |
| 30. | Millersburg Borough | 100.0% | 19.9%(+80.1)#30 | 20.1%(+79.9)#626 |
| 31. | Weatherly Borough | 100.0% | 19.9%(+80.1)#31 | 20.1%(+79.9)#628 |
| 32. | Avoca Borough | 100.0% | 19.9%(+80.1)#32 | 20.1%(+79.9)#633 |
| 33. | Ashland Borough | 100.0% | 19.9%(+80.1)#33 | 20.1%(+79.9)#639 |
| 34. | Fairdale | 100.0% | 19.9%(+80.1)#34 | 20.1%(+79.9)#659 |
| 35. | Dublin Borough | 100.0% | 19.9%(+80.1)#35 | 20.1%(+79.9)#668 |
| 36. | Everett Borough | 100.0% | 19.9%(+80.1)#36 | 20.1%(+79.9)#680 |
| 37. | Mercersburg Borough | 100.0% | 19.9%(+80.1)#37 | 20.1%(+79.9)#695 |
| 38. | Rankin Borough | 100.0% | 19.9%(+80.1)#38 | 20.1%(+79.9)#747 |
| 39. | Fairchance Borough | 100.0% | 19.9%(+80.1)#39 | 20.1%(+79.9)#791 |
| 40. | Smethport Borough | 100.0% | 19.9%(+80.1)#40 | 20.1%(+79.9)#816 |
| 41. | Nottingham | 100.0% | 19.9%(+80.1)#41 | 20.1%(+79.9)#838 |
| 42. | Oakdale Borough | 100.0% | 19.9%(+80.1)#42 | 20.1%(+79.9)#839 |
| 43. | Morgantown | 100.0% | 19.9%(+80.1)#43 | 20.1%(+79.9)#853 |
| 44. | Duncannon Borough | 100.0% | 19.9%(+80.1)#44 | 20.1%(+79.9)#863 |
| 45. | New Beaver Borough | 100.0% | 19.9%(+80.1)#45 | 20.1%(+79.9)#880 |
| 46. | Palmdale | 100.0% | 19.9%(+80.1)#46 | 20.1%(+79.9)#883 |
| 47. | Westfield Borough | 100.0% | 19.9%(+80.1)#47 | 20.1%(+79.9)#896 |
| 48. | Houston Borough | 100.0% | 19.9%(+80.1)#48 | 20.1%(+79.9)#909 |
| 49. | West Easton Borough | 100.0% | 19.9%(+80.1)#49 | 20.1%(+79.9)#925 |
| 50. | Glenburn | 100.0% | 19.9%(+80.1)#50 | 20.1%(+79.9)#934 |
| 51. | East Brady Borough | 100.0% | 19.9%(+80.1)#51 | 20.1%(+79.9)#952 |
| 52. | Central City Borough | 100.0% | 19.9%(+80.1)#52 | 20.1%(+79.9)#962 |
| 53. | Saegertown Borough | 100.0% | 19.9%(+80.1)#53 | 20.1%(+79.9)#987 |
| 54. | Dunbar Borough | 100.0% | 19.9%(+80.1)#54 | 20.1%(+79.9)#988 |
| 55. | Harrisville Borough | 100.0% | 19.9%(+80.1)#55 | 20.1%(+79.9)#1,033 |
| 56. | New Columbia | 100.0% | 19.9%(+80.1)#56 | 20.1%(+79.9)#1,036 |
| 57. | Abbottstown Borough | 100.0% | 19.9%(+80.1)#57 | 20.1%(+79.9)#1,038 |
| 58. | Galeton Borough | 100.0% | 19.9%(+80.1)#58 | 20.1%(+79.9)#1,042 |
| 59. | West Pittsburg | 100.0% | 19.9%(+80.1)#59 | 20.1%(+79.9)#1,043 |
| 60. | Sheffield | 100.0% | 19.9%(+80.1)#60 | 20.1%(+79.9)#1,079 |
| 61. | Beaver Springs | 100.0% | 19.9%(+80.1)#61 | 20.1%(+79.9)#1,097 |
| 62. | New Florence Borough | 100.0% | 19.9%(+80.1)#62 | 20.1%(+79.9)#1,108 |
| 63. | Lanesboro Borough | 100.0% | 19.9%(+80.1)#63 | 20.1%(+79.9)#1,151 |
| 64. | West Decatur | 100.0% | 19.9%(+80.1)#64 | 20.1%(+79.9)#1,156 |
| 65. | Modena Borough | 100.0% | 19.9%(+80.1)#65 | 20.1%(+79.9)#1,179 |
| 66. | Auburn Borough | 100.0% | 19.9%(+80.1)#66 | 20.1%(+79.9)#1,186 |
| 67. | Green Lane Borough | 100.0% | 19.9%(+80.1)#67 | 20.1%(+79.9)#1,279 |
| 68. | Bear Creek Village Borough | 100.0% | 19.9%(+80.1)#68 | 20.1%(+79.9)#1,281 |
| 69. | Ford Cliff Borough | 100.0% | 19.9%(+80.1)#69 | 20.1%(+79.9)#1,286 |
| 70. | Orrstown Borough | 100.0% | 19.9%(+80.1)#70 | 20.1%(+79.9)#1,287 |
| 71. | Kistler Borough | 100.0% | 19.9%(+80.1)#71 | 20.1%(+79.9)#1,321 |
| 72. | Addison Borough | 100.0% | 19.9%(+80.1)#72 | 20.1%(+79.9)#1,333 |
| 73. | Spring Drive Mobile Home Park | 100.0% | 19.9%(+80.1)#73 | 20.1%(+79.9)#1,389 |
| 74. | Dudley Borough | 100.0% | 19.9%(+80.1)#74 | 20.1%(+79.9)#1,393 |
| 75. | Darby Borough | 93.9% | 19.9%(+74.0)#75 | 20.1%(+73.8)#1,460 |
| 76. | Harrisburg | 91.7% | 19.9%(+71.8)#76 | 20.1%(+71.6)#1,471 |
| 77. | West Mifflin Borough | 84.2% | 19.9%(+64.3)#77 | 20.1%(+64.1)#1,520 |
| 78. | Mckeesport | 80.4% | 19.9%(+60.5)#78 | 20.1%(+60.3)#1,554 |
| 79. | Greencastle Borough | 78.0% | 19.9%(+58.1)#79 | 20.1%(+57.9)#1,577 |
| 80. | Blakely Borough | 76.7% | 19.9%(+56.8)#80 | 20.1%(+56.6)#1,593 |
| 81. | Stroudsburg Borough | 75.9% | 19.9%(+56.0)#81 | 20.1%(+55.8)#1,605 |
| 82. | Highspire Borough | 74.1% | 19.9%(+54.2)#82 | 20.1%(+54.0)#1,631 |
| 83. | Easton | 72.5% | 19.9%(+52.6)#83 | 20.1%(+52.4)#1,647 |
| 84. | Brentwood Borough | 71.6% | 19.9%(+51.7)#84 | 20.1%(+51.5)#1,658 |
| 85. | New Albany Borough | 69.2% | 19.9%(+49.3)#85 | 20.1%(+49.1)#1,691 |
| 86. | Ephrata Borough | 66.7% | 19.9%(+46.8)#86 | 20.1%(+46.6)#1,721 |
| 87. | Ellwood City Borough | 66.7% | 19.9%(+46.8)#87 | 20.1%(+46.6)#1,725 |
| 88. | Emsworth Borough | 66.7% | 19.9%(+46.8)#88 | 20.1%(+46.6)#1,731 |
| 89. | Lansdale Borough | 63.9% | 19.9%(+44.0)#89 | 20.1%(+43.8)#1,795 |
| 90. | Allentown | 62.6% | 19.9%(+42.7)#90 | 20.1%(+42.5)#1,820 |
| 91. | Drexel Hill | 62.2% | 19.9%(+42.3)#91 | 20.1%(+42.1)#1,837 |
| 92. | North Apollo Borough | 61.5% | 19.9%(+41.6)#92 | 20.1%(+41.4)#1,860 |
| 93. | Wilkes Barre | 60.0% | 19.9%(+40.1)#93 | 20.1%(+39.9)#1,880 |
| 94. | New Holland Borough | 60.0% | 19.9%(+40.1)#94 | 20.1%(+39.9)#1,886 |
| 95. | Lewis Run Borough | 60.0% | 19.9%(+40.1)#95 | 20.1%(+39.9)#1,891 |
| 96. | Pottstown Borough | 58.8% | 19.9%(+38.9)#96 | 20.1%(+38.7)#1,912 |
| 97. | Nanticoke | 58.8% | 19.9%(+38.9)#97 | 20.1%(+38.7)#1,913 |
| 98. | Fleetwood Borough | 58.3% | 19.9%(+38.4)#98 | 20.1%(+38.2)#1,922 |
| 99. | Allison Park | 58.1% | 19.9%(+38.2)#99 | 20.1%(+38.0)#1,928 |
| 100. | Folcroft Borough | 57.8% | 19.9%(+37.9)#100 | 20.1%(+37.7)#1,936 |
Common Questions
What are the Top 10 Cities with the Highest Percentage of Births to Unmarried Women over the Age of 35 in Pennsylvania?
Top 10 Cities with the Highest Percentage of Births to Unmarried Women over the Age of 35 in Pennsylvania are:
#1
100.0%
#2
100.0%
#3
100.0%
#4
100.0%
#5
100.0%
#6
100.0%
#7
100.0%
#8
100.0%
#9
100.0%
#10
100.0%
What city has the Highest Percentage of Births to Unmarried Women over the Age of 35 in Pennsylvania?
Washington has the Highest Percentage of Births to Unmarried Women over the Age of 35 in Pennsylvania with 100.0%.
What is the Percentage of Births to Unmarried Women over the Age of 35 in the State of Pennsylvania?
Percentage of Births to Unmarried Women over the Age of 35 in Pennsylvania is 19.9%.
What is the Percentage of Births to Unmarried Women over the Age of 35 in the United States?
Percentage of Births to Unmarried Women over the Age of 35 in the United States is 20.1%.