Cities with the Highest Percentage of Births to Unmarried Women over the Age of 35 in Nebraska

RELATED REPORTS & OPTIONS

Highest Illegitimacy | Women 35+
Population
Families and Households
Female Fertility
Female Fertility (Unmarried)
Race (Community Size)
Race (Percentage)
Ancestry (Community Size)
AfghanAfricanAlaska NativeAlaskan AthabascanAlbanianAleutAlsatianAmericanApacheArabArapahoArgentineanArmenianAssyrian / Chaldean / SyriacAustralianAustrianBahamianBangladeshiBarbadianBasqueBelgianBelizeanBermudanBhutaneseBlackfeetBolivianBrazilianBritishBritish West IndianBulgarianBurmeseCajunCambodianCanadianCape VerdeanCarpatho RusynCelticCentral AmericanCentral American IndianCherokeeCheyenneChickasawChileanChineseChippewaChoctawColombianColvilleComancheCosta RicanCreeCreekCroatianCrowCubanCypriotCzechCzechoslovakianDanishDelawareDominicanDutchDutch West IndianEastern EuropeanEcuadorianEgyptianEnglishEstonianEthiopianEuropeanFijianFilipinoFinnishFrenchFrench American IndianFrench CanadianGermanGerman RussianGhanaianGreekGuamanian / ChamorroGuatemalanGuyaneseHaitianHmongHonduranHopiHoumaHungarianIcelanderIndian (Asian)IndonesianInupiatIranianIraqiIrishIroquoisIsraeliItalianJamaicanJapaneseJordanianKenyanKiowaKoreanLaotianLatvianLebaneseLiberianLithuanianLumbeeLuxembourgerMacedonianMalaysianMalteseMarshalleseMenomineeMexicanMexican American IndianMongolianMoroccanNative HawaiianNavajoNepaleseNew ZealanderNicaraguanNigerianNorthern EuropeanNorwegianOkinawanOsageOttawaPaiutePakistaniPalestinianPanamanianParaguayanPennsylvania GermanPeruvianPimaPolishPortuguesePotawatomiPuebloPuerto RicanPuget Sound SalishRomanianRussianSalvadoranSamoanScandinavianScotch-IrishScottishSeminoleSenegaleseSerbianShoshoneSierra LeoneanSiouxSlavicSlovakSloveneSomaliSouth AfricanSouth AmericanSouth American IndianSoviet UnionSpaniardSpanishSpanish AmericanSpanish American IndianSri LankanSubsaharan AfricanSudaneseSwedishSwissSyrianTaiwaneseThaiTlingit-HaidaTohono O'OdhamTonganTrinidadian and TobagonianTsimshianTurkishU.S. Virgin IslanderUgandanUkrainianUruguayanUteVenezuelanVietnameseWelshWest IndianYakamaYaquiYugoslavianYumanYup'ikZimbabwean
Ancestry (Percentage)
AfghanAfricanAlaska NativeAlaskan AthabascanAlbanianAleutAlsatianAmericanApacheArabArapahoArgentineanArmenianAssyrian / Chaldean / SyriacAustralianAustrianBahamianBangladeshiBarbadianBasqueBelgianBelizeanBermudanBhutaneseBlackfeetBolivianBrazilianBritishBritish West IndianBulgarianBurmeseCajunCambodianCanadianCape VerdeanCarpatho RusynCelticCentral AmericanCentral American IndianCherokeeCheyenneChickasawChileanChineseChippewaChoctawColombianColvilleComancheCosta RicanCreeCreekCroatianCrowCubanCypriotCzechCzechoslovakianDanishDelawareDominicanDutchDutch West IndianEastern EuropeanEcuadorianEgyptianEnglishEstonianEthiopianEuropeanFijianFilipinoFinnishFrenchFrench American IndianFrench CanadianGermanGerman RussianGhanaianGreekGuamanian / ChamorroGuatemalanGuyaneseHaitianHmongHonduranHopiHoumaHungarianIcelanderIndian (Asian)IndonesianInupiatIranianIraqiIrishIroquoisIsraeliItalianJamaicanJapaneseJordanianKenyanKiowaKoreanLaotianLatvianLebaneseLiberianLithuanianLumbeeLuxembourgerMacedonianMalaysianMalteseMarshalleseMenomineeMexicanMexican American IndianMongolianMoroccanNative HawaiianNavajoNepaleseNew ZealanderNicaraguanNigerianNorthern EuropeanNorwegianOkinawanOsageOttawaPaiutePakistaniPalestinianPanamanianParaguayanPennsylvania GermanPeruvianPimaPolishPortuguesePotawatomiPuebloPuerto RicanPuget Sound SalishRomanianRussianSalvadoranSamoanScandinavianScotch-IrishScottishSeminoleSenegaleseSerbianShoshoneSierra LeoneanSiouxSlavicSlovakSloveneSomaliSouth AfricanSouth AmericanSouth American IndianSoviet UnionSpaniardSpanishSpanish AmericanSpanish American IndianSri LankanSubsaharan AfricanSudaneseSwedishSwissSyrianTaiwaneseThaiTlingit-HaidaTohono O'OdhamTonganTrinidadian and TobagonianTsimshianTurkishU.S. Virgin IslanderUgandanUkrainianUruguayanUteVenezuelanVietnameseWelshWest IndianYakamaYaquiYugoslavianYumanYup'ikZimbabwean
Immigrant Origin (Total)
AfghanistanAfricaAlbaniaArgentinaArmeniaAsiaAustraliaAustriaAzoresBahamasBangladeshBarbadosBelarusBelgiumBelizeBoliviaBosnia and HerzegovinaBrazilBulgariaBurma / MyanmarCabo VerdeCambodiaCameroonCanadaCaribbeanCentral AmericaChileChinaColombiaCongoCosta RicaCroatiaCubaCzechoslovakiaDenmarkDominicaDominican RepublicEastern AfricaEastern AsiaEastern EuropeEcuadorEgyptEl SalvadorEnglandEritreaEthiopiaEuropeFijiFranceGermanyGhanaGreeceGrenadaGuatemalaGuyanaHaitiHondurasHong KongHungaryIndiaIndonesiaIranIraqIrelandIsraelItalyJamaicaJapanJordanKazakhstanKenyaKoreaKuwaitLaosLatin AmericaLatviaLebanonLiberiaLithuaniaMalaysiaMexicoMicronesiaMiddle AfricaMoldovaMoroccoNepalNetherlandsNicaraguaNigeriaNorth MacedoniaNorthern AfricaNorthern EuropeNorwayOceaniaPakistanPanamaPeruPhilippinesPolandPortugalRomaniaRussiaSaudi ArabiaScotlandSenegalSerbiaSierra LeoneSingaporeSomaliaSouth AfricaSouth AmericaSouth Central AsiaSouth Eastern AsiaSouthern EuropeSpainSri LankaSt. Vincent and the GrenadinesSudanSwedenSwitzerlandSyriaTaiwanThailandTrinidad and TobagoTurkeyUgandaUkraineUruguayUzbekistanVenezuelaVietnamWest IndiesWestern AfricaWestern AsiaWestern EuropeYemenZaireZimbabwe
Immigrant Origin (Percentage)
AfghanistanAfricaAlbaniaArgentinaArmeniaAsiaAustraliaAustriaAzoresBahamasBangladeshBarbadosBelarusBelgiumBelizeBoliviaBosnia and HerzegovinaBrazilBulgariaBurma / MyanmarCabo VerdeCambodiaCameroonCanadaCaribbeanCentral AmericaChileChinaColombiaCongoCosta RicaCroatiaCubaCzechoslovakiaDenmarkDominicaDominican RepublicEastern AfricaEastern AsiaEastern EuropeEcuadorEgyptEl SalvadorEnglandEritreaEthiopiaEuropeFijiFranceGermanyGhanaGreeceGrenadaGuatemalaGuyanaHaitiHondurasHong KongHungaryIndiaIndonesiaIranIraqIrelandIsraelItalyJamaicaJapanJordanKazakhstanKenyaKoreaKuwaitLaosLatin AmericaLatviaLebanonLiberiaLithuaniaMalaysiaMexicoMicronesiaMiddle AfricaMoldovaMoroccoNepalNetherlandsNicaraguaNigeriaNorth MacedoniaNorthern AfricaNorthern EuropeNorwayOceaniaPakistanPanamaPeruPhilippinesPolandPortugalRomaniaRussiaSaudi ArabiaScotlandSenegalSerbiaSierra LeoneSingaporeSomaliaSouth AfricaSouth AmericaSouth Central AsiaSouth Eastern AsiaSouthern EuropeSpainSri LankaSt. Vincent and the GrenadinesSudanSwedenSwitzerlandSyriaTaiwanThailandTrinidad and TobagoTurkeyUgandaUkraineUruguayUzbekistanVenezuelaVietnamWest IndiesWestern AfricaWestern AsiaWestern EuropeYemenZaireZimbabwe
Income
Income (Families)
Income (Households)
Poverty
Poverty (Families)
Unemployment
Employment Occupations
Employment Industries
Employer Class
Commute Time
Commute Means
School Enrollment
Education by Degree Field
Occupancy
Finances
Physical Characteristics
Nebraska
Compare Cities
Comparison Subject

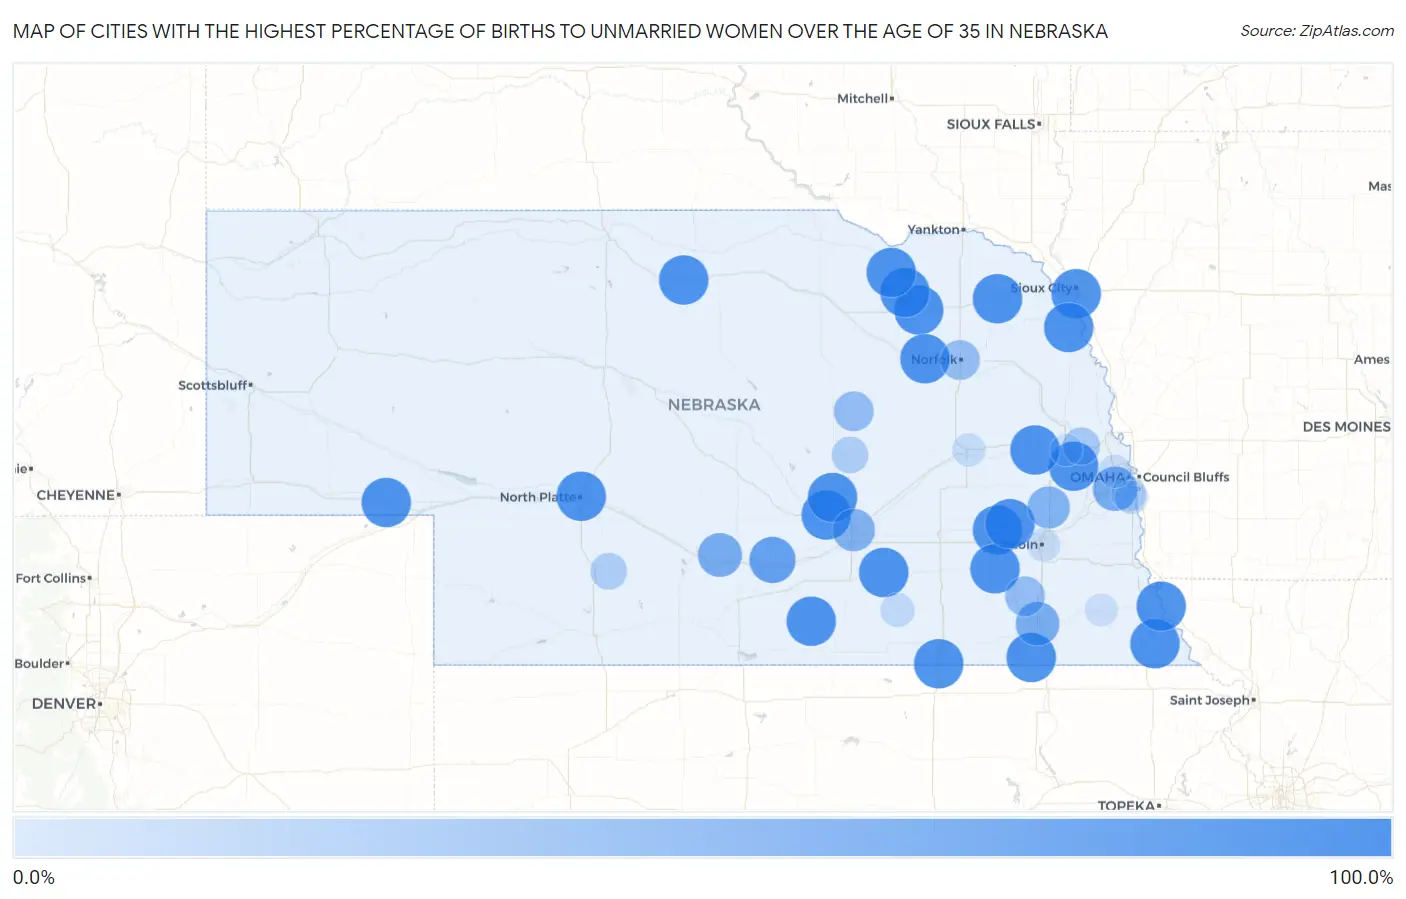
Map of Cities with the Highest Percentage of Births to Unmarried Women over the Age of 35 in Nebraska

0.0%
100.0%
Cities with the Highest Percentage of Births to Unmarried Women over the Age of 35 in Nebraska Map

Cities with the Highest Percentage of Births to Unmarried Women over the Age of 35 in Nebraska

City % Unmarried vs State vs National
1.North Platte100.0%22.8%(+77.2)#120.1%(+79.9)#28
2.South Sioux City100.0%22.8%(+77.2)#220.1%(+79.9)#102
3.Seward100.0%22.8%(+77.2)#320.1%(+79.9)#254
4.Ainsworth100.0%22.8%(+77.2)#420.1%(+79.9)#815
5.Plainview100.0%22.8%(+77.2)#520.1%(+79.9)#875
6.Creighton100.0%22.8%(+77.2)#620.1%(+79.9)#900
7.Cairo100.0%22.8%(+77.2)#720.1%(+79.9)#949
8.Harvard100.0%22.8%(+77.2)#820.1%(+79.9)#959
9.Laurel100.0%22.8%(+77.2)#920.1%(+79.9)#991
10.Chappell100.0%22.8%(+77.2)#1020.1%(+79.9)#1,017
11.Winnebago100.0%22.8%(+77.2)#1120.1%(+79.9)#1,029
12.Verdigre100.0%22.8%(+77.2)#1220.1%(+79.9)#1,146
13.Dorchester100.0%22.8%(+77.2)#1320.1%(+79.9)#1,184
14.Campbell100.0%22.8%(+77.2)#1420.1%(+79.9)#1,303
15.Odell100.0%22.8%(+77.2)#1520.1%(+79.9)#1,322
16.Garland100.0%22.8%(+77.2)#1620.1%(+79.9)#1,342
17.Dannebrog100.0%22.8%(+77.2)#1720.1%(+79.9)#1,354
18.Verdon100.0%22.8%(+77.2)#1820.1%(+79.9)#1,357
19.Chester100.0%22.8%(+77.2)#1920.1%(+79.9)#1,367
20.Meadow Grove100.0%22.8%(+77.2)#2020.1%(+79.9)#1,385
21.Leshara100.0%22.8%(+77.2)#2120.1%(+79.9)#1,411
22.Brownville100.0%22.8%(+77.2)#2220.1%(+79.9)#1,415
23.Morse Bluff100.0%22.8%(+77.2)#2320.1%(+79.9)#1,442
24.Kearney82.9%22.8%(+60.1)#2420.1%(+62.8)#1,535
25.La Vista73.0%22.8%(+50.2)#2520.1%(+52.9)#1,640
26.Overton71.4%22.8%(+48.6)#2620.1%(+51.3)#1,665
27.Beatrice69.6%22.8%(+46.8)#2720.1%(+49.5)#1,681
28.Grand Island63.5%22.8%(+40.7)#2820.1%(+43.4)#1,803
29.Ceresco62.5%22.8%(+39.7)#2920.1%(+42.4)#1,830
30.Spalding50.0%22.8%(+27.2)#3020.1%(+29.9)#2,158
31.Clatonia50.0%22.8%(+27.2)#3120.1%(+29.9)#2,162
32.Norfolk49.3%22.8%(+26.5)#3220.1%(+29.2)#2,170
33.Arlington37.5%22.8%(+14.7)#3320.1%(+17.4)#2,534
34.Curtis33.3%22.8%(+10.5)#3420.1%(+13.2)#2,722
35.Wolbach33.3%22.8%(+10.5)#3520.1%(+13.2)#2,730
36.Bellevue25.9%22.8%(+3.10)#3620.1%(+5.80)#3,035
37.Edgar20.0%22.8%(-2.80)#3720.1%(-0.100)#3,312
38.Columbus16.9%22.8%(-5.90)#3820.1%(-3.20)#3,461
39.Offutt Afb16.7%22.8%(-6.10)#3920.1%(-3.40)#3,477
40.Lincoln16.1%22.8%(-6.70)#4020.1%(-4.00)#3,506
41.Omaha15.7%22.8%(-7.10)#4120.1%(-4.40)#3,529
42.Tecumseh14.3%22.8%(-8.50)#4220.1%(-5.80)#3,620
43.Fremont12.5%22.8%(-10.3)#4320.1%(-7.60)#3,724

Common Questions

What are the Top 10 Cities with the Highest Percentage of Births to Unmarried Women over the Age of 35 in Nebraska?
Top 10 Cities with the Highest Percentage of Births to Unmarried Women over the Age of 35 in Nebraska are:
#1
100.0%
#2
100.0%
#3
100.0%
#4
100.0%
#5
100.0%
#6
100.0%
#7
100.0%
#8
100.0%
#9
100.0%
#10
100.0%
What city has the Highest Percentage of Births to Unmarried Women over the Age of 35 in Nebraska?
North Platte has the Highest Percentage of Births to Unmarried Women over the Age of 35 in Nebraska with 100.0%.
What is the Percentage of Births to Unmarried Women over the Age of 35 in the State of Nebraska?
Percentage of Births to Unmarried Women over the Age of 35 in Nebraska is 22.8%.
What is the Percentage of Births to Unmarried Women over the Age of 35 in the United States?
Percentage of Births to Unmarried Women over the Age of 35 in the United States is 20.1%.