Cities with the Highest Percentage of Births to Unmarried Women over the Age of 35 in Maryland
RELATED REPORTS & OPTIONS
Highest Illegitimacy | Women 35+
Maryland
Compare Cities
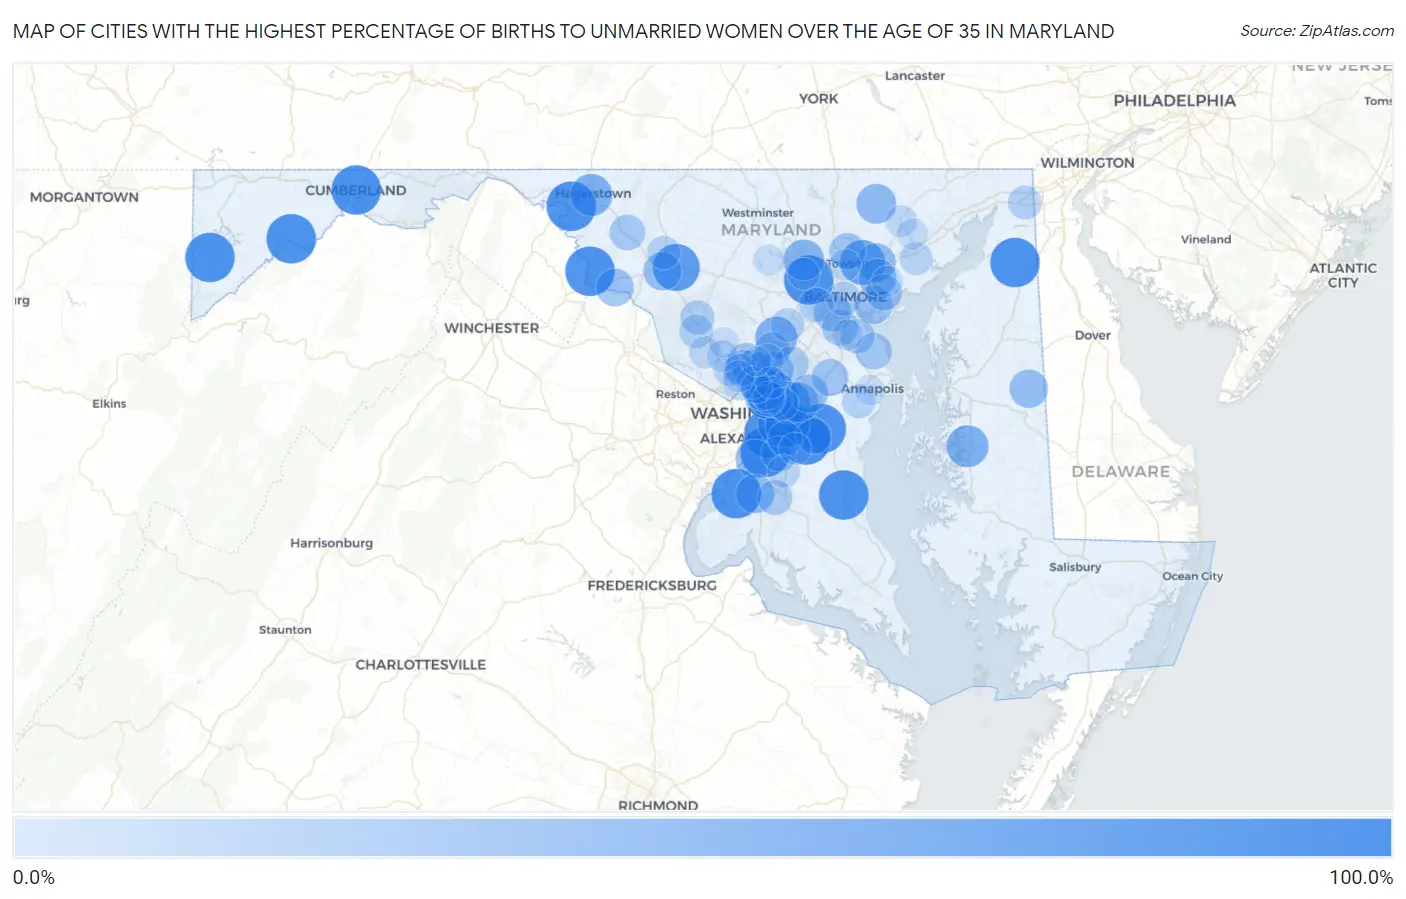
Map of Cities with the Highest Percentage of Births to Unmarried Women over the Age of 35 in Maryland
0.0%
100.0%
Cities with the Highest Percentage of Births to Unmarried Women over the Age of 35 in Maryland
| City | % Unmarried | vs State | vs National | |
| 1. | Milford Mill | 100.0% | 19.5%(+80.5)#1 | 20.1%(+79.9)#10 |
| 2. | Cumberland | 100.0% | 19.5%(+80.5)#2 | 20.1%(+79.9)#47 |
| 3. | Friendly | 100.0% | 19.5%(+80.5)#3 | 20.1%(+79.9)#166 |
| 4. | Bryans Road | 100.0% | 19.5%(+80.5)#4 | 20.1%(+79.9)#227 |
| 5. | Marlow Heights | 100.0% | 19.5%(+80.5)#5 | 20.1%(+79.9)#304 |
| 6. | District Heights | 100.0% | 19.5%(+80.5)#6 | 20.1%(+79.9)#326 |
| 7. | Marlboro Meadows | 100.0% | 19.5%(+80.5)#7 | 20.1%(+79.9)#472 |
| 8. | Huntingtown | 100.0% | 19.5%(+80.5)#8 | 20.1%(+79.9)#565 |
| 9. | Queensland | 100.0% | 19.5%(+80.5)#9 | 20.1%(+79.9)#708 |
| 10. | Oakland | 100.0% | 19.5%(+80.5)#10 | 20.1%(+79.9)#715 |
| 11. | Westernport | 100.0% | 19.5%(+80.5)#11 | 20.1%(+79.9)#716 |
| 12. | Williamsport | 100.0% | 19.5%(+80.5)#12 | 20.1%(+79.9)#727 |
| 13. | Edmonston | 100.0% | 19.5%(+80.5)#13 | 20.1%(+79.9)#767 |
| 14. | Cecilton | 100.0% | 19.5%(+80.5)#14 | 20.1%(+79.9)#1,024 |
| 15. | Maryland Park | 100.0% | 19.5%(+80.5)#15 | 20.1%(+79.9)#1,125 |
| 16. | Dargan | 100.0% | 19.5%(+80.5)#16 | 20.1%(+79.9)#1,391 |
| 17. | Bartonsville | 88.2% | 19.5%(+68.7)#17 | 20.1%(+68.1)#1,493 |
| 18. | Burnt Mills | 84.3% | 19.5%(+64.8)#18 | 20.1%(+64.2)#1,519 |
| 19. | Carney | 77.8% | 19.5%(+58.3)#19 | 20.1%(+57.7)#1,580 |
| 20. | Forestville | 76.5% | 19.5%(+57.0)#20 | 20.1%(+56.4)#1,596 |
| 21. | Glenarden | 66.7% | 19.5%(+47.2)#21 | 20.1%(+46.6)#1,726 |
| 22. | Hagerstown | 64.5% | 19.5%(+45.0)#22 | 20.1%(+44.4)#1,774 |
| 23. | Fulton | 64.1% | 19.5%(+44.6)#23 | 20.1%(+44.0)#1,791 |
| 24. | Easton | 63.8% | 19.5%(+44.3)#24 | 20.1%(+43.7)#1,797 |
| 25. | Langley Park | 60.0% | 19.5%(+40.5)#25 | 20.1%(+39.9)#1,882 |
| 26. | Owings Mills | 58.5% | 19.5%(+39.0)#26 | 20.1%(+38.4)#1,918 |
| 27. | Jarrettsville | 53.3% | 19.5%(+33.8)#27 | 20.1%(+33.2)#2,032 |
| 28. | Mitchellville | 52.8% | 19.5%(+33.3)#28 | 20.1%(+32.7)#2,045 |
| 29. | Kemp Mill | 50.7% | 19.5%(+31.2)#29 | 20.1%(+30.6)#2,099 |
| 30. | Mount Rainier | 50.0% | 19.5%(+30.5)#30 | 20.1%(+29.9)#2,123 |
| 31. | Perry Hall | 48.9% | 19.5%(+29.4)#31 | 20.1%(+28.8)#2,177 |
| 32. | Fort Washington | 48.6% | 19.5%(+29.1)#32 | 20.1%(+28.5)#2,183 |
| 33. | Wildewood | 48.5% | 19.5%(+29.0)#33 | 20.1%(+28.4)#2,187 |
| 34. | Bensville | 48.0% | 19.5%(+28.5)#34 | 20.1%(+27.9)#2,199 |
| 35. | Greensboro | 47.5% | 19.5%(+28.0)#35 | 20.1%(+27.4)#2,215 |
| 36. | Ballenger Creek | 47.1% | 19.5%(+27.6)#36 | 20.1%(+27.0)#2,222 |
| 37. | Fairwood | 46.5% | 19.5%(+27.0)#37 | 20.1%(+26.4)#2,240 |
| 38. | Dundalk | 44.9% | 19.5%(+25.4)#38 | 20.1%(+24.8)#2,284 |
| 39. | Adelphi | 44.2% | 19.5%(+24.7)#39 | 20.1%(+24.1)#2,308 |
| 40. | Lansdowne | 44.0% | 19.5%(+24.5)#40 | 20.1%(+23.9)#2,316 |
| 41. | Rossville | 43.6% | 19.5%(+24.1)#41 | 20.1%(+23.5)#2,329 |
| 42. | Brunswick | 43.6% | 19.5%(+24.1)#42 | 20.1%(+23.5)#2,330 |
| 43. | Bladensburg | 42.5% | 19.5%(+23.0)#43 | 20.1%(+22.4)#2,364 |
| 44. | Brentwood | 41.2% | 19.5%(+21.7)#44 | 20.1%(+21.1)#2,400 |
| 45. | Crofton | 40.0% | 19.5%(+20.5)#45 | 20.1%(+19.9)#2,426 |
| 46. | Glenmont | 39.7% | 19.5%(+20.2)#46 | 20.1%(+19.6)#2,458 |
| 47. | Beltsville | 39.1% | 19.5%(+19.6)#47 | 20.1%(+19.0)#2,470 |
| 48. | Timonium | 38.4% | 19.5%(+18.9)#48 | 20.1%(+18.3)#2,490 |
| 49. | Chillum | 38.0% | 19.5%(+18.5)#49 | 20.1%(+17.9)#2,508 |
| 50. | Lake Shore | 38.0% | 19.5%(+18.5)#50 | 20.1%(+17.9)#2,510 |
| 51. | Woodlawn Cdp Baltimore County | 37.5% | 19.5%(+18.0)#51 | 20.1%(+17.4)#2,522 |
| 52. | Essex | 37.5% | 19.5%(+18.0)#52 | 20.1%(+17.4)#2,523 |
| 53. | Ferndale | 37.0% | 19.5%(+17.5)#53 | 20.1%(+16.9)#2,554 |
| 54. | Burtonsville | 34.9% | 19.5%(+15.4)#54 | 20.1%(+14.8)#2,631 |
| 55. | Abingdon | 34.8% | 19.5%(+15.3)#55 | 20.1%(+14.7)#2,635 |
| 56. | Myersville | 34.4% | 19.5%(+14.9)#56 | 20.1%(+14.3)#2,649 |
| 57. | Upper Marlboro | 33.3% | 19.5%(+13.8)#57 | 20.1%(+13.2)#2,723 |
| 58. | Wheaton | 33.2% | 19.5%(+13.7)#58 | 20.1%(+13.1)#2,731 |
| 59. | Waldorf | 31.5% | 19.5%(+12.0)#59 | 20.1%(+11.4)#2,785 |
| 60. | Clinton | 31.5% | 19.5%(+12.0)#60 | 20.1%(+11.4)#2,786 |
| 61. | Pasadena | 31.5% | 19.5%(+12.0)#61 | 20.1%(+11.4)#2,787 |
| 62. | South Laurel | 30.4% | 19.5%(+10.9)#62 | 20.1%(+10.3)#2,825 |
| 63. | Hyattsville | 30.2% | 19.5%(+10.7)#63 | 20.1%(+10.1)#2,835 |
| 64. | Andrews Afb | 29.2% | 19.5%(+9.70)#64 | 20.1%(+9.10)#2,885 |
| 65. | Catonsville | 28.9% | 19.5%(+9.40)#65 | 20.1%(+8.80)#2,890 |
| 66. | Baltimore | 28.6% | 19.5%(+9.10)#66 | 20.1%(+8.50)#2,900 |
| 67. | Clarksburg | 28.3% | 19.5%(+8.80)#67 | 20.1%(+8.20)#2,923 |
| 68. | Elkton | 26.7% | 19.5%(+7.20)#68 | 20.1%(+6.60)#3,002 |
| 69. | Edgewater | 25.8% | 19.5%(+6.30)#69 | 20.1%(+5.70)#3,047 |
| 70. | Germantown | 25.3% | 19.5%(+5.80)#70 | 20.1%(+5.20)#3,063 |
| 71. | Woodlawn Cdp Prince George S County | 25.0% | 19.5%(+5.50)#71 | 20.1%(+4.90)#3,076 |
| 72. | Columbia | 24.9% | 19.5%(+5.40)#72 | 20.1%(+4.80)#3,086 |
| 73. | Frederick | 24.6% | 19.5%(+5.10)#73 | 20.1%(+4.50)#3,095 |
| 74. | Chevy Chase | 23.5% | 19.5%(+4.00)#74 | 20.1%(+3.40)#3,142 |
| 75. | White Oak | 23.2% | 19.5%(+3.70)#75 | 20.1%(+3.10)#3,158 |
| 76. | Edgewood | 22.4% | 19.5%(+2.90)#76 | 20.1%(+2.30)#3,185 |
| 77. | Brandywine | 20.8% | 19.5%(+1.30)#77 | 20.1%(+0.700)#3,269 |
| 78. | North Bethesda | 20.7% | 19.5%(+1.20)#78 | 20.1%(+0.600)#3,272 |
| 79. | North Kensington | 20.6% | 19.5%(+1.10)#79 | 20.1%(+0.500)#3,281 |
| 80. | Silver Spring | 20.5% | 19.5%(+1.000)#80 | 20.1%(+0.400)#3,283 |
| 81. | Fairland | 19.6% | 19.5%(+0.100)#81 | 20.1%(-0.500)#3,329 |
| 82. | Rosaryville | 18.5% | 19.5%(-1.00)#82 | 20.1%(-1.60)#3,379 |
| 83. | North Potomac | 18.1% | 19.5%(-1.40)#83 | 20.1%(-2.00)#3,399 |
| 84. | Landover | 17.5% | 19.5%(-2.00)#84 | 20.1%(-2.60)#3,432 |
| 85. | Randallstown | 16.9% | 19.5%(-2.60)#85 | 20.1%(-3.20)#3,460 |
| 86. | Bel Air North | 16.8% | 19.5%(-2.70)#86 | 20.1%(-3.30)#3,469 |
| 87. | Rockville | 16.7% | 19.5%(-2.80)#87 | 20.1%(-3.40)#3,473 |
| 88. | North Brentwood | 16.7% | 19.5%(-2.80)#88 | 20.1%(-3.40)#3,480 |
| 89. | College Park | 16.3% | 19.5%(-3.20)#89 | 20.1%(-3.80)#3,496 |
| 90. | South Kensington | 16.0% | 19.5%(-3.50)#90 | 20.1%(-4.10)#3,513 |
| 91. | Takoma Park | 15.7% | 19.5%(-3.80)#91 | 20.1%(-4.40)#3,532 |
| 92. | Towson | 15.5% | 19.5%(-4.00)#92 | 20.1%(-4.60)#3,537 |
| 93. | Glen Burnie | 13.9% | 19.5%(-5.60)#93 | 20.1%(-6.20)#3,644 |
| 94. | Bel Air South | 13.8% | 19.5%(-5.70)#94 | 20.1%(-6.30)#3,649 |
| 95. | Middle River | 13.6% | 19.5%(-5.90)#95 | 20.1%(-6.50)#3,663 |
| 96. | Eldersburg | 13.5% | 19.5%(-6.00)#96 | 20.1%(-6.60)#3,671 |
| 97. | Flower Hill | 12.6% | 19.5%(-6.90)#97 | 20.1%(-7.50)#3,719 |
| 98. | Annapolis | 10.8% | 19.5%(-8.70)#98 | 20.1%(-9.30)#3,805 |
| 99. | Redland | 10.0% | 19.5%(-9.50)#99 | 20.1%(-10.1)#3,842 |
| 100. | Colesville | 9.2% | 19.5%(-10.3)#100 | 20.1%(-10.9)#3,875 |
Common Questions
What are the Top 10 Cities with the Highest Percentage of Births to Unmarried Women over the Age of 35 in Maryland?
Top 10 Cities with the Highest Percentage of Births to Unmarried Women over the Age of 35 in Maryland are:
#1
100.0%
#2
100.0%
#3
100.0%
#4
100.0%
#5
100.0%
#6
100.0%
#7
100.0%
#8
100.0%
#9
100.0%
#10
100.0%
What city has the Highest Percentage of Births to Unmarried Women over the Age of 35 in Maryland?
Milford Mill has the Highest Percentage of Births to Unmarried Women over the Age of 35 in Maryland with 100.0%.
What is the Percentage of Births to Unmarried Women over the Age of 35 in the State of Maryland?
Percentage of Births to Unmarried Women over the Age of 35 in Maryland is 19.5%.
What is the Percentage of Births to Unmarried Women over the Age of 35 in the United States?
Percentage of Births to Unmarried Women over the Age of 35 in the United States is 20.1%.