Cities with the Highest Percentage of Births to Unmarried Women over the Age of 35 in New York
RELATED REPORTS & OPTIONS
Highest Illegitimacy | Women 35+
New York
Compare Cities
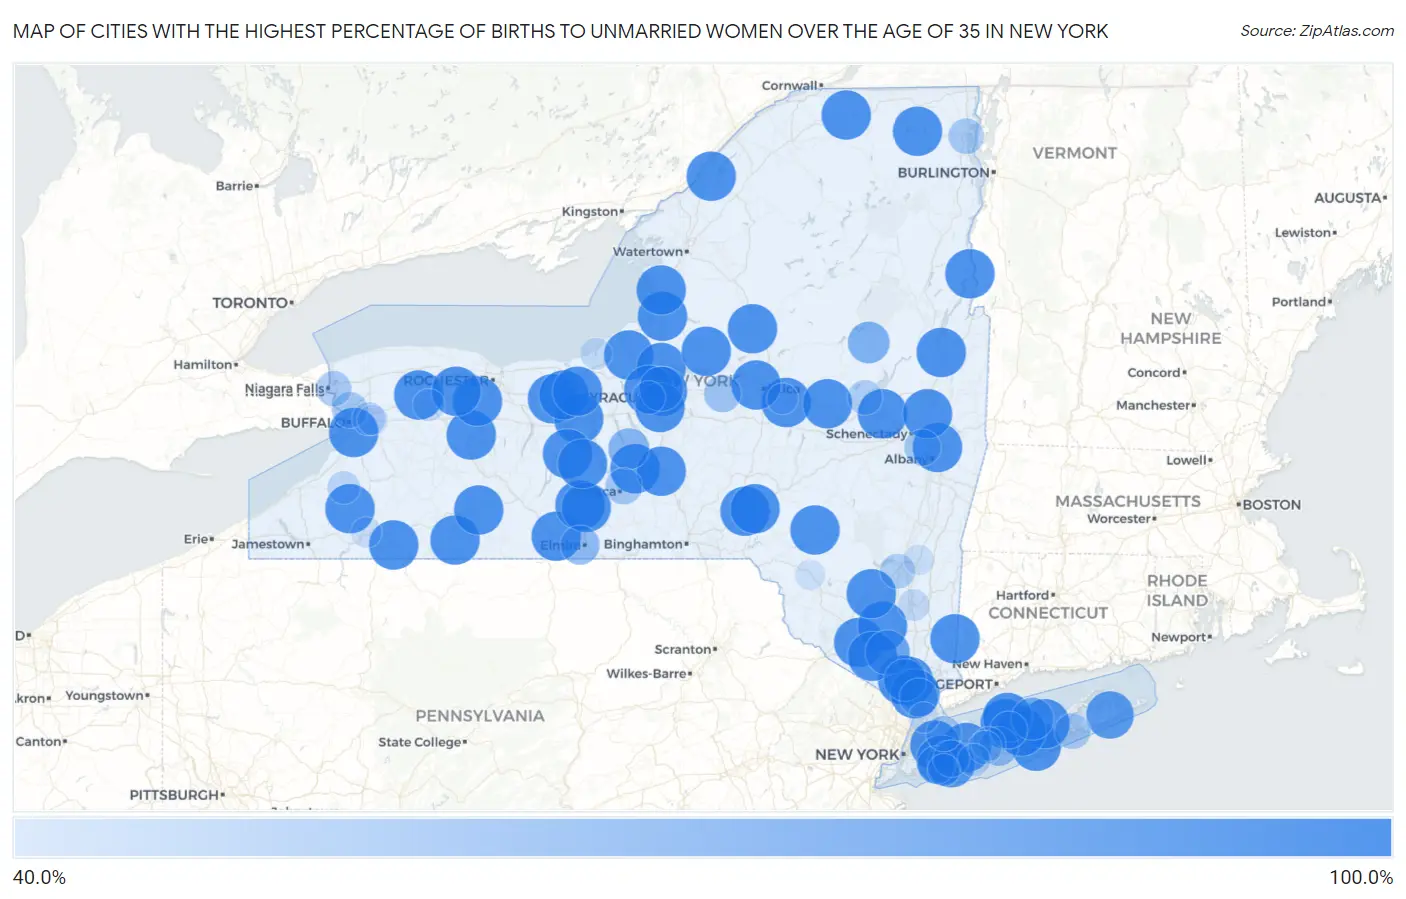
Map of Cities with the Highest Percentage of Births to Unmarried Women over the Age of 35 in New York
0.0%
100.0%
Cities with the Highest Percentage of Births to Unmarried Women over the Age of 35 in New York
| City | % Unmarried | vs State | vs National | |
| 1. | Lackawanna | 100.0% | 18.7%(+81.3)#1 | 20.1%(+79.9)#43 |
| 2. | Amsterdam | 100.0% | 18.7%(+81.3)#2 | 20.1%(+79.9)#53 |
| 3. | Mastic Beach | 100.0% | 18.7%(+81.3)#3 | 20.1%(+79.9)#71 |
| 4. | Haverstraw | 100.0% | 18.7%(+81.3)#4 | 20.1%(+79.9)#126 |
| 5. | Fulton | 100.0% | 18.7%(+81.3)#5 | 20.1%(+79.9)#143 |
| 6. | Corning | 100.0% | 18.7%(+81.3)#6 | 20.1%(+79.9)#162 |
| 7. | Watervliet | 100.0% | 18.7%(+81.3)#7 | 20.1%(+79.9)#176 |
| 8. | Newark | 100.0% | 18.7%(+81.3)#8 | 20.1%(+79.9)#212 |
| 9. | Glens Falls North | 100.0% | 18.7%(+81.3)#9 | 20.1%(+79.9)#215 |
| 10. | Stony Brook University | 100.0% | 18.7%(+81.3)#10 | 20.1%(+79.9)#222 |
| 11. | Mechanicstown | 100.0% | 18.7%(+81.3)#11 | 20.1%(+79.9)#225 |
| 12. | Geneseo | 100.0% | 18.7%(+81.3)#12 | 20.1%(+79.9)#251 |
| 13. | Ilion | 100.0% | 18.7%(+81.3)#13 | 20.1%(+79.9)#252 |
| 14. | Walden | 100.0% | 18.7%(+81.3)#14 | 20.1%(+79.9)#285 |
| 15. | Calverton | 100.0% | 18.7%(+81.3)#15 | 20.1%(+79.9)#308 |
| 16. | Old Bethpage | 100.0% | 18.7%(+81.3)#16 | 20.1%(+79.9)#336 |
| 17. | Wellsville | 100.0% | 18.7%(+81.3)#17 | 20.1%(+79.9)#391 |
| 18. | Brewerton | 100.0% | 18.7%(+81.3)#18 | 20.1%(+79.9)#402 |
| 19. | Waterloo | 100.0% | 18.7%(+81.3)#19 | 20.1%(+79.9)#411 |
| 20. | Thiells | 100.0% | 18.7%(+81.3)#20 | 20.1%(+79.9)#418 |
| 21. | Gordon Heights | 100.0% | 18.7%(+81.3)#21 | 20.1%(+79.9)#421 |
| 22. | University Gardens | 100.0% | 18.7%(+81.3)#22 | 20.1%(+79.9)#442 |
| 23. | Chester | 100.0% | 18.7%(+81.3)#23 | 20.1%(+79.9)#454 |
| 24. | Lyncourt | 100.0% | 18.7%(+81.3)#24 | 20.1%(+79.9)#464 |
| 25. | Putnam Lake | 100.0% | 18.7%(+81.3)#25 | 20.1%(+79.9)#468 |
| 26. | Sidney | 100.0% | 18.7%(+81.3)#26 | 20.1%(+79.9)#473 |
| 27. | Whitesboro | 100.0% | 18.7%(+81.3)#27 | 20.1%(+79.9)#481 |
| 28. | Lyons | 100.0% | 18.7%(+81.3)#28 | 20.1%(+79.9)#488 |
| 29. | Ticonderoga | 100.0% | 18.7%(+81.3)#29 | 20.1%(+79.9)#502 |
| 30. | Camden | 100.0% | 18.7%(+81.3)#30 | 20.1%(+79.9)#618 |
| 31. | Lakeland | 100.0% | 18.7%(+81.3)#31 | 20.1%(+79.9)#637 |
| 32. | Scottsville | 100.0% | 18.7%(+81.3)#32 | 20.1%(+79.9)#643 |
| 33. | Nedrow | 100.0% | 18.7%(+81.3)#33 | 20.1%(+79.9)#664 |
| 34. | Upper Nyack | 100.0% | 18.7%(+81.3)#34 | 20.1%(+79.9)#683 |
| 35. | Pulaski | 100.0% | 18.7%(+81.3)#35 | 20.1%(+79.9)#693 |
| 36. | Kerhonkson | 100.0% | 18.7%(+81.3)#36 | 20.1%(+79.9)#705 |
| 37. | Groton | 100.0% | 18.7%(+81.3)#37 | 20.1%(+79.9)#706 |
| 38. | Clyde | 100.0% | 18.7%(+81.3)#38 | 20.1%(+79.9)#721 |
| 39. | Boonville | 100.0% | 18.7%(+81.3)#39 | 20.1%(+79.9)#729 |
| 40. | Allegany | 100.0% | 18.7%(+81.3)#40 | 20.1%(+79.9)#741 |
| 41. | Montour Falls | 100.0% | 18.7%(+81.3)#41 | 20.1%(+79.9)#750 |
| 42. | St Johnsville | 100.0% | 18.7%(+81.3)#42 | 20.1%(+79.9)#763 |
| 43. | Oakfield | 100.0% | 18.7%(+81.3)#43 | 20.1%(+79.9)#783 |
| 44. | Bergen | 100.0% | 18.7%(+81.3)#44 | 20.1%(+79.9)#929 |
| 45. | Cattaraugus | 100.0% | 18.7%(+81.3)#45 | 20.1%(+79.9)#935 |
| 46. | Poquott | 100.0% | 18.7%(+81.3)#46 | 20.1%(+79.9)#938 |
| 47. | Unadilla | 100.0% | 18.7%(+81.3)#47 | 20.1%(+79.9)#994 |
| 48. | Round Lake | 100.0% | 18.7%(+81.3)#48 | 20.1%(+79.9)#1,055 |
| 49. | Brushton | 100.0% | 18.7%(+81.3)#49 | 20.1%(+79.9)#1,170 |
| 50. | Odessa | 100.0% | 18.7%(+81.3)#50 | 20.1%(+79.9)#1,177 |
| 51. | North Lynbrook | 100.0% | 18.7%(+81.3)#51 | 20.1%(+79.9)#1,229 |
| 52. | Brooktondale | 100.0% | 18.7%(+81.3)#52 | 20.1%(+79.9)#1,232 |
| 53. | Dresden | 100.0% | 18.7%(+81.3)#53 | 20.1%(+79.9)#1,246 |
| 54. | Almond | 100.0% | 18.7%(+81.3)#54 | 20.1%(+79.9)#1,259 |
| 55. | Lodi | 100.0% | 18.7%(+81.3)#55 | 20.1%(+79.9)#1,311 |
| 56. | Hammond | 100.0% | 18.7%(+81.3)#56 | 20.1%(+79.9)#1,337 |
| 57. | Lyon Mountain | 100.0% | 18.7%(+81.3)#57 | 20.1%(+79.9)#1,345 |
| 58. | Blodgett Mills | 100.0% | 18.7%(+81.3)#58 | 20.1%(+79.9)#1,374 |
| 59. | Ellisburg | 100.0% | 18.7%(+81.3)#59 | 20.1%(+79.9)#1,392 |
| 60. | Andes | 100.0% | 18.7%(+81.3)#60 | 20.1%(+79.9)#1,422 |
| 61. | East Hampton North | 94.3% | 18.7%(+75.6)#61 | 20.1%(+74.2)#1,458 |
| 62. | Freeport | 94.0% | 18.7%(+75.3)#62 | 20.1%(+73.9)#1,459 |
| 63. | Mattydale | 85.4% | 18.7%(+66.7)#63 | 20.1%(+65.3)#1,509 |
| 64. | Mountain Lodge Park | 85.2% | 18.7%(+66.5)#64 | 20.1%(+65.1)#1,512 |
| 65. | East Shoreham | 78.9% | 18.7%(+60.2)#65 | 20.1%(+58.8)#1,567 |
| 66. | West Haverstraw | 78.4% | 18.7%(+59.7)#66 | 20.1%(+58.3)#1,572 |
| 67. | Wells | 77.1% | 18.7%(+58.4)#67 | 20.1%(+57.0)#1,590 |
| 68. | Moravia | 75.0% | 18.7%(+56.3)#68 | 20.1%(+54.9)#1,622 |
| 69. | West Elmira | 69.6% | 18.7%(+50.9)#69 | 20.1%(+49.5)#1,682 |
| 70. | North Great River | 69.4% | 18.7%(+50.7)#70 | 20.1%(+49.3)#1,686 |
| 71. | Sleepy Hollow | 67.2% | 18.7%(+48.5)#71 | 20.1%(+47.1)#1,714 |
| 72. | Woodmere | 66.0% | 18.7%(+47.3)#72 | 20.1%(+45.9)#1,749 |
| 73. | Centereach | 64.0% | 18.7%(+45.3)#73 | 20.1%(+43.9)#1,793 |
| 74. | Sherrill | 63.2% | 18.7%(+44.5)#74 | 20.1%(+43.1)#1,811 |
| 75. | Roosevelt | 61.8% | 18.7%(+43.1)#75 | 20.1%(+41.7)#1,847 |
| 76. | Colonie | 61.5% | 18.7%(+42.8)#76 | 20.1%(+41.4)#1,858 |
| 77. | Northeast Ithaca | 61.5% | 18.7%(+42.8)#77 | 20.1%(+41.4)#1,859 |
| 78. | Kenmore | 60.2% | 18.7%(+41.5)#78 | 20.1%(+40.1)#1,877 |
| 79. | Hampton Bays | 59.5% | 18.7%(+40.8)#79 | 20.1%(+39.4)#1,900 |
| 80. | Plattsburgh | 59.3% | 18.7%(+40.6)#80 | 20.1%(+39.2)#1,905 |
| 81. | Niagara Falls | 58.5% | 18.7%(+39.8)#81 | 20.1%(+38.4)#1,917 |
| 82. | Sea Cliff | 58.5% | 18.7%(+39.8)#82 | 20.1%(+38.4)#1,920 |
| 83. | Hurley | 57.1% | 18.7%(+38.4)#83 | 20.1%(+37.0)#1,951 |
| 84. | Gloversville | 57.0% | 18.7%(+38.3)#84 | 20.1%(+36.9)#1,963 |
| 85. | Brentwood | 53.6% | 18.7%(+34.9)#85 | 20.1%(+33.5)#2,025 |
| 86. | Baywood | 52.9% | 18.7%(+34.2)#86 | 20.1%(+32.8)#2,041 |
| 87. | Depew | 52.4% | 18.7%(+33.7)#87 | 20.1%(+32.3)#2,056 |
| 88. | Fairmount | 51.6% | 18.7%(+32.9)#88 | 20.1%(+31.5)#2,078 |
| 89. | Gowanda | 51.2% | 18.7%(+32.5)#89 | 20.1%(+31.1)#2,088 |
| 90. | Copiague | 50.5% | 18.7%(+31.8)#90 | 20.1%(+30.4)#2,103 |
| 91. | Island Park | 49.3% | 18.7%(+30.6)#91 | 20.1%(+29.2)#2,171 |
| 92. | Batavia | 48.6% | 18.7%(+29.9)#92 | 20.1%(+28.5)#2,184 |
| 93. | Poughkeepsie | 48.2% | 18.7%(+29.5)#93 | 20.1%(+28.1)#2,192 |
| 94. | Fair Haven | 48.0% | 18.7%(+29.3)#94 | 20.1%(+27.9)#2,202 |
| 95. | Frankfort | 45.5% | 18.7%(+26.8)#95 | 20.1%(+25.4)#2,273 |
| 96. | Salamanca | 45.0% | 18.7%(+26.3)#96 | 20.1%(+24.9)#2,281 |
| 97. | Tuckahoe | 44.9% | 18.7%(+26.2)#97 | 20.1%(+24.8)#2,285 |
| 98. | Red Hook | 44.4% | 18.7%(+25.7)#98 | 20.1%(+24.3)#2,303 |
| 99. | Lancaster | 44.0% | 18.7%(+25.3)#99 | 20.1%(+23.9)#2,315 |
| 100. | Livingston Manor | 43.8% | 18.7%(+25.1)#100 | 20.1%(+23.7)#2,325 |
Common Questions
What are the Top 10 Cities with the Highest Percentage of Births to Unmarried Women over the Age of 35 in New York?
Top 10 Cities with the Highest Percentage of Births to Unmarried Women over the Age of 35 in New York are:
#1
100.0%
#2
100.0%
#3
100.0%
#4
100.0%
#5
100.0%
#6
100.0%
#7
100.0%
#8
100.0%
#9
100.0%
#10
100.0%
What city has the Highest Percentage of Births to Unmarried Women over the Age of 35 in New York?
Lackawanna has the Highest Percentage of Births to Unmarried Women over the Age of 35 in New York with 100.0%.
What is the Percentage of Births to Unmarried Women over the Age of 35 in the State of New York?
Percentage of Births to Unmarried Women over the Age of 35 in New York is 18.7%.
What is the Percentage of Births to Unmarried Women over the Age of 35 in the United States?
Percentage of Births to Unmarried Women over the Age of 35 in the United States is 20.1%.