Cities with the Highest Percentage of Births to Unmarried Women over the Age of 35 in Oregon

RELATED REPORTS & OPTIONS

Highest Illegitimacy | Women 35+
Population
Families and Households
Female Fertility
Female Fertility (Unmarried)
Race (Community Size)
Race (Percentage)
Ancestry (Community Size)
AfghanAfricanAlaska NativeAlaskan AthabascanAlbanianAleutAlsatianAmericanApacheArabArapahoArgentineanArmenianAssyrian / Chaldean / SyriacAustralianAustrianBahamianBangladeshiBarbadianBasqueBelgianBelizeanBermudanBhutaneseBlackfeetBolivianBrazilianBritishBritish West IndianBulgarianBurmeseCajunCambodianCanadianCape VerdeanCarpatho RusynCelticCentral AmericanCentral American IndianCherokeeCheyenneChickasawChileanChineseChippewaChoctawColombianColvilleComancheCosta RicanCreeCreekCroatianCrowCubanCypriotCzechCzechoslovakianDanishDelawareDominicanDutchDutch West IndianEastern EuropeanEcuadorianEgyptianEnglishEstonianEthiopianEuropeanFijianFilipinoFinnishFrenchFrench American IndianFrench CanadianGermanGerman RussianGhanaianGreekGuamanian / ChamorroGuatemalanGuyaneseHaitianHmongHonduranHopiHoumaHungarianIcelanderIndian (Asian)IndonesianInupiatIranianIraqiIrishIroquoisIsraeliItalianJamaicanJapaneseJordanianKenyanKiowaKoreanLaotianLatvianLebaneseLiberianLithuanianLumbeeLuxembourgerMacedonianMalaysianMalteseMarshalleseMenomineeMexicanMexican American IndianMongolianMoroccanNative HawaiianNavajoNepaleseNew ZealanderNicaraguanNigerianNorthern EuropeanNorwegianOkinawanOsageOttawaPaiutePakistaniPalestinianPanamanianParaguayanPennsylvania GermanPeruvianPimaPolishPortuguesePotawatomiPuebloPuerto RicanPuget Sound SalishRomanianRussianSalvadoranSamoanScandinavianScotch-IrishScottishSeminoleSenegaleseSerbianShoshoneSierra LeoneanSiouxSlavicSlovakSloveneSomaliSouth AfricanSouth AmericanSouth American IndianSoviet UnionSpaniardSpanishSpanish AmericanSpanish American IndianSri LankanSubsaharan AfricanSudaneseSwedishSwissSyrianTaiwaneseThaiTlingit-HaidaTohono O'OdhamTonganTrinidadian and TobagonianTsimshianTurkishU.S. Virgin IslanderUgandanUkrainianUruguayanUteVenezuelanVietnameseWelshWest IndianYakamaYaquiYugoslavianYumanYup'ikZimbabwean
Ancestry (Percentage)
AfghanAfricanAlaska NativeAlaskan AthabascanAlbanianAleutAlsatianAmericanApacheArabArapahoArgentineanArmenianAssyrian / Chaldean / SyriacAustralianAustrianBahamianBangladeshiBarbadianBasqueBelgianBelizeanBermudanBhutaneseBlackfeetBolivianBrazilianBritishBritish West IndianBulgarianBurmeseCajunCambodianCanadianCape VerdeanCarpatho RusynCelticCentral AmericanCentral American IndianCherokeeCheyenneChickasawChileanChineseChippewaChoctawColombianColvilleComancheCosta RicanCreeCreekCroatianCrowCubanCypriotCzechCzechoslovakianDanishDelawareDominicanDutchDutch West IndianEastern EuropeanEcuadorianEgyptianEnglishEstonianEthiopianEuropeanFijianFilipinoFinnishFrenchFrench American IndianFrench CanadianGermanGerman RussianGhanaianGreekGuamanian / ChamorroGuatemalanGuyaneseHaitianHmongHonduranHopiHoumaHungarianIcelanderIndian (Asian)IndonesianInupiatIranianIraqiIrishIroquoisIsraeliItalianJamaicanJapaneseJordanianKenyanKiowaKoreanLaotianLatvianLebaneseLiberianLithuanianLumbeeLuxembourgerMacedonianMalaysianMalteseMarshalleseMenomineeMexicanMexican American IndianMongolianMoroccanNative HawaiianNavajoNepaleseNew ZealanderNicaraguanNigerianNorthern EuropeanNorwegianOkinawanOsageOttawaPaiutePakistaniPalestinianPanamanianParaguayanPennsylvania GermanPeruvianPimaPolishPortuguesePotawatomiPuebloPuerto RicanPuget Sound SalishRomanianRussianSalvadoranSamoanScandinavianScotch-IrishScottishSeminoleSenegaleseSerbianShoshoneSierra LeoneanSiouxSlavicSlovakSloveneSomaliSouth AfricanSouth AmericanSouth American IndianSoviet UnionSpaniardSpanishSpanish AmericanSpanish American IndianSri LankanSubsaharan AfricanSudaneseSwedishSwissSyrianTaiwaneseThaiTlingit-HaidaTohono O'OdhamTonganTrinidadian and TobagonianTsimshianTurkishU.S. Virgin IslanderUgandanUkrainianUruguayanUteVenezuelanVietnameseWelshWest IndianYakamaYaquiYugoslavianYumanYup'ikZimbabwean
Immigrant Origin (Total)
AfghanistanAfricaAlbaniaArgentinaArmeniaAsiaAustraliaAustriaAzoresBahamasBangladeshBarbadosBelarusBelgiumBelizeBoliviaBosnia and HerzegovinaBrazilBulgariaBurma / MyanmarCabo VerdeCambodiaCameroonCanadaCaribbeanCentral AmericaChileChinaColombiaCongoCosta RicaCroatiaCubaCzechoslovakiaDenmarkDominicaDominican RepublicEastern AfricaEastern AsiaEastern EuropeEcuadorEgyptEl SalvadorEnglandEritreaEthiopiaEuropeFijiFranceGermanyGhanaGreeceGrenadaGuatemalaGuyanaHaitiHondurasHong KongHungaryIndiaIndonesiaIranIraqIrelandIsraelItalyJamaicaJapanJordanKazakhstanKenyaKoreaKuwaitLaosLatin AmericaLatviaLebanonLiberiaLithuaniaMalaysiaMexicoMicronesiaMiddle AfricaMoldovaMoroccoNepalNetherlandsNicaraguaNigeriaNorth MacedoniaNorthern AfricaNorthern EuropeNorwayOceaniaPakistanPanamaPeruPhilippinesPolandPortugalRomaniaRussiaSaudi ArabiaScotlandSenegalSerbiaSierra LeoneSingaporeSomaliaSouth AfricaSouth AmericaSouth Central AsiaSouth Eastern AsiaSouthern EuropeSpainSri LankaSt. Vincent and the GrenadinesSudanSwedenSwitzerlandSyriaTaiwanThailandTrinidad and TobagoTurkeyUgandaUkraineUruguayUzbekistanVenezuelaVietnamWest IndiesWestern AfricaWestern AsiaWestern EuropeYemenZaireZimbabwe
Immigrant Origin (Percentage)
AfghanistanAfricaAlbaniaArgentinaArmeniaAsiaAustraliaAustriaAzoresBahamasBangladeshBarbadosBelarusBelgiumBelizeBoliviaBosnia and HerzegovinaBrazilBulgariaBurma / MyanmarCabo VerdeCambodiaCameroonCanadaCaribbeanCentral AmericaChileChinaColombiaCongoCosta RicaCroatiaCubaCzechoslovakiaDenmarkDominicaDominican RepublicEastern AfricaEastern AsiaEastern EuropeEcuadorEgyptEl SalvadorEnglandEritreaEthiopiaEuropeFijiFranceGermanyGhanaGreeceGrenadaGuatemalaGuyanaHaitiHondurasHong KongHungaryIndiaIndonesiaIranIraqIrelandIsraelItalyJamaicaJapanJordanKazakhstanKenyaKoreaKuwaitLaosLatin AmericaLatviaLebanonLiberiaLithuaniaMalaysiaMexicoMicronesiaMiddle AfricaMoldovaMoroccoNepalNetherlandsNicaraguaNigeriaNorth MacedoniaNorthern AfricaNorthern EuropeNorwayOceaniaPakistanPanamaPeruPhilippinesPolandPortugalRomaniaRussiaSaudi ArabiaScotlandSenegalSerbiaSierra LeoneSingaporeSomaliaSouth AfricaSouth AmericaSouth Central AsiaSouth Eastern AsiaSouthern EuropeSpainSri LankaSt. Vincent and the GrenadinesSudanSwedenSwitzerlandSyriaTaiwanThailandTrinidad and TobagoTurkeyUgandaUkraineUruguayUzbekistanVenezuelaVietnamWest IndiesWestern AfricaWestern AsiaWestern EuropeYemenZaireZimbabwe
Income
Income (Families)
Income (Households)
Poverty
Poverty (Families)
Unemployment
Employment Occupations
Employment Industries
Employer Class
Commute Time
Commute Means
School Enrollment
Education by Degree Field
Occupancy
Finances
Physical Characteristics
Oregon
Compare Cities
Comparison Subject

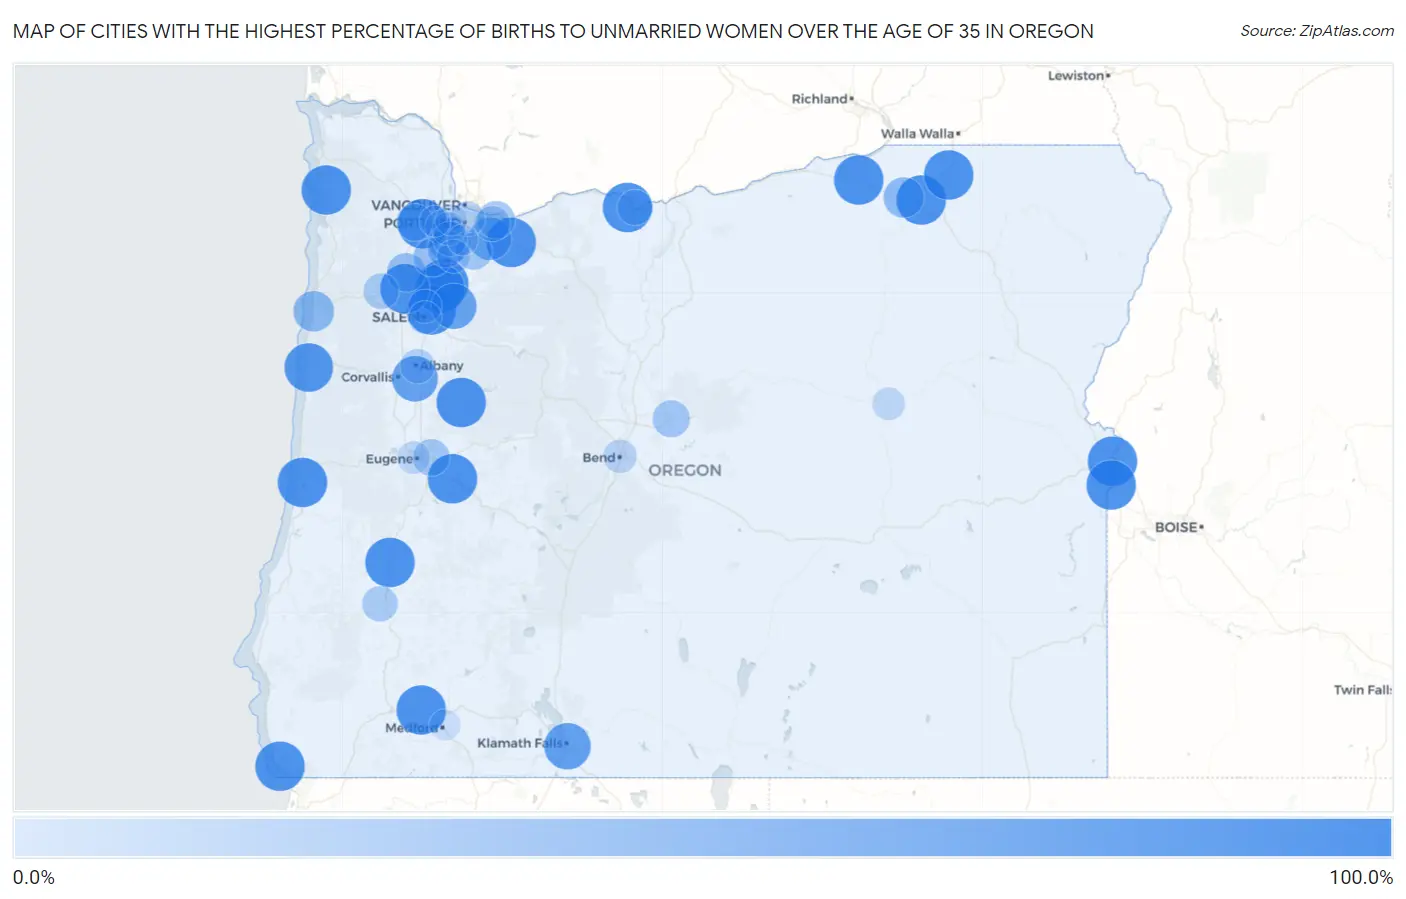
Map of Cities with the Highest Percentage of Births to Unmarried Women over the Age of 35 in Oregon

0.0%
100.0%
Cities with the Highest Percentage of Births to Unmarried Women over the Age of 35 in Oregon Map

Cities with the Highest Percentage of Births to Unmarried Women over the Age of 35 in Oregon

City % Unmarried vs State vs National
1.Woodburn100.0%16.9%(+83.1)#120.1%(+79.9)#18
2.Hayesville100.0%16.9%(+83.1)#220.1%(+79.9)#39
3.Cornelius100.0%16.9%(+83.1)#320.1%(+79.9)#113
4.Sandy100.0%16.9%(+83.1)#420.1%(+79.9)#120
5.Ontario100.0%16.9%(+83.1)#520.1%(+79.9)#139
6.Sweet Home100.0%16.9%(+83.1)#620.1%(+79.9)#189
7.Sutherlin100.0%16.9%(+83.1)#720.1%(+79.9)#228
8.Brookings100.0%16.9%(+83.1)#820.1%(+79.9)#289
9.Nyssa100.0%16.9%(+83.1)#920.1%(+79.9)#523
10.Gervais100.0%16.9%(+83.1)#1020.1%(+79.9)#614
11.Stanfield100.0%16.9%(+83.1)#1120.1%(+79.9)#687
12.Amity100.0%16.9%(+83.1)#1220.1%(+79.9)#765
13.Chenoweth100.0%16.9%(+83.1)#1320.1%(+79.9)#776
14.Gold Hill100.0%16.9%(+83.1)#1420.1%(+79.9)#894
15.Dunes City100.0%16.9%(+83.1)#1520.1%(+79.9)#904
16.Lowell100.0%16.9%(+83.1)#1620.1%(+79.9)#908
17.Mission100.0%16.9%(+83.1)#1720.1%(+79.9)#967
18.Weston100.0%16.9%(+83.1)#1820.1%(+79.9)#1,223
19.Nehalem100.0%16.9%(+83.1)#1920.1%(+79.9)#1,335
20.Ochoco West100.0%16.9%(+83.1)#2020.1%(+79.9)#1,360
21.Newport95.2%16.9%(+78.3)#2120.1%(+75.1)#1,455
22.Klamath Falls84.0%16.9%(+67.1)#2220.1%(+63.9)#1,522
23.Tangent80.0%16.9%(+63.1)#2320.1%(+59.9)#1,562
24.Silverton79.3%16.9%(+62.4)#2420.1%(+59.2)#1,565
25.Damascus63.5%16.9%(+46.6)#2520.1%(+43.4)#1,804
26.King City57.6%16.9%(+40.7)#2620.1%(+37.5)#1,940
27.Lincoln City53.3%16.9%(+36.4)#2720.1%(+33.2)#2,031
28.Pendleton51.8%16.9%(+34.9)#2820.1%(+31.7)#2,071
29.River Road50.0%16.9%(+33.1)#2920.1%(+29.9)#2,122
30.Mcminnville43.8%16.9%(+26.9)#3020.1%(+23.7)#2,320
31.Newberg41.9%16.9%(+25.0)#3120.1%(+21.8)#2,378
32.Troutdale38.0%16.9%(+21.1)#3220.1%(+17.9)#2,511
33.Sherwood37.6%16.9%(+20.7)#3320.1%(+17.5)#2,521
34.Prineville35.0%16.9%(+18.1)#3420.1%(+14.9)#2,623
35.Forest Grove34.1%16.9%(+17.2)#3520.1%(+14.0)#2,662
36.Springfield33.3%16.9%(+16.4)#3620.1%(+13.2)#2,679
37.Oregon City32.9%16.9%(+16.0)#3720.1%(+12.8)#2,738
38.Santa Clara29.2%16.9%(+12.3)#3820.1%(+9.10)#2,884
39.Sheridan27.6%16.9%(+10.7)#3920.1%(+7.50)#2,959
40.Winston26.9%16.9%(+10.00)#4020.1%(+6.80)#2,992
41.The Dalles26.2%16.9%(+9.30)#4120.1%(+6.10)#3,022
42.Gresham25.9%16.9%(+9.00)#4220.1%(+5.80)#3,034
43.Portland23.6%16.9%(+6.70)#4320.1%(+3.50)#3,131
44.Aloha22.8%16.9%(+5.90)#4420.1%(+2.70)#3,172
45.Albany21.6%16.9%(+4.70)#4520.1%(+1.50)#3,224
46.Tigard21.2%16.9%(+4.30)#4620.1%(+1.10)#3,246
47.Bend16.8%16.9%(-0.100)#4720.1%(-3.30)#3,466
48.Beaverton16.2%16.9%(-0.700)#4820.1%(-3.90)#3,498
49.Keizer16.2%16.9%(-0.700)#4920.1%(-3.90)#3,502
50.Wilsonville15.8%16.9%(-1.10)#5020.1%(-4.30)#3,524
51.Salem13.9%16.9%(-3.00)#5120.1%(-6.20)#3,642
52.Canyon City12.5%16.9%(-4.40)#5220.1%(-7.60)#3,728
53.Eugene11.9%16.9%(-5.00)#5320.1%(-8.20)#3,755
54.Cedar Mill5.2%16.9%(-11.7)#5420.1%(-14.9)#4,060
55.Medford4.8%16.9%(-12.1)#5520.1%(-15.3)#4,077
56.Hillsboro3.6%16.9%(-13.3)#5620.1%(-16.5)#4,117
57.Lake Oswego2.8%16.9%(-14.1)#5720.1%(-17.3)#4,140

Common Questions

What are the Top 10 Cities with the Highest Percentage of Births to Unmarried Women over the Age of 35 in Oregon?
Top 10 Cities with the Highest Percentage of Births to Unmarried Women over the Age of 35 in Oregon are:
#1
100.0%
#2
100.0%
#3
100.0%
#4
100.0%
#5
100.0%
#6
100.0%
#7
100.0%
#8
100.0%
#9
100.0%
#10
100.0%
What city has the Highest Percentage of Births to Unmarried Women over the Age of 35 in Oregon?
Woodburn has the Highest Percentage of Births to Unmarried Women over the Age of 35 in Oregon with 100.0%.
What is the Percentage of Births to Unmarried Women over the Age of 35 in the State of Oregon?
Percentage of Births to Unmarried Women over the Age of 35 in Oregon is 16.9%.
What is the Percentage of Births to Unmarried Women over the Age of 35 in the United States?
Percentage of Births to Unmarried Women over the Age of 35 in the United States is 20.1%.