Cities with the Highest Percentage of Births to Unmarried Women over the Age of 35 in Oklahoma
RELATED REPORTS & OPTIONS
Highest Illegitimacy | Women 35+
Oklahoma
Compare Cities
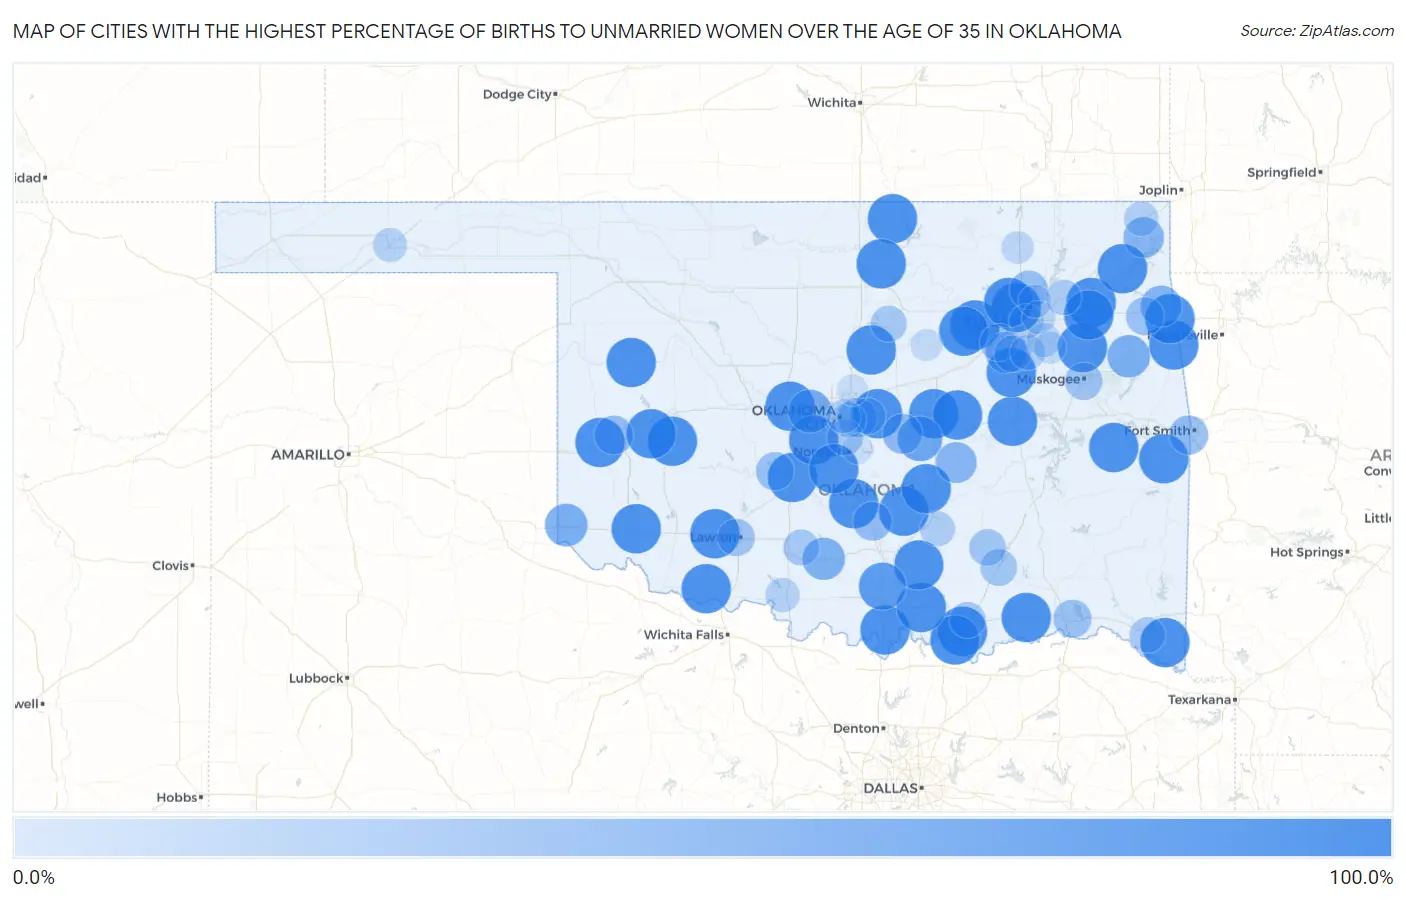
Map of Cities with the Highest Percentage of Births to Unmarried Women over the Age of 35 in Oklahoma
0.0%
100.0%
Cities with the Highest Percentage of Births to Unmarried Women over the Age of 35 in Oklahoma
| City | % Unmarried | vs State | vs National | |
| 1. | Altus | 100.0% | 22.0%(+78.0)#1 | 20.1%(+79.9)#49 |
| 2. | El Reno | 100.0% | 22.0%(+78.0)#2 | 20.1%(+79.9)#55 |
| 3. | Chickasha | 100.0% | 22.0%(+78.0)#3 | 20.1%(+79.9)#70 |
| 4. | Pryor Creek | 100.0% | 22.0%(+78.0)#4 | 20.1%(+79.9)#203 |
| 5. | Wagoner | 100.0% | 22.0%(+78.0)#5 | 20.1%(+79.9)#248 |
| 6. | Tuttle | 100.0% | 22.0%(+78.0)#6 | 20.1%(+79.9)#261 |
| 7. | Harrah | 100.0% | 22.0%(+78.0)#7 | 20.1%(+79.9)#303 |
| 8. | Henryetta | 100.0% | 22.0%(+78.0)#8 | 20.1%(+79.9)#344 |
| 9. | Sayre | 100.0% | 22.0%(+78.0)#9 | 20.1%(+79.9)#359 |
| 10. | Mannford | 100.0% | 22.0%(+78.0)#10 | 20.1%(+79.9)#515 |
| 11. | Cache | 100.0% | 22.0%(+78.0)#11 | 20.1%(+79.9)#549 |
| 12. | Turley | 100.0% | 22.0%(+78.0)#12 | 20.1%(+79.9)#552 |
| 13. | Calera | 100.0% | 22.0%(+78.0)#13 | 20.1%(+79.9)#557 |
| 14. | Marietta | 100.0% | 22.0%(+78.0)#14 | 20.1%(+79.9)#567 |
| 15. | New Cordell | 100.0% | 22.0%(+78.0)#15 | 20.1%(+79.9)#576 |
| 16. | Stigler | 100.0% | 22.0%(+78.0)#16 | 20.1%(+79.9)#598 |
| 17. | Chouteau | 100.0% | 22.0%(+78.0)#17 | 20.1%(+79.9)#698 |
| 18. | Burns Flat | 100.0% | 22.0%(+78.0)#18 | 20.1%(+79.9)#704 |
| 19. | Newkirk | 100.0% | 22.0%(+78.0)#19 | 20.1%(+79.9)#734 |
| 20. | Prague | 100.0% | 22.0%(+78.0)#20 | 20.1%(+79.9)#735 |
| 21. | Westville | 100.0% | 22.0%(+78.0)#21 | 20.1%(+79.9)#788 |
| 22. | Maysville | 100.0% | 22.0%(+78.0)#22 | 20.1%(+79.9)#832 |
| 23. | West Siloam Springs | 100.0% | 22.0%(+78.0)#23 | 20.1%(+79.9)#860 |
| 24. | Stratford | 100.0% | 22.0%(+78.0)#24 | 20.1%(+79.9)#869 |
| 25. | Colbert | 100.0% | 22.0%(+78.0)#25 | 20.1%(+79.9)#872 |
| 26. | Panama | 100.0% | 22.0%(+78.0)#26 | 20.1%(+79.9)#888 |
| 27. | Konawa | 100.0% | 22.0%(+78.0)#27 | 20.1%(+79.9)#917 |
| 28. | Oakland | 100.0% | 22.0%(+78.0)#28 | 20.1%(+79.9)#921 |
| 29. | Beggs | 100.0% | 22.0%(+78.0)#29 | 20.1%(+79.9)#928 |
| 30. | Boley | 100.0% | 22.0%(+78.0)#30 | 20.1%(+79.9)#937 |
| 31. | Sperry | 100.0% | 22.0%(+78.0)#31 | 20.1%(+79.9)#945 |
| 32. | Grandfield | 100.0% | 22.0%(+78.0)#32 | 20.1%(+79.9)#1,008 |
| 33. | Cole | 100.0% | 22.0%(+78.0)#33 | 20.1%(+79.9)#1,037 |
| 34. | Boswell | 100.0% | 22.0%(+78.0)#34 | 20.1%(+79.9)#1,074 |
| 35. | Coyle | 100.0% | 22.0%(+78.0)#35 | 20.1%(+79.9)#1,148 |
| 36. | Leedey | 100.0% | 22.0%(+78.0)#36 | 20.1%(+79.9)#1,176 |
| 37. | Ketchum | 100.0% | 22.0%(+78.0)#37 | 20.1%(+79.9)#1,196 |
| 38. | Marland | 100.0% | 22.0%(+78.0)#38 | 20.1%(+79.9)#1,313 |
| 39. | Haworth | 100.0% | 22.0%(+78.0)#39 | 20.1%(+79.9)#1,327 |
| 40. | Mill Creek | 100.0% | 22.0%(+78.0)#40 | 20.1%(+79.9)#1,340 |
| 41. | Lawrence Creek | 100.0% | 22.0%(+78.0)#41 | 20.1%(+79.9)#1,426 |
| 42. | Ardmore | 88.2% | 22.0%(+66.2)#42 | 20.1%(+68.1)#1,492 |
| 43. | Earlsboro | 75.0% | 22.0%(+53.0)#43 | 20.1%(+54.9)#1,625 |
| 44. | Yukon | 66.7% | 22.0%(+44.7)#44 | 20.1%(+46.6)#1,717 |
| 45. | Hollis | 64.3% | 22.0%(+42.3)#45 | 20.1%(+44.2)#1,789 |
| 46. | Tahlequah | 63.7% | 22.0%(+41.7)#46 | 20.1%(+43.6)#1,798 |
| 47. | Velma | 62.5% | 22.0%(+40.5)#47 | 20.1%(+42.4)#1,831 |
| 48. | Kiefer | 57.1% | 22.0%(+35.1)#48 | 20.1%(+37.0)#1,953 |
| 49. | Colcord | 57.1% | 22.0%(+35.1)#49 | 20.1%(+37.0)#1,959 |
| 50. | Wewoka | 55.0% | 22.0%(+33.0)#50 | 20.1%(+34.9)#1,998 |
| 51. | Fairland | 53.6% | 22.0%(+31.6)#51 | 20.1%(+33.5)#2,027 |
| 52. | Shawnee | 50.0% | 22.0%(+28.0)#52 | 20.1%(+29.9)#2,111 |
| 53. | Arkoma | 45.5% | 22.0%(+23.5)#53 | 20.1%(+25.4)#2,274 |
| 54. | Midwest City | 44.8% | 22.0%(+22.8)#54 | 20.1%(+24.7)#2,286 |
| 55. | Elk City | 44.4% | 22.0%(+22.4)#55 | 20.1%(+24.3)#2,297 |
| 56. | Pauls Valley | 44.4% | 22.0%(+22.4)#56 | 20.1%(+24.3)#2,299 |
| 57. | Collinsville | 42.9% | 22.0%(+20.9)#57 | 20.1%(+22.8)#2,348 |
| 58. | Hugo | 40.0% | 22.0%(+18.0)#58 | 20.1%(+19.9)#2,437 |
| 59. | Verden | 40.0% | 22.0%(+18.0)#59 | 20.1%(+19.9)#2,450 |
| 60. | Twin Oaks | 40.0% | 22.0%(+18.0)#60 | 20.1%(+19.9)#2,452 |
| 61. | Sapulpa | 37.5% | 22.0%(+15.5)#61 | 20.1%(+17.4)#2,526 |
| 62. | Muskogee | 37.2% | 22.0%(+15.2)#62 | 20.1%(+17.1)#2,546 |
| 63. | Lawton | 36.0% | 22.0%(+14.0)#63 | 20.1%(+15.9)#2,579 |
| 64. | Glenpool | 33.3% | 22.0%(+11.3)#64 | 20.1%(+13.2)#2,689 |
| 65. | Atoka | 33.3% | 22.0%(+11.3)#65 | 20.1%(+13.2)#2,705 |
| 66. | Coalgate | 33.3% | 22.0%(+11.3)#66 | 20.1%(+13.2)#2,712 |
| 67. | Choctaw | 31.0% | 22.0%(+9.00)#67 | 20.1%(+10.9)#2,805 |
| 68. | Moore | 30.3% | 22.0%(+8.30)#68 | 20.1%(+10.2)#2,828 |
| 69. | Stillwater | 30.3% | 22.0%(+8.30)#69 | 20.1%(+10.2)#2,829 |
| 70. | Durant | 30.0% | 22.0%(+8.00)#70 | 20.1%(+9.90)#2,843 |
| 71. | Duncan | 29.7% | 22.0%(+7.70)#71 | 20.1%(+9.60)#2,860 |
| 72. | Idabel | 28.0% | 22.0%(+6.00)#72 | 20.1%(+7.90)#2,942 |
| 73. | Claremore | 27.0% | 22.0%(+5.00)#73 | 20.1%(+6.90)#2,985 |
| 74. | Ada | 25.3% | 22.0%(+3.30)#74 | 20.1%(+5.20)#3,064 |
| 75. | Del City | 24.7% | 22.0%(+2.70)#75 | 20.1%(+4.60)#3,093 |
| 76. | Bixby | 23.7% | 22.0%(+1.70)#76 | 20.1%(+3.60)#3,127 |
| 77. | Miami | 22.2% | 22.0%(+0.200)#77 | 20.1%(+2.10)#3,193 |
| 78. | Tulsa | 21.5% | 22.0%(-0.500)#78 | 20.1%(+1.40)#3,228 |
| 79. | Waurika | 20.8% | 22.0%(-1.20)#79 | 20.1%(+0.700)#3,271 |
| 80. | Guymon | 19.5% | 22.0%(-2.50)#80 | 20.1%(-0.600)#3,338 |
| 81. | Broken Arrow | 18.7% | 22.0%(-3.30)#81 | 20.1%(-1.40)#3,365 |
| 82. | Oklahoma City | 18.3% | 22.0%(-3.70)#82 | 20.1%(-1.80)#3,385 |
| 83. | Catoosa | 15.2% | 22.0%(-6.80)#83 | 20.1%(-4.90)#3,562 |
| 84. | Owasso | 14.7% | 22.0%(-7.30)#84 | 20.1%(-5.40)#3,586 |
| 85. | Bartlesville | 11.9% | 22.0%(-10.1)#85 | 20.1%(-8.20)#3,756 |
| 86. | Coweta | 10.6% | 22.0%(-11.4)#86 | 20.1%(-9.50)#3,814 |
| 87. | Cushing | 8.7% | 22.0%(-13.3)#87 | 20.1%(-11.4)#3,900 |
| 88. | Edmond | 5.8% | 22.0%(-16.2)#88 | 20.1%(-14.3)#4,031 |
| 89. | Norman | 2.3% | 22.0%(-19.7)#89 | 20.1%(-17.8)#4,151 |
Common Questions
What are the Top 10 Cities with the Highest Percentage of Births to Unmarried Women over the Age of 35 in Oklahoma?
Top 10 Cities with the Highest Percentage of Births to Unmarried Women over the Age of 35 in Oklahoma are:
What city has the Highest Percentage of Births to Unmarried Women over the Age of 35 in Oklahoma?
Altus has the Highest Percentage of Births to Unmarried Women over the Age of 35 in Oklahoma with 100.0%.
What is the Percentage of Births to Unmarried Women over the Age of 35 in the State of Oklahoma?
Percentage of Births to Unmarried Women over the Age of 35 in Oklahoma is 22.0%.
What is the Percentage of Births to Unmarried Women over the Age of 35 in the United States?
Percentage of Births to Unmarried Women over the Age of 35 in the United States is 20.1%.