Cities with the Highest Percentage of Births to Unmarried Women over the Age of 35 in Florida
RELATED REPORTS & OPTIONS
Highest Illegitimacy | Women 35+
Florida
Compare Cities
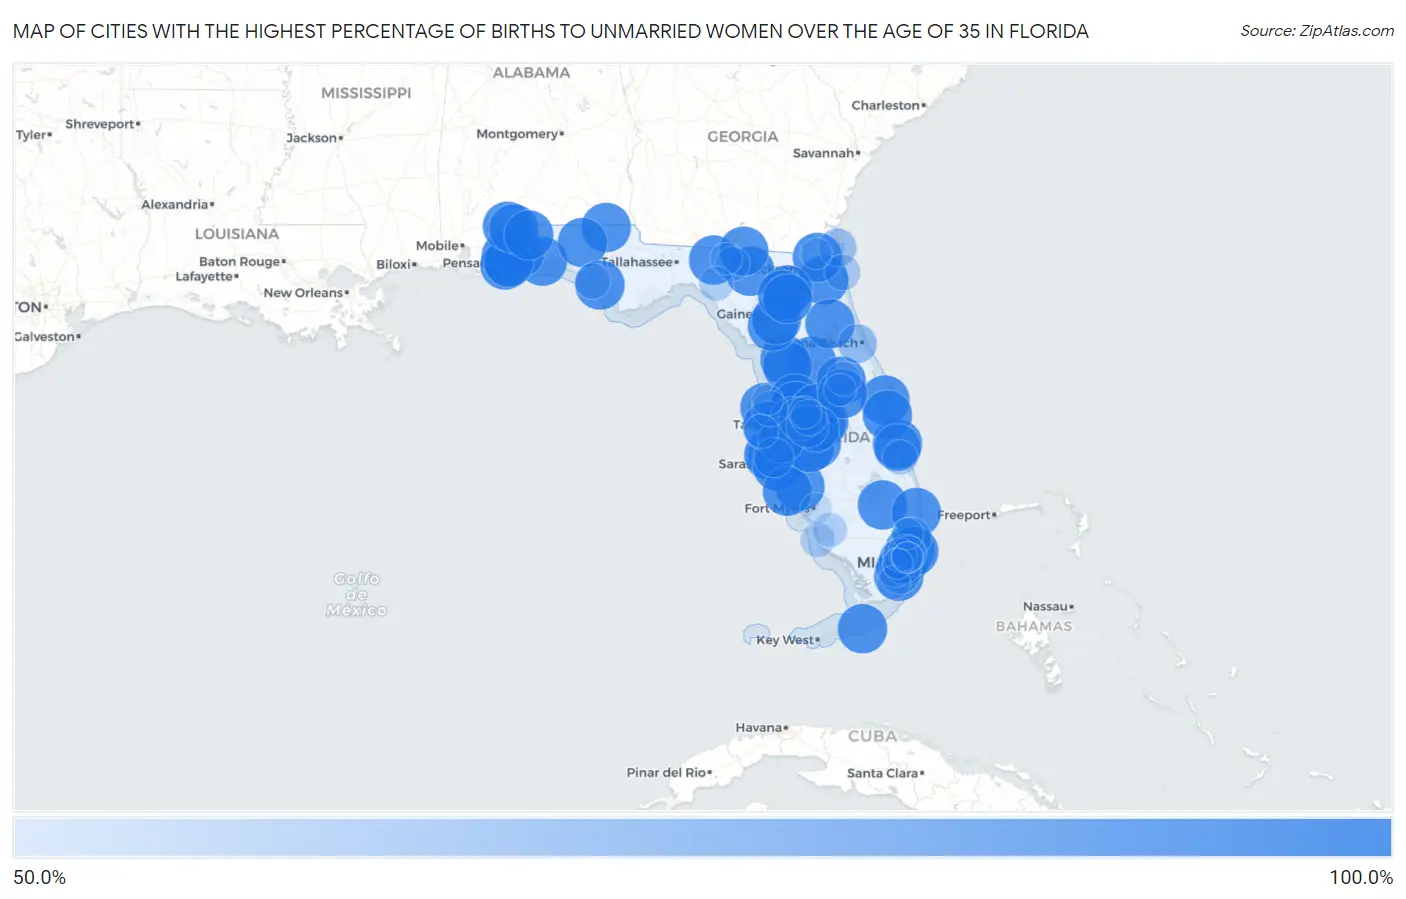
Map of Cities with the Highest Percentage of Births to Unmarried Women over the Age of 35 in Florida
0.0%
100.0%
Cities with the Highest Percentage of Births to Unmarried Women over the Age of 35 in Florida
| City | % Unmarried | vs State | vs National | |
| 1. | Port Charlotte | 100.0% | 26.5%(+73.5)#1 | 20.1%(+79.9)#2 |
| 2. | Lakewood Ranch | 100.0% | 26.5%(+73.5)#2 | 20.1%(+79.9)#7 |
| 3. | East Lake Orient Park | 100.0% | 26.5%(+73.5)#3 | 20.1%(+79.9)#14 |
| 4. | Wright | 100.0% | 26.5%(+73.5)#4 | 20.1%(+79.9)#17 |
| 5. | South Bradenton | 100.0% | 26.5%(+73.5)#5 | 20.1%(+79.9)#20 |
| 6. | Brent | 100.0% | 26.5%(+73.5)#6 | 20.1%(+79.9)#31 |
| 7. | Ensley | 100.0% | 26.5%(+73.5)#7 | 20.1%(+79.9)#35 |
| 8. | Belle Glade | 100.0% | 26.5%(+73.5)#8 | 20.1%(+79.9)#59 |
| 9. | Warrington | 100.0% | 26.5%(+73.5)#9 | 20.1%(+79.9)#65 |
| 10. | Vero Beach | 100.0% | 26.5%(+73.5)#10 | 20.1%(+79.9)#66 |
| 11. | Auburndale | 100.0% | 26.5%(+73.5)#11 | 20.1%(+79.9)#69 |
| 12. | Lady Lake | 100.0% | 26.5%(+73.5)#12 | 20.1%(+79.9)#73 |
| 13. | Elfers | 100.0% | 26.5%(+73.5)#13 | 20.1%(+79.9)#112 |
| 14. | Pasadena Hills | 100.0% | 26.5%(+73.5)#14 | 20.1%(+79.9)#118 |
| 15. | Mango | 100.0% | 26.5%(+73.5)#15 | 20.1%(+79.9)#122 |
| 16. | Goulds | 100.0% | 26.5%(+73.5)#16 | 20.1%(+79.9)#131 |
| 17. | Fuller Heights | 100.0% | 26.5%(+73.5)#17 | 20.1%(+79.9)#142 |
| 18. | Medulla | 100.0% | 26.5%(+73.5)#18 | 20.1%(+79.9)#144 |
| 19. | Cocoa Beach | 100.0% | 26.5%(+73.5)#19 | 20.1%(+79.9)#145 |
| 20. | Marathon | 100.0% | 26.5%(+73.5)#20 | 20.1%(+79.9)#191 |
| 21. | Cypress Gardens | 100.0% | 26.5%(+73.5)#21 | 20.1%(+79.9)#196 |
| 22. | Orange Park | 100.0% | 26.5%(+73.5)#22 | 20.1%(+79.9)#214 |
| 23. | Hernando | 100.0% | 26.5%(+73.5)#23 | 20.1%(+79.9)#217 |
| 24. | Inverness | 100.0% | 26.5%(+73.5)#24 | 20.1%(+79.9)#259 |
| 25. | Dade City | 100.0% | 26.5%(+73.5)#25 | 20.1%(+79.9)#266 |
| 26. | Live Oak | 100.0% | 26.5%(+73.5)#26 | 20.1%(+79.9)#287 |
| 27. | Pembroke Park | 100.0% | 26.5%(+73.5)#27 | 20.1%(+79.9)#302 |
| 28. | Zephyrhills West | 100.0% | 26.5%(+73.5)#28 | 20.1%(+79.9)#312 |
| 29. | Cortez | 100.0% | 26.5%(+73.5)#29 | 20.1%(+79.9)#385 |
| 30. | Ridge Wood Heights | 100.0% | 26.5%(+73.5)#30 | 20.1%(+79.9)#396 |
| 31. | Nassau Village Ratliff | 100.0% | 26.5%(+73.5)#31 | 20.1%(+79.9)#414 |
| 32. | Wahneta | 100.0% | 26.5%(+73.5)#32 | 20.1%(+79.9)#426 |
| 33. | Bagdad | 100.0% | 26.5%(+73.5)#33 | 20.1%(+79.9)#428 |
| 34. | Goulding | 100.0% | 26.5%(+73.5)#34 | 20.1%(+79.9)#496 |
| 35. | Feather Sound | 100.0% | 26.5%(+73.5)#35 | 20.1%(+79.9)#512 |
| 36. | Dover | 100.0% | 26.5%(+73.5)#36 | 20.1%(+79.9)#518 |
| 37. | San Castle | 100.0% | 26.5%(+73.5)#37 | 20.1%(+79.9)#524 |
| 38. | Indialantic | 100.0% | 26.5%(+73.5)#38 | 20.1%(+79.9)#543 |
| 39. | Polk City | 100.0% | 26.5%(+73.5)#39 | 20.1%(+79.9)#577 |
| 40. | Graceville | 100.0% | 26.5%(+73.5)#40 | 20.1%(+79.9)#588 |
| 41. | Eatonville | 100.0% | 26.5%(+73.5)#41 | 20.1%(+79.9)#641 |
| 42. | Bowling Green | 100.0% | 26.5%(+73.5)#42 | 20.1%(+79.9)#642 |
| 43. | Berkshire Lakes | 100.0% | 26.5%(+73.5)#43 | 20.1%(+79.9)#644 |
| 44. | Virginia Gardens | 100.0% | 26.5%(+73.5)#44 | 20.1%(+79.9)#648 |
| 45. | Century | 100.0% | 26.5%(+73.5)#45 | 20.1%(+79.9)#722 |
| 46. | East Bronson | 100.0% | 26.5%(+73.5)#46 | 20.1%(+79.9)#726 |
| 47. | Lake Butler | 100.0% | 26.5%(+73.5)#47 | 20.1%(+79.9)#746 |
| 48. | Grove City | 100.0% | 26.5%(+73.5)#48 | 20.1%(+79.9)#752 |
| 49. | Taft | 100.0% | 26.5%(+73.5)#49 | 20.1%(+79.9)#808 |
| 50. | Greenville | 100.0% | 26.5%(+73.5)#50 | 20.1%(+79.9)#820 |
| 51. | Pomona Park | 100.0% | 26.5%(+73.5)#51 | 20.1%(+79.9)#849 |
| 52. | Archer | 100.0% | 26.5%(+73.5)#52 | 20.1%(+79.9)#1,011 |
| 53. | Ponce De Leon | 100.0% | 26.5%(+73.5)#53 | 20.1%(+79.9)#1,065 |
| 54. | Jay | 100.0% | 26.5%(+73.5)#54 | 20.1%(+79.9)#1,069 |
| 55. | Tyndall Afb | 100.0% | 26.5%(+73.5)#55 | 20.1%(+79.9)#1,084 |
| 56. | Jennings | 100.0% | 26.5%(+73.5)#56 | 20.1%(+79.9)#1,094 |
| 57. | Fort Green Springs | 100.0% | 26.5%(+73.5)#57 | 20.1%(+79.9)#1,164 |
| 58. | Golden Beach | 100.0% | 26.5%(+73.5)#58 | 20.1%(+79.9)#1,183 |
| 59. | Munson | 100.0% | 26.5%(+73.5)#59 | 20.1%(+79.9)#1,272 |
| 60. | Worthington Springs | 100.0% | 26.5%(+73.5)#60 | 20.1%(+79.9)#1,336 |
| 61. | Brooker | 100.0% | 26.5%(+73.5)#61 | 20.1%(+79.9)#1,349 |
| 62. | Florida Ridge | 94.3% | 26.5%(+67.8)#62 | 20.1%(+74.2)#1,457 |
| 63. | Lake Worth Beach | 93.7% | 26.5%(+67.2)#63 | 20.1%(+73.6)#1,463 |
| 64. | Bartow | 91.7% | 26.5%(+65.2)#64 | 20.1%(+71.6)#1,472 |
| 65. | Ruskin | 91.3% | 26.5%(+64.8)#65 | 20.1%(+71.2)#1,473 |
| 66. | Plant City | 84.5% | 26.5%(+58.0)#66 | 20.1%(+64.4)#1,516 |
| 67. | Mulberry | 83.3% | 26.5%(+56.8)#67 | 20.1%(+63.2)#1,530 |
| 68. | Oakland Park | 78.4% | 26.5%(+51.9)#68 | 20.1%(+58.3)#1,571 |
| 69. | West Perrine | 78.4% | 26.5%(+51.9)#69 | 20.1%(+58.3)#1,573 |
| 70. | Bayshore Gardens | 77.5% | 26.5%(+51.0)#70 | 20.1%(+57.4)#1,588 |
| 71. | University Cdp Hillsborough County | 75.9% | 26.5%(+49.4)#71 | 20.1%(+55.8)#1,603 |
| 72. | Daytona Beach | 75.3% | 26.5%(+48.8)#72 | 20.1%(+55.2)#1,609 |
| 73. | Kendall West | 75.3% | 26.5%(+48.8)#73 | 20.1%(+55.2)#1,610 |
| 74. | Fernandina Beach | 73.3% | 26.5%(+46.8)#74 | 20.1%(+53.2)#1,637 |
| 75. | Coral Terrace | 72.8% | 26.5%(+46.3)#75 | 20.1%(+52.7)#1,642 |
| 76. | Miami Gardens | 68.5% | 26.5%(+42.0)#76 | 20.1%(+48.4)#1,702 |
| 77. | Lakeland | 68.4% | 26.5%(+41.9)#77 | 20.1%(+48.3)#1,703 |
| 78. | Jacksonville Beach | 68.1% | 26.5%(+41.6)#78 | 20.1%(+48.0)#1,708 |
| 79. | Lower Grand Lagoon | 67.9% | 26.5%(+41.4)#79 | 20.1%(+47.8)#1,710 |
| 80. | Trinity | 67.6% | 26.5%(+41.1)#80 | 20.1%(+47.5)#1,712 |
| 81. | Golden Glades | 67.1% | 26.5%(+40.6)#81 | 20.1%(+47.0)#1,715 |
| 82. | Fort Pierce | 65.9% | 26.5%(+39.4)#82 | 20.1%(+45.8)#1,750 |
| 83. | Lee | 64.7% | 26.5%(+38.2)#83 | 20.1%(+44.6)#1,773 |
| 84. | Perry | 64.5% | 26.5%(+38.0)#84 | 20.1%(+44.4)#1,777 |
| 85. | Naples | 64.4% | 26.5%(+37.9)#85 | 20.1%(+44.3)#1,779 |
| 86. | Orangetree | 64.3% | 26.5%(+37.8)#86 | 20.1%(+44.2)#1,786 |
| 87. | Fern Park | 64.0% | 26.5%(+37.5)#87 | 20.1%(+43.9)#1,794 |
| 88. | Seminole | 63.6% | 26.5%(+37.1)#88 | 20.1%(+43.5)#1,799 |
| 89. | Hialeah Gardens | 62.7% | 26.5%(+36.2)#89 | 20.1%(+42.6)#1,818 |
| 90. | Homestead | 61.6% | 26.5%(+35.1)#90 | 20.1%(+41.5)#1,851 |
| 91. | Kathleen | 60.0% | 26.5%(+33.5)#91 | 20.1%(+39.9)#1,885 |
| 92. | Oak Ridge | 59.7% | 26.5%(+33.2)#92 | 20.1%(+39.6)#1,896 |
| 93. | Madison | 58.7% | 26.5%(+32.2)#93 | 20.1%(+38.6)#1,914 |
| 94. | Fort Myers | 58.1% | 26.5%(+31.6)#94 | 20.1%(+38.0)#1,925 |
| 95. | Pinewood | 57.6% | 26.5%(+31.1)#95 | 20.1%(+37.5)#1,937 |
| 96. | Margate | 57.5% | 26.5%(+31.0)#96 | 20.1%(+37.4)#1,941 |
| 97. | Callahan | 57.1% | 26.5%(+30.6)#97 | 20.1%(+37.0)#1,954 |
| 98. | Bayonet Point | 56.4% | 26.5%(+29.9)#98 | 20.1%(+36.3)#1,972 |
| 99. | West Little River | 55.9% | 26.5%(+29.4)#99 | 20.1%(+35.8)#1,980 |
| 100. | Tamiami | 55.1% | 26.5%(+28.6)#100 | 20.1%(+35.0)#1,993 |
Common Questions
What are the Top 10 Cities with the Highest Percentage of Births to Unmarried Women over the Age of 35 in Florida?
Top 10 Cities with the Highest Percentage of Births to Unmarried Women over the Age of 35 in Florida are:
#1
100.0%
#2
100.0%
#3
100.0%
#4
100.0%
#5
100.0%
#6
100.0%
#7
100.0%
#8
100.0%
#9
100.0%
#10
100.0%
What city has the Highest Percentage of Births to Unmarried Women over the Age of 35 in Florida?
Port Charlotte has the Highest Percentage of Births to Unmarried Women over the Age of 35 in Florida with 100.0%.
What is the Percentage of Births to Unmarried Women over the Age of 35 in the State of Florida?
Percentage of Births to Unmarried Women over the Age of 35 in Florida is 26.5%.
What is the Percentage of Births to Unmarried Women over the Age of 35 in the United States?
Percentage of Births to Unmarried Women over the Age of 35 in the United States is 20.1%.