Cities with the Highest Percentage of Births to Unmarried Women over the Age of 35 in Utah

RELATED REPORTS & OPTIONS

Highest Illegitimacy | Women 35+
Population
Families and Households
Female Fertility
Female Fertility (Unmarried)
Race (Community Size)
Race (Percentage)
Ancestry (Community Size)
AfghanAfricanAlaska NativeAlaskan AthabascanAlbanianAleutAlsatianAmericanApacheArabArapahoArgentineanArmenianAssyrian / Chaldean / SyriacAustralianAustrianBahamianBangladeshiBarbadianBasqueBelgianBelizeanBermudanBhutaneseBlackfeetBolivianBrazilianBritishBritish West IndianBulgarianBurmeseCajunCambodianCanadianCape VerdeanCarpatho RusynCelticCentral AmericanCentral American IndianCherokeeCheyenneChickasawChileanChineseChippewaChoctawColombianColvilleComancheCosta RicanCreeCreekCroatianCrowCubanCypriotCzechCzechoslovakianDanishDelawareDominicanDutchDutch West IndianEastern EuropeanEcuadorianEgyptianEnglishEstonianEthiopianEuropeanFijianFilipinoFinnishFrenchFrench American IndianFrench CanadianGermanGerman RussianGhanaianGreekGuamanian / ChamorroGuatemalanGuyaneseHaitianHmongHonduranHopiHoumaHungarianIcelanderIndian (Asian)IndonesianInupiatIranianIraqiIrishIroquoisIsraeliItalianJamaicanJapaneseJordanianKenyanKiowaKoreanLaotianLatvianLebaneseLiberianLithuanianLumbeeLuxembourgerMacedonianMalaysianMalteseMarshalleseMenomineeMexicanMexican American IndianMongolianMoroccanNative HawaiianNavajoNepaleseNew ZealanderNicaraguanNigerianNorthern EuropeanNorwegianOkinawanOsageOttawaPaiutePakistaniPalestinianPanamanianParaguayanPennsylvania GermanPeruvianPimaPolishPortuguesePotawatomiPuebloPuerto RicanPuget Sound SalishRomanianRussianSalvadoranSamoanScandinavianScotch-IrishScottishSeminoleSenegaleseSerbianShoshoneSierra LeoneanSiouxSlavicSlovakSloveneSomaliSouth AfricanSouth AmericanSouth American IndianSoviet UnionSpaniardSpanishSpanish AmericanSpanish American IndianSri LankanSubsaharan AfricanSudaneseSwedishSwissSyrianTaiwaneseThaiTlingit-HaidaTohono O'OdhamTonganTrinidadian and TobagonianTsimshianTurkishU.S. Virgin IslanderUgandanUkrainianUruguayanUteVenezuelanVietnameseWelshWest IndianYakamaYaquiYugoslavianYumanYup'ikZimbabwean
Ancestry (Percentage)
AfghanAfricanAlaska NativeAlaskan AthabascanAlbanianAleutAlsatianAmericanApacheArabArapahoArgentineanArmenianAssyrian / Chaldean / SyriacAustralianAustrianBahamianBangladeshiBarbadianBasqueBelgianBelizeanBermudanBhutaneseBlackfeetBolivianBrazilianBritishBritish West IndianBulgarianBurmeseCajunCambodianCanadianCape VerdeanCarpatho RusynCelticCentral AmericanCentral American IndianCherokeeCheyenneChickasawChileanChineseChippewaChoctawColombianColvilleComancheCosta RicanCreeCreekCroatianCrowCubanCypriotCzechCzechoslovakianDanishDelawareDominicanDutchDutch West IndianEastern EuropeanEcuadorianEgyptianEnglishEstonianEthiopianEuropeanFijianFilipinoFinnishFrenchFrench American IndianFrench CanadianGermanGerman RussianGhanaianGreekGuamanian / ChamorroGuatemalanGuyaneseHaitianHmongHonduranHopiHoumaHungarianIcelanderIndian (Asian)IndonesianInupiatIranianIraqiIrishIroquoisIsraeliItalianJamaicanJapaneseJordanianKenyanKiowaKoreanLaotianLatvianLebaneseLiberianLithuanianLumbeeLuxembourgerMacedonianMalaysianMalteseMarshalleseMenomineeMexicanMexican American IndianMongolianMoroccanNative HawaiianNavajoNepaleseNew ZealanderNicaraguanNigerianNorthern EuropeanNorwegianOkinawanOsageOttawaPaiutePakistaniPalestinianPanamanianParaguayanPennsylvania GermanPeruvianPimaPolishPortuguesePotawatomiPuebloPuerto RicanPuget Sound SalishRomanianRussianSalvadoranSamoanScandinavianScotch-IrishScottishSeminoleSenegaleseSerbianShoshoneSierra LeoneanSiouxSlavicSlovakSloveneSomaliSouth AfricanSouth AmericanSouth American IndianSoviet UnionSpaniardSpanishSpanish AmericanSpanish American IndianSri LankanSubsaharan AfricanSudaneseSwedishSwissSyrianTaiwaneseThaiTlingit-HaidaTohono O'OdhamTonganTrinidadian and TobagonianTsimshianTurkishU.S. Virgin IslanderUgandanUkrainianUruguayanUteVenezuelanVietnameseWelshWest IndianYakamaYaquiYugoslavianYumanYup'ikZimbabwean
Immigrant Origin (Total)
AfghanistanAfricaAlbaniaArgentinaArmeniaAsiaAustraliaAustriaAzoresBahamasBangladeshBarbadosBelarusBelgiumBelizeBoliviaBosnia and HerzegovinaBrazilBulgariaBurma / MyanmarCabo VerdeCambodiaCameroonCanadaCaribbeanCentral AmericaChileChinaColombiaCongoCosta RicaCroatiaCubaCzechoslovakiaDenmarkDominicaDominican RepublicEastern AfricaEastern AsiaEastern EuropeEcuadorEgyptEl SalvadorEnglandEritreaEthiopiaEuropeFijiFranceGermanyGhanaGreeceGrenadaGuatemalaGuyanaHaitiHondurasHong KongHungaryIndiaIndonesiaIranIraqIrelandIsraelItalyJamaicaJapanJordanKazakhstanKenyaKoreaKuwaitLaosLatin AmericaLatviaLebanonLiberiaLithuaniaMalaysiaMexicoMicronesiaMiddle AfricaMoldovaMoroccoNepalNetherlandsNicaraguaNigeriaNorth MacedoniaNorthern AfricaNorthern EuropeNorwayOceaniaPakistanPanamaPeruPhilippinesPolandPortugalRomaniaRussiaSaudi ArabiaScotlandSenegalSerbiaSierra LeoneSingaporeSomaliaSouth AfricaSouth AmericaSouth Central AsiaSouth Eastern AsiaSouthern EuropeSpainSri LankaSt. Vincent and the GrenadinesSudanSwedenSwitzerlandSyriaTaiwanThailandTrinidad and TobagoTurkeyUgandaUkraineUruguayUzbekistanVenezuelaVietnamWest IndiesWestern AfricaWestern AsiaWestern EuropeYemenZaireZimbabwe
Immigrant Origin (Percentage)
AfghanistanAfricaAlbaniaArgentinaArmeniaAsiaAustraliaAustriaAzoresBahamasBangladeshBarbadosBelarusBelgiumBelizeBoliviaBosnia and HerzegovinaBrazilBulgariaBurma / MyanmarCabo VerdeCambodiaCameroonCanadaCaribbeanCentral AmericaChileChinaColombiaCongoCosta RicaCroatiaCubaCzechoslovakiaDenmarkDominicaDominican RepublicEastern AfricaEastern AsiaEastern EuropeEcuadorEgyptEl SalvadorEnglandEritreaEthiopiaEuropeFijiFranceGermanyGhanaGreeceGrenadaGuatemalaGuyanaHaitiHondurasHong KongHungaryIndiaIndonesiaIranIraqIrelandIsraelItalyJamaicaJapanJordanKazakhstanKenyaKoreaKuwaitLaosLatin AmericaLatviaLebanonLiberiaLithuaniaMalaysiaMexicoMicronesiaMiddle AfricaMoldovaMoroccoNepalNetherlandsNicaraguaNigeriaNorth MacedoniaNorthern AfricaNorthern EuropeNorwayOceaniaPakistanPanamaPeruPhilippinesPolandPortugalRomaniaRussiaSaudi ArabiaScotlandSenegalSerbiaSierra LeoneSingaporeSomaliaSouth AfricaSouth AmericaSouth Central AsiaSouth Eastern AsiaSouthern EuropeSpainSri LankaSt. Vincent and the GrenadinesSudanSwedenSwitzerlandSyriaTaiwanThailandTrinidad and TobagoTurkeyUgandaUkraineUruguayUzbekistanVenezuelaVietnamWest IndiesWestern AfricaWestern AsiaWestern EuropeYemenZaireZimbabwe
Income
Income (Families)
Income (Households)
Poverty
Poverty (Families)
Unemployment
Employment Occupations
Employment Industries
Employer Class
Commute Time
Commute Means
School Enrollment
Education by Degree Field
Occupancy
Finances
Physical Characteristics
Utah
Compare Cities
Comparison Subject

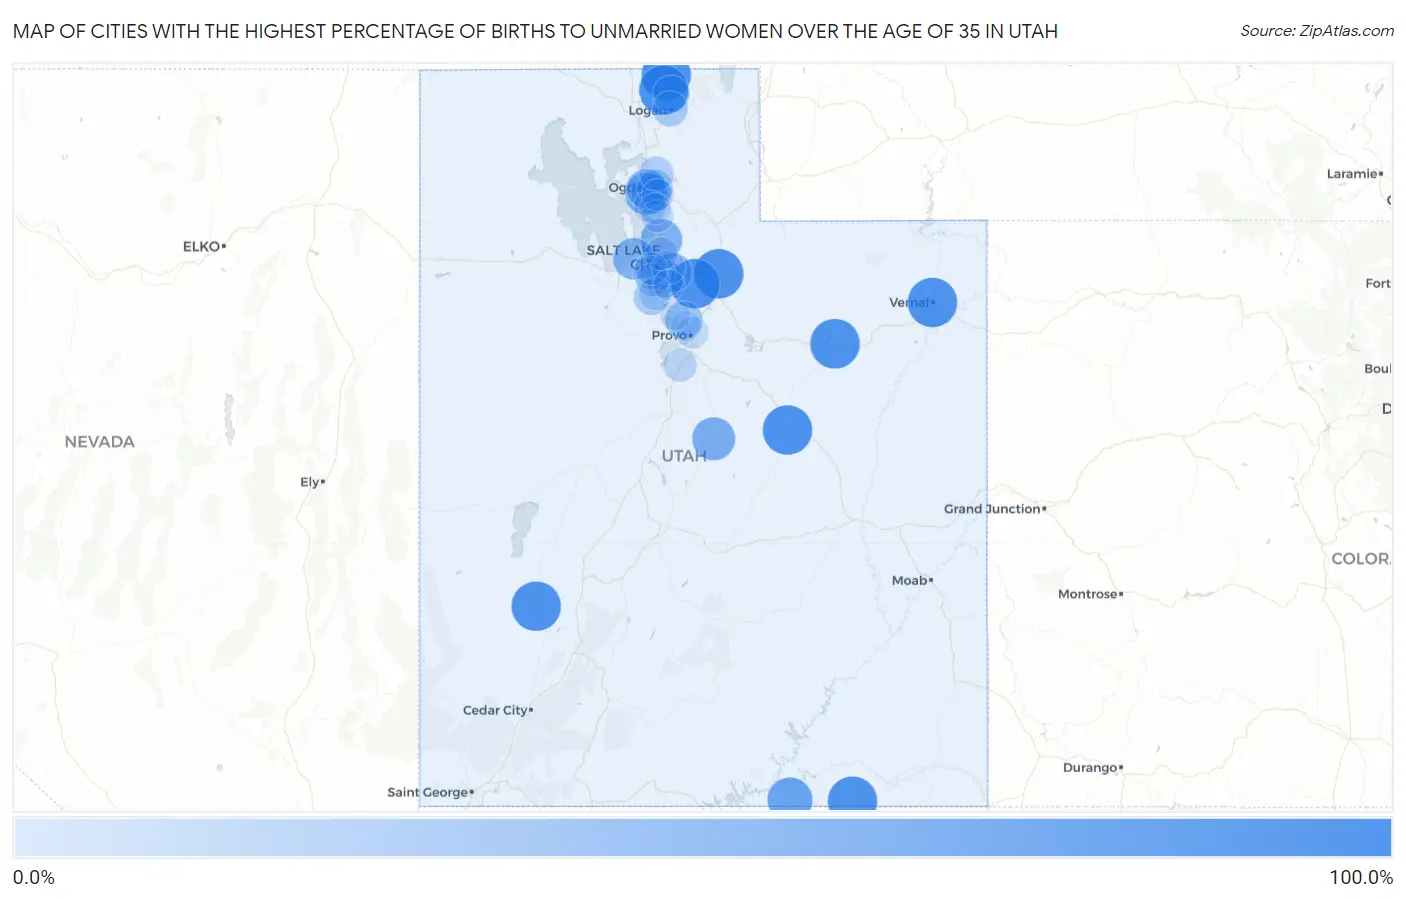
Map of Cities with the Highest Percentage of Births to Unmarried Women over the Age of 35 in Utah

0.0%
100.0%
Cities with the Highest Percentage of Births to Unmarried Women over the Age of 35 in Utah Map

Cities with the Highest Percentage of Births to Unmarried Women over the Age of 35 in Utah

City % Unmarried vs State vs National
1.Vernal100.0%11.4%(+88.6)#120.1%(+79.9)#181
2.Price100.0%11.4%(+88.6)#220.1%(+79.9)#237
3.Lewiston100.0%11.4%(+88.6)#320.1%(+79.9)#674
4.Duchesne100.0%11.4%(+88.6)#420.1%(+79.9)#736
5.Milford100.0%11.4%(+88.6)#520.1%(+79.9)#760
6.Hideout100.0%11.4%(+88.6)#620.1%(+79.9)#954
7.Oljato Monument Valley100.0%11.4%(+88.6)#720.1%(+79.9)#1,098
8.Amalga100.0%11.4%(+88.6)#820.1%(+79.9)#1,216
9.Alta100.0%11.4%(+88.6)#920.1%(+79.9)#1,278
10.Navajo Mountain76.5%11.4%(+65.1)#1020.1%(+56.4)#1,599
11.Mount Pleasant65.9%11.4%(+54.5)#1120.1%(+45.8)#1,751
12.Roy62.8%11.4%(+51.4)#1220.1%(+42.7)#1,814
13.Woods Cross60.5%11.4%(+49.1)#1320.1%(+40.4)#1,874
14.Magna57.9%11.4%(+46.5)#1420.1%(+37.8)#1,930
15.Riverdale48.3%11.4%(+36.9)#1520.1%(+28.2)#2,191
16.West Haven47.6%11.4%(+36.2)#1620.1%(+27.5)#2,205
17.Holladay45.6%11.4%(+34.2)#1720.1%(+25.5)#2,260
18.Lindon37.5%11.4%(+26.1)#1820.1%(+17.4)#2,528
19.Midvale35.7%11.4%(+24.3)#1920.1%(+15.6)#2,593
20.Smithfield31.3%11.4%(+19.9)#2020.1%(+11.2)#2,791
21.Ogden26.9%11.4%(+15.5)#2120.1%(+6.80)#2,991
22.Herriman26.2%11.4%(+14.8)#2220.1%(+6.10)#3,018
23.Logan25.9%11.4%(+14.5)#2320.1%(+5.80)#3,036
24.Taylorsville24.6%11.4%(+13.2)#2420.1%(+4.50)#3,096
25.North Ogden22.0%11.4%(+10.6)#2520.1%(+1.90)#3,207
26.Kearns18.1%11.4%(+6.70)#2620.1%(-2.00)#3,398
27.Payson16.1%11.4%(+4.70)#2720.1%(-4.00)#3,509
28.Millcreek14.9%11.4%(+3.50)#2820.1%(-5.20)#3,575
29.West Jordan14.7%11.4%(+3.30)#2920.1%(-5.40)#3,583
30.Salt Lake City14.6%11.4%(+3.20)#3020.1%(-5.50)#3,595
31.Riverton13.7%11.4%(+2.30)#3120.1%(-6.40)#3,656
32.West Valley City12.6%11.4%(+1.20)#3220.1%(-7.50)#3,715
33.Provo10.8%11.4%(-0.600)#3320.1%(-9.30)#3,804
34.Clearfield10.2%11.4%(-1.20)#3420.1%(-9.90)#3,828
35.Kaysville9.8%11.4%(-1.60)#3520.1%(-10.3)#3,848
36.South Ogden9.0%11.4%(-2.40)#3620.1%(-11.1)#3,886
37.Layton6.8%11.4%(-4.60)#3720.1%(-13.3)#3,992
38.Sandy3.4%11.4%(-8.00)#3820.1%(-16.7)#4,126
39.Orem2.4%11.4%(-9.00)#3920.1%(-17.7)#4,147
40.American Fork2.2%11.4%(-9.20)#4020.1%(-17.9)#4,159

Common Questions

What are the Top 10 Cities with the Highest Percentage of Births to Unmarried Women over the Age of 35 in Utah?
Top 10 Cities with the Highest Percentage of Births to Unmarried Women over the Age of 35 in Utah are:
#1
100.0%
#2
100.0%
#3
100.0%
#4
100.0%
#5
100.0%
#6
100.0%
#7
100.0%
#8
100.0%
#9
100.0%
#10
76.5%
What city has the Highest Percentage of Births to Unmarried Women over the Age of 35 in Utah?
Vernal has the Highest Percentage of Births to Unmarried Women over the Age of 35 in Utah with 100.0%.
What is the Percentage of Births to Unmarried Women over the Age of 35 in the State of Utah?
Percentage of Births to Unmarried Women over the Age of 35 in Utah is 11.4%.
What is the Percentage of Births to Unmarried Women over the Age of 35 in the United States?
Percentage of Births to Unmarried Women over the Age of 35 in the United States is 20.1%.