Cities with the Highest Percentage of Births to Unmarried Women over the Age of 35 in Illinois
RELATED REPORTS & OPTIONS
Highest Illegitimacy | Women 35+
Illinois
Compare Cities
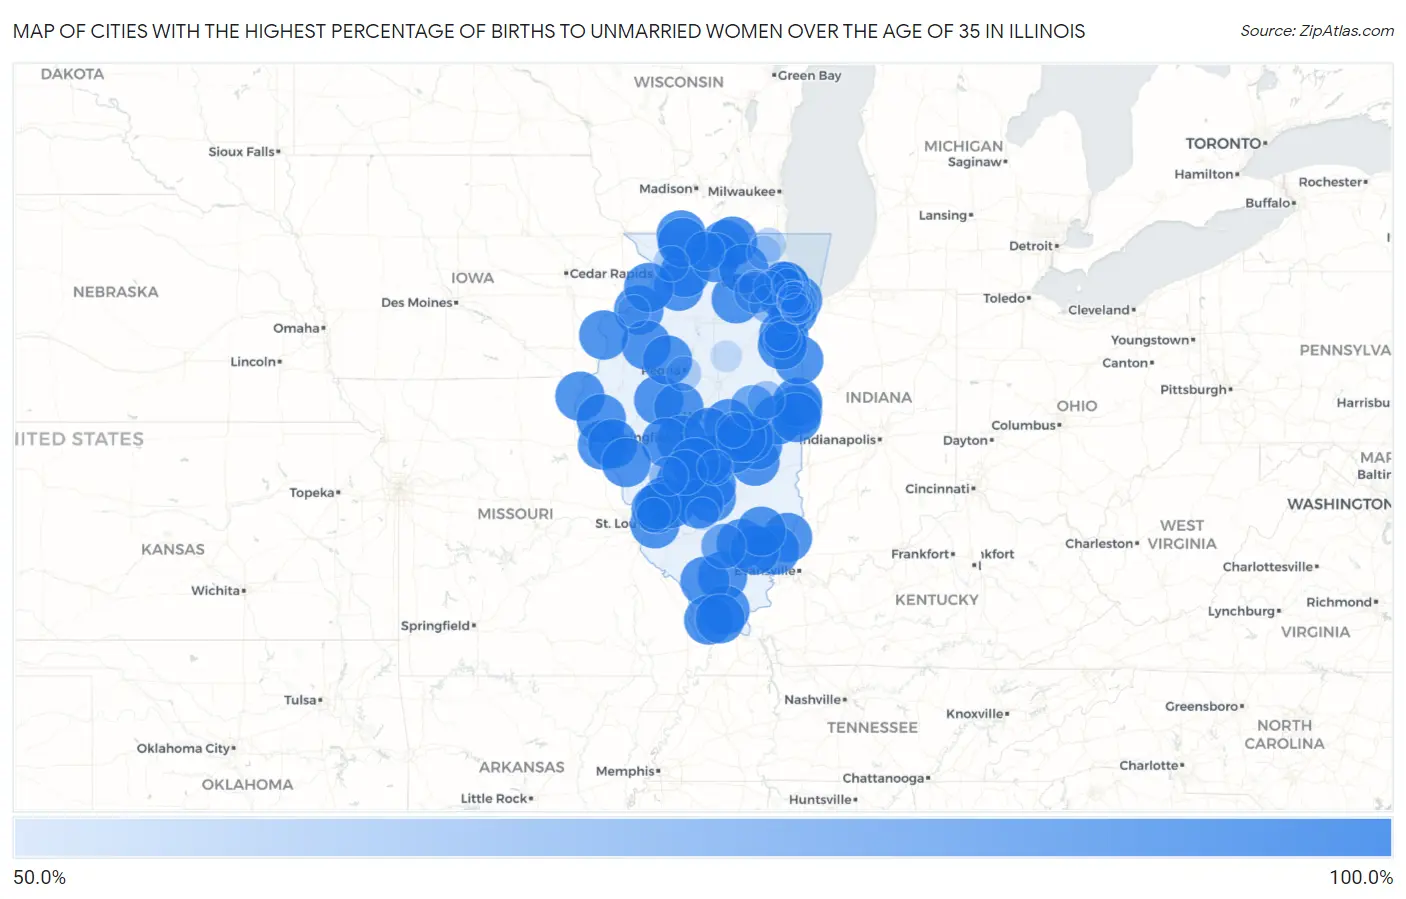
Map of Cities with the Highest Percentage of Births to Unmarried Women over the Age of 35 in Illinois
0.0%
100.0%
Cities with the Highest Percentage of Births to Unmarried Women over the Age of 35 in Illinois
| City | % Unmarried | vs State | vs National | |
| 1. | Danville | 100.0% | 19.2%(+80.8)#1 | 20.1%(+79.9)#15 |
| 2. | Dolton | 100.0% | 19.2%(+80.8)#2 | 20.1%(+79.9)#41 |
| 3. | Park Forest | 100.0% | 19.2%(+80.8)#3 | 20.1%(+79.9)#42 |
| 4. | East St Louis | 100.0% | 19.2%(+80.8)#4 | 20.1%(+79.9)#48 |
| 5. | Mattoon | 100.0% | 19.2%(+80.8)#5 | 20.1%(+79.9)#61 |
| 6. | Bradley | 100.0% | 19.2%(+80.8)#6 | 20.1%(+79.9)#82 |
| 7. | Sterling | 100.0% | 19.2%(+80.8)#7 | 20.1%(+79.9)#85 |
| 8. | Midlothian | 100.0% | 19.2%(+80.8)#8 | 20.1%(+79.9)#93 |
| 9. | Summit | 100.0% | 19.2%(+80.8)#9 | 20.1%(+79.9)#151 |
| 10. | Lyons | 100.0% | 19.2%(+80.8)#10 | 20.1%(+79.9)#161 |
| 11. | Silvis | 100.0% | 19.2%(+80.8)#11 | 20.1%(+79.9)#245 |
| 12. | West Frankfort | 100.0% | 19.2%(+80.8)#12 | 20.1%(+79.9)#271 |
| 13. | Mount Carmel | 100.0% | 19.2%(+80.8)#13 | 20.1%(+79.9)#274 |
| 14. | Litchfield | 100.0% | 19.2%(+80.8)#14 | 20.1%(+79.9)#277 |
| 15. | Vandalia | 100.0% | 19.2%(+80.8)#15 | 20.1%(+79.9)#316 |
| 16. | Willow Springs | 100.0% | 19.2%(+80.8)#16 | 20.1%(+79.9)#329 |
| 17. | Holiday Shores | 100.0% | 19.2%(+80.8)#17 | 20.1%(+79.9)#513 |
| 18. | Havana | 100.0% | 19.2%(+80.8)#18 | 20.1%(+79.9)#520 |
| 19. | Arcola | 100.0% | 19.2%(+80.8)#19 | 20.1%(+79.9)#585 |
| 20. | Polo | 100.0% | 19.2%(+80.8)#20 | 20.1%(+79.9)#634 |
| 21. | Vienna | 100.0% | 19.2%(+80.8)#21 | 20.1%(+79.9)#657 |
| 22. | Mason City | 100.0% | 19.2%(+80.8)#22 | 20.1%(+79.9)#662 |
| 23. | Somonauk | 100.0% | 19.2%(+80.8)#23 | 20.1%(+79.9)#758 |
| 24. | Southern View | 100.0% | 19.2%(+80.8)#24 | 20.1%(+79.9)#761 |
| 25. | Hodgkins | 100.0% | 19.2%(+80.8)#25 | 20.1%(+79.9)#778 |
| 26. | De Soto | 100.0% | 19.2%(+80.8)#26 | 20.1%(+79.9)#782 |
| 27. | Hartford | 100.0% | 19.2%(+80.8)#27 | 20.1%(+79.9)#796 |
| 28. | Grayville | 100.0% | 19.2%(+80.8)#28 | 20.1%(+79.9)#822 |
| 29. | Warsaw | 100.0% | 19.2%(+80.8)#29 | 20.1%(+79.9)#825 |
| 30. | Barry | 100.0% | 19.2%(+80.8)#30 | 20.1%(+79.9)#826 |
| 31. | Timberlane | 100.0% | 19.2%(+80.8)#31 | 20.1%(+79.9)#841 |
| 32. | Camp Point | 100.0% | 19.2%(+80.8)#32 | 20.1%(+79.9)#850 |
| 33. | Capron | 100.0% | 19.2%(+80.8)#33 | 20.1%(+79.9)#861 |
| 34. | New Milford | 100.0% | 19.2%(+80.8)#34 | 20.1%(+79.9)#890 |
| 35. | New Berlin | 100.0% | 19.2%(+80.8)#35 | 20.1%(+79.9)#898 |
| 36. | Bethany | 100.0% | 19.2%(+80.8)#36 | 20.1%(+79.9)#903 |
| 37. | Homer | 100.0% | 19.2%(+80.8)#37 | 20.1%(+79.9)#958 |
| 38. | Atwood | 100.0% | 19.2%(+80.8)#38 | 20.1%(+79.9)#982 |
| 39. | Wayne City | 100.0% | 19.2%(+80.8)#39 | 20.1%(+79.9)#984 |
| 40. | Hamel | 100.0% | 19.2%(+80.8)#40 | 20.1%(+79.9)#992 |
| 41. | Ramsey | 100.0% | 19.2%(+80.8)#41 | 20.1%(+79.9)#1,003 |
| 42. | Orangeville | 100.0% | 19.2%(+80.8)#42 | 20.1%(+79.9)#1,004 |
| 43. | Argenta | 100.0% | 19.2%(+80.8)#43 | 20.1%(+79.9)#1,013 |
| 44. | Willow Lake | 100.0% | 19.2%(+80.8)#44 | 20.1%(+79.9)#1,048 |
| 45. | Wataga | 100.0% | 19.2%(+80.8)#45 | 20.1%(+79.9)#1,075 |
| 46. | Owaneco | 100.0% | 19.2%(+80.8)#47 | 20.1%(+79.9)#1,077 |
| 47. | Lake Carroll | 100.0% | 19.2%(+80.8)#48 | 20.1%(+79.9)#1,078 |
| 48. | Niantic | 100.0% | 19.2%(+80.8)#49 | 20.1%(+79.9)#1,083 |
| 49. | Brimfield | 100.0% | 19.2%(+80.8)#50 | 20.1%(+79.9)#1,112 |
| 50. | Albany | 100.0% | 19.2%(+80.8)#51 | 20.1%(+79.9)#1,113 |
| 51. | Cedarville | 100.0% | 19.2%(+80.8)#52 | 20.1%(+79.9)#1,138 |
| 52. | Bismarck | 100.0% | 19.2%(+80.8)#53 | 20.1%(+79.9)#1,153 |
| 53. | New Boston | 100.0% | 19.2%(+80.8)#54 | 20.1%(+79.9)#1,160 |
| 54. | Hammond | 100.0% | 19.2%(+80.8)#55 | 20.1%(+79.9)#1,188 |
| 55. | Ullin | 100.0% | 19.2%(+80.8)#56 | 20.1%(+79.9)#1,191 |
| 56. | Karnak | 100.0% | 19.2%(+80.8)#57 | 20.1%(+79.9)#1,244 |
| 57. | Burlington | 100.0% | 19.2%(+80.8)#58 | 20.1%(+79.9)#1,248 |
| 58. | Belgium | 100.0% | 19.2%(+80.8)#59 | 20.1%(+79.9)#1,324 |
| 59. | Iroquois | 100.0% | 19.2%(+80.8)#60 | 20.1%(+79.9)#1,348 |
| 60. | Palmer | 100.0% | 19.2%(+80.8)#61 | 20.1%(+79.9)#1,352 |
| 61. | Smithboro | 100.0% | 19.2%(+80.8)#62 | 20.1%(+79.9)#1,365 |
| 62. | New Salem | 100.0% | 19.2%(+80.8)#63 | 20.1%(+79.9)#1,380 |
| 63. | Sammons Point | 100.0% | 19.2%(+80.8)#64 | 20.1%(+79.9)#1,394 |
| 64. | Mill Shoals | 100.0% | 19.2%(+80.8)#65 | 20.1%(+79.9)#1,405 |
| 65. | Mount Erie | 100.0% | 19.2%(+80.8)#66 | 20.1%(+79.9)#1,417 |
| 66. | Pearl | 100.0% | 19.2%(+80.8)#67 | 20.1%(+79.9)#1,433 |
| 67. | Cahokia Heights | 92.8% | 19.2%(+73.6)#68 | 20.1%(+72.7)#1,467 |
| 68. | Wood River | 91.9% | 19.2%(+72.7)#69 | 20.1%(+71.8)#1,470 |
| 69. | Raymond | 90.0% | 19.2%(+70.8)#70 | 20.1%(+69.9)#1,480 |
| 70. | Mount Vernon | 88.9% | 19.2%(+69.7)#71 | 20.1%(+68.8)#1,488 |
| 71. | Mahomet | 88.4% | 19.2%(+69.2)#72 | 20.1%(+68.3)#1,491 |
| 72. | Richton Park | 85.2% | 19.2%(+66.0)#73 | 20.1%(+65.1)#1,511 |
| 73. | Montgomery | 80.7% | 19.2%(+61.5)#74 | 20.1%(+60.6)#1,552 |
| 74. | South Holland | 78.0% | 19.2%(+58.8)#75 | 20.1%(+57.9)#1,576 |
| 75. | Winnebago | 76.5% | 19.2%(+57.3)#76 | 20.1%(+56.4)#1,598 |
| 76. | Carlinville | 75.0% | 19.2%(+55.8)#77 | 20.1%(+54.9)#1,616 |
| 77. | Crest Hill | 74.1% | 19.2%(+54.9)#78 | 20.1%(+54.0)#1,629 |
| 78. | Rantoul | 71.1% | 19.2%(+51.9)#79 | 20.1%(+51.0)#1,667 |
| 79. | Kankakee | 70.5% | 19.2%(+51.3)#80 | 20.1%(+50.4)#1,673 |
| 80. | Pana | 66.7% | 19.2%(+47.5)#81 | 20.1%(+46.6)#1,729 |
| 81. | Lanark | 66.7% | 19.2%(+47.5)#82 | 20.1%(+46.6)#1,736 |
| 82. | Cerro Gordo | 66.7% | 19.2%(+47.5)#83 | 20.1%(+46.6)#1,737 |
| 83. | Creve Coeur | 64.8% | 19.2%(+45.6)#84 | 20.1%(+44.7)#1,767 |
| 84. | Melrose Park | 64.5% | 19.2%(+45.3)#85 | 20.1%(+44.4)#1,775 |
| 85. | Glenwood | 64.5% | 19.2%(+45.3)#86 | 20.1%(+44.4)#1,776 |
| 86. | Bourbonnais | 64.4% | 19.2%(+45.2)#87 | 20.1%(+44.3)#1,780 |
| 87. | Granite City | 64.3% | 19.2%(+45.1)#88 | 20.1%(+44.2)#1,781 |
| 88. | Riverdale | 64.3% | 19.2%(+45.1)#89 | 20.1%(+44.2)#1,783 |
| 89. | Round Lake | 63.3% | 19.2%(+44.1)#90 | 20.1%(+43.2)#1,807 |
| 90. | Port Barrington | 62.5% | 19.2%(+43.3)#91 | 20.1%(+42.4)#1,829 |
| 91. | Alsip | 60.4% | 19.2%(+41.2)#92 | 20.1%(+40.3)#1,875 |
| 92. | Lisle | 60.0% | 19.2%(+40.8)#93 | 20.1%(+39.9)#1,881 |
| 93. | Keyesport | 60.0% | 19.2%(+40.8)#94 | 20.1%(+39.9)#1,892 |
| 94. | North Aurora | 59.7% | 19.2%(+40.5)#95 | 20.1%(+39.6)#1,898 |
| 95. | Moline | 59.1% | 19.2%(+39.9)#96 | 20.1%(+39.0)#1,910 |
| 96. | Flanagan | 57.1% | 19.2%(+37.9)#97 | 20.1%(+37.0)#1,958 |
| 97. | Blue Island | 56.1% | 19.2%(+36.9)#98 | 20.1%(+36.0)#1,975 |
| 98. | Markham | 54.5% | 19.2%(+35.3)#99 | 20.1%(+34.4)#2,008 |
| 99. | Chicago Heights | 54.4% | 19.2%(+35.2)#100 | 20.1%(+34.3)#2,013 |
| 100. | Berwyn | 53.5% | 19.2%(+34.3)#101 | 20.1%(+33.4)#2,028 |
Common Questions
What are the Top 10 Cities with the Highest Percentage of Births to Unmarried Women over the Age of 35 in Illinois?
Top 10 Cities with the Highest Percentage of Births to Unmarried Women over the Age of 35 in Illinois are:
#1
100.0%
#2
100.0%
#3
100.0%
#4
100.0%
#5
100.0%
#6
100.0%
#7
100.0%
#8
100.0%
#9
100.0%
#10
100.0%
What city has the Highest Percentage of Births to Unmarried Women over the Age of 35 in Illinois?
Danville has the Highest Percentage of Births to Unmarried Women over the Age of 35 in Illinois with 100.0%.
What is the Percentage of Births to Unmarried Women over the Age of 35 in the State of Illinois?
Percentage of Births to Unmarried Women over the Age of 35 in Illinois is 19.2%.
What is the Percentage of Births to Unmarried Women over the Age of 35 in the United States?
Percentage of Births to Unmarried Women over the Age of 35 in the United States is 20.1%.