Cities with the Highest Percentage of Births to Unmarried Women over the Age of 35 in Iowa
RELATED REPORTS & OPTIONS
Highest Illegitimacy | Women 35+
Iowa
Compare Cities
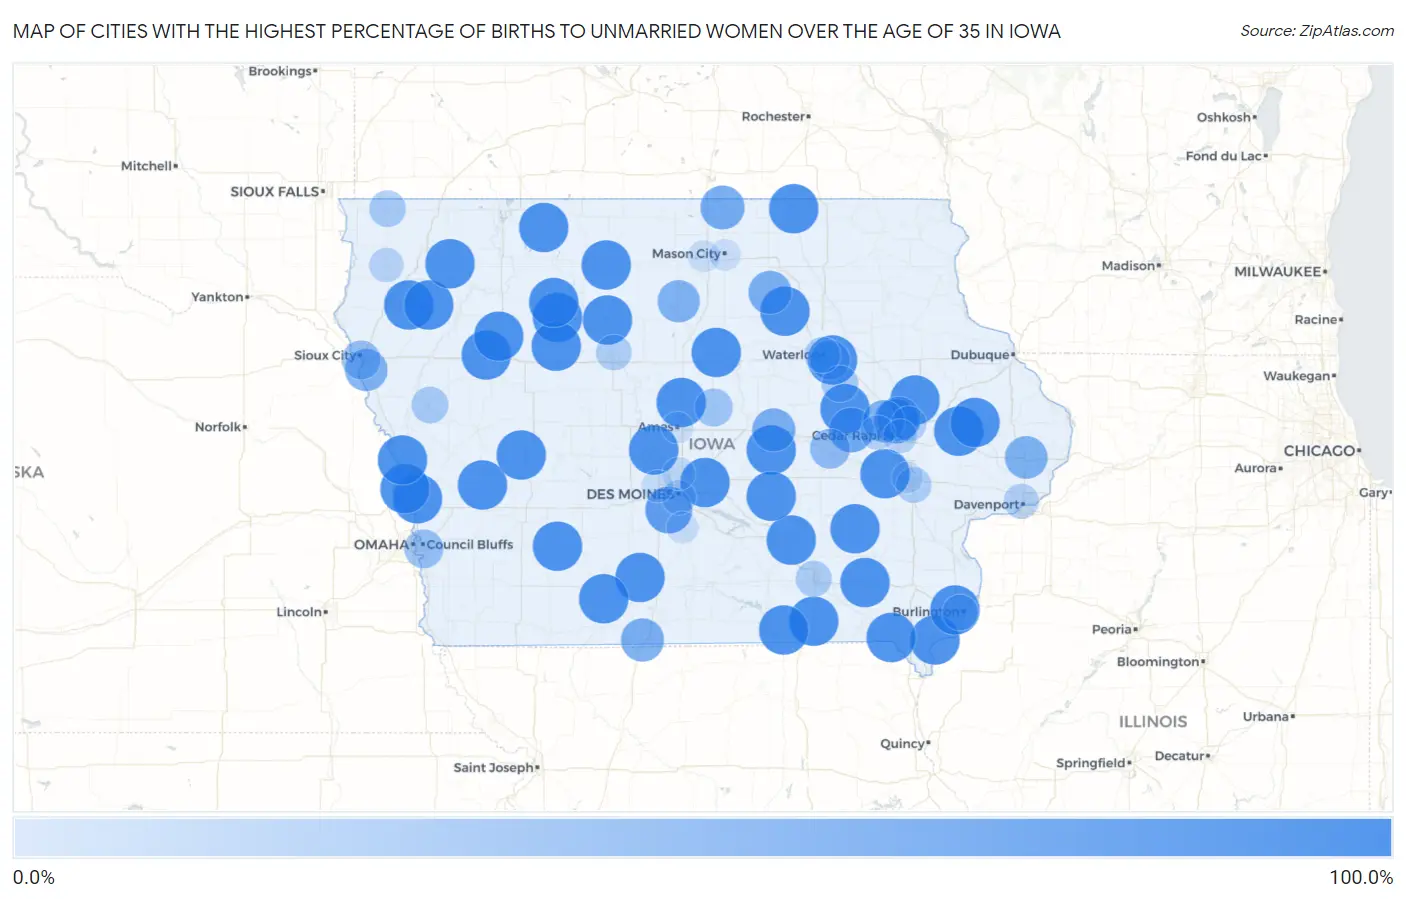
Map of Cities with the Highest Percentage of Births to Unmarried Women over the Age of 35 in Iowa
0.0%
100.0%
Cities with the Highest Percentage of Births to Unmarried Women over the Age of 35 in Iowa
| City | % Unmarried | vs State | vs National | |
| 1. | Fort Madison | 100.0% | 17.2%(+82.8)#1 | 20.1%(+79.9)#177 |
| 2. | Fairfield | 100.0% | 17.2%(+82.8)#2 | 20.1%(+79.9)#204 |
| 3. | Algona | 100.0% | 17.2%(+82.8)#3 | 20.1%(+79.9)#360 |
| 4. | Iowa Falls | 100.0% | 17.2%(+82.8)#4 | 20.1%(+79.9)#380 |
| 5. | Harlan | 100.0% | 17.2%(+82.8)#5 | 20.1%(+79.9)#388 |
| 6. | Humboldt | 100.0% | 17.2%(+82.8)#6 | 20.1%(+79.9)#398 |
| 7. | Story City | 100.0% | 17.2%(+82.8)#7 | 20.1%(+79.9)#506 |
| 8. | West Burlington | 100.0% | 17.2%(+82.8)#8 | 20.1%(+79.9)#525 |
| 9. | Madrid | 100.0% | 17.2%(+82.8)#9 | 20.1%(+79.9)#574 |
| 10. | Missouri Valley | 100.0% | 17.2%(+82.8)#10 | 20.1%(+79.9)#595 |
| 11. | Bloomfield | 100.0% | 17.2%(+82.8)#11 | 20.1%(+79.9)#597 |
| 12. | Mitchellville | 100.0% | 17.2%(+82.8)#12 | 20.1%(+79.9)#638 |
| 13. | Remsen | 100.0% | 17.2%(+82.8)#13 | 20.1%(+79.9)#690 |
| 14. | Pocahontas | 100.0% | 17.2%(+82.8)#14 | 20.1%(+79.9)#802 |
| 15. | Clarksville | 100.0% | 17.2%(+82.8)#15 | 20.1%(+79.9)#877 |
| 16. | Marcus | 100.0% | 17.2%(+82.8)#16 | 20.1%(+79.9)#910 |
| 17. | Central City | 100.0% | 17.2%(+82.8)#17 | 20.1%(+79.9)#918 |
| 18. | Elk Run Heights | 100.0% | 17.2%(+82.8)#18 | 20.1%(+79.9)#1,020 |
| 19. | Olin | 100.0% | 17.2%(+82.8)#19 | 20.1%(+79.9)#1,026 |
| 20. | Primghar | 100.0% | 17.2%(+82.8)#20 | 20.1%(+79.9)#1,028 |
| 21. | Schaller | 100.0% | 17.2%(+82.8)#21 | 20.1%(+79.9)#1,041 |
| 22. | Oxford | 100.0% | 17.2%(+82.8)#22 | 20.1%(+79.9)#1,109 |
| 23. | Murray | 100.0% | 17.2%(+82.8)#23 | 20.1%(+79.9)#1,116 |
| 24. | Lakeside | 100.0% | 17.2%(+82.8)#24 | 20.1%(+79.9)#1,124 |
| 25. | Moulton | 100.0% | 17.2%(+82.8)#25 | 20.1%(+79.9)#1,143 |
| 26. | Gilman | 100.0% | 17.2%(+82.8)#26 | 20.1%(+79.9)#1,157 |
| 27. | University Park | 100.0% | 17.2%(+82.8)#27 | 20.1%(+79.9)#1,167 |
| 28. | Wyoming | 100.0% | 17.2%(+82.8)#28 | 20.1%(+79.9)#1,190 |
| 29. | Pomeroy | 100.0% | 17.2%(+82.8)#29 | 20.1%(+79.9)#1,201 |
| 30. | Farmington | 100.0% | 17.2%(+82.8)#30 | 20.1%(+79.9)#1,210 |
| 31. | Lynnville | 100.0% | 17.2%(+82.8)#31 | 20.1%(+79.9)#1,215 |
| 32. | Garrison | 100.0% | 17.2%(+82.8)#32 | 20.1%(+79.9)#1,298 |
| 33. | Modale | 100.0% | 17.2%(+82.8)#33 | 20.1%(+79.9)#1,359 |
| 34. | Havelock | 100.0% | 17.2%(+82.8)#34 | 20.1%(+79.9)#1,395 |
| 35. | Little Sioux | 100.0% | 17.2%(+82.8)#35 | 20.1%(+79.9)#1,396 |
| 36. | Wallingford | 100.0% | 17.2%(+82.8)#36 | 20.1%(+79.9)#1,406 |
| 37. | Harper | 100.0% | 17.2%(+82.8)#37 | 20.1%(+79.9)#1,419 |
| 38. | Bridgewater | 100.0% | 17.2%(+82.8)#38 | 20.1%(+79.9)#1,425 |
| 39. | Mcintire | 100.0% | 17.2%(+82.8)#39 | 20.1%(+79.9)#1,431 |
| 40. | Shannon City | 100.0% | 17.2%(+82.8)#40 | 20.1%(+79.9)#1,435 |
| 41. | Gray | 100.0% | 17.2%(+82.8)#41 | 20.1%(+79.9)#1,443 |
| 42. | Norwalk | 86.2% | 17.2%(+69.0)#42 | 20.1%(+66.1)#1,505 |
| 43. | Van Horne | 75.0% | 17.2%(+57.8)#43 | 20.1%(+54.9)#1,624 |
| 44. | Hiawatha | 74.1% | 17.2%(+56.9)#44 | 20.1%(+54.0)#1,630 |
| 45. | Robins | 72.4% | 17.2%(+55.2)#45 | 20.1%(+52.3)#1,649 |
| 46. | Northwood | 71.4% | 17.2%(+54.2)#46 | 20.1%(+51.3)#1,663 |
| 47. | Lamoni | 66.7% | 17.2%(+49.5)#47 | 20.1%(+46.6)#1,732 |
| 48. | Greene | 66.7% | 17.2%(+49.5)#48 | 20.1%(+46.6)#1,738 |
| 49. | Le Grand | 66.7% | 17.2%(+49.5)#49 | 20.1%(+46.6)#1,742 |
| 50. | Dewitt | 64.3% | 17.2%(+47.1)#50 | 20.1%(+44.2)#1,785 |
| 51. | Sergeant Bluff | 62.1% | 17.2%(+44.9)#51 | 20.1%(+42.0)#1,841 |
| 52. | Belmond | 61.9% | 17.2%(+44.7)#52 | 20.1%(+41.8)#1,845 |
| 53. | Palo | 61.1% | 17.2%(+43.9)#53 | 20.1%(+41.0)#1,866 |
| 54. | Belle Plaine | 50.0% | 17.2%(+32.8)#54 | 20.1%(+29.9)#2,138 |
| 55. | Evansdale | 48.9% | 17.2%(+31.7)#55 | 20.1%(+28.8)#2,179 |
| 56. | Sioux City | 45.2% | 17.2%(+28.0)#56 | 20.1%(+25.1)#2,278 |
| 57. | Council Bluffs | 45.0% | 17.2%(+27.8)#57 | 20.1%(+24.9)#2,280 |
| 58. | Zearing | 40.0% | 17.2%(+22.8)#58 | 20.1%(+19.9)#2,448 |
| 59. | Rock Rapids | 33.3% | 17.2%(+16.1)#59 | 20.1%(+13.2)#2,707 |
| 60. | La Porte City | 33.3% | 17.2%(+16.1)#60 | 20.1%(+13.2)#2,710 |
| 61. | Mapleton | 33.3% | 17.2%(+16.1)#61 | 20.1%(+13.2)#2,720 |
| 62. | Ottumwa | 29.5% | 17.2%(+12.3)#62 | 20.1%(+9.40)#2,868 |
| 63. | Waterloo | 29.1% | 17.2%(+11.9)#63 | 20.1%(+9.00)#2,886 |
| 64. | Burlington | 28.9% | 17.2%(+11.7)#64 | 20.1%(+8.80)#2,893 |
| 65. | Iowa City | 28.1% | 17.2%(+10.9)#65 | 20.1%(+8.00)#2,936 |
| 66. | Fort Dodge | 27.8% | 17.2%(+10.6)#66 | 20.1%(+7.70)#2,949 |
| 67. | Marion | 25.8% | 17.2%(+8.60)#67 | 20.1%(+5.70)#3,043 |
| 68. | Davenport | 24.8% | 17.2%(+7.60)#68 | 20.1%(+4.70)#3,088 |
| 69. | Atkins | 22.2% | 17.2%(+5.00)#69 | 20.1%(+2.10)#3,198 |
| 70. | Des Moines | 22.1% | 17.2%(+4.90)#70 | 20.1%(+2.00)#3,201 |
| 71. | Sioux Center | 21.7% | 17.2%(+4.50)#71 | 20.1%(+1.60)#3,219 |
| 72. | Cedar Rapids | 20.3% | 17.2%(+3.10)#72 | 20.1%(+0.200)#3,293 |
| 73. | Ankeny | 14.0% | 17.2%(-3.20)#73 | 20.1%(-6.10)#3,632 |
| 74. | Urbandale | 10.6% | 17.2%(-6.60)#74 | 20.1%(-9.50)#3,812 |
| 75. | Indianola | 10.0% | 17.2%(-7.20)#75 | 20.1%(-10.1)#3,843 |
| 76. | Clear Lake | 9.5% | 17.2%(-7.70)#76 | 20.1%(-10.6)#3,865 |
| 77. | Mason City | 8.2% | 17.2%(-9.00)#77 | 20.1%(-11.9)#3,920 |
| 78. | Ames | 7.1% | 17.2%(-10.1)#78 | 20.1%(-13.0)#3,971 |
| 79. | Coralville | 6.4% | 17.2%(-10.8)#79 | 20.1%(-13.7)#4,007 |
Common Questions
What are the Top 10 Cities with the Highest Percentage of Births to Unmarried Women over the Age of 35 in Iowa?
Top 10 Cities with the Highest Percentage of Births to Unmarried Women over the Age of 35 in Iowa are:
#1
100.0%
#2
100.0%
#3
100.0%
#4
100.0%
#5
100.0%
#6
100.0%
#7
100.0%
#8
100.0%
#9
100.0%
#10
100.0%
What city has the Highest Percentage of Births to Unmarried Women over the Age of 35 in Iowa?
Fort Madison has the Highest Percentage of Births to Unmarried Women over the Age of 35 in Iowa with 100.0%.
What is the Percentage of Births to Unmarried Women over the Age of 35 in the State of Iowa?
Percentage of Births to Unmarried Women over the Age of 35 in Iowa is 17.2%.
What is the Percentage of Births to Unmarried Women over the Age of 35 in the United States?
Percentage of Births to Unmarried Women over the Age of 35 in the United States is 20.1%.