Toppenish, WA Map & Demographics
Toppenish Map
Toppenish Overview
$19,471
PER CAPITA INCOME
$68,083
AVG FAMILY INCOME
$64,327
AVG HOUSEHOLD INCOME
22.3%
WAGE / INCOME GAP [ % ]
77.7¢/ $1
WAGE / INCOME GAP [ $ ]
$10,824
FAMILY INCOME DEFICIT
0.36
INEQUALITY / GINI INDEX
8,820
TOTAL POPULATION
4,639
MALE POPULATION
4,181
FEMALE POPULATION
110.95
MALES / 100 FEMALES
90.13
FEMALES / 100 MALES
28.1
MEDIAN AGE
3.9
AVG FAMILY SIZE
3.6
AVG HOUSEHOLD SIZE
4,245
LABOR FORCE [ PEOPLE ]
66.9%
PERCENT IN LABOR FORCE
8.1%
UNEMPLOYMENT RATE
Toppenish Zip Codes
Toppenish Area Codes
Income in Toppenish
Income Overview in Toppenish
Per Capita Income in Toppenish is $19,471, while median incomes of families and households are $68,083 and $64,327 respectively.
| Characteristic | Number | Measure |
| Per Capita Income | 8,820 | $19,471 |
| Median Family Income | 1,985 | $68,083 |
| Mean Family Income | 1,985 | $74,146 |
| Median Household Income | 2,415 | $64,327 |
| Mean Household Income | 2,415 | $72,607 |
| Income Deficit | 1,985 | $10,824 |
| Wage / Income Gap (%) | 8,820 | 22.27% |
| Wage / Income Gap ($) | 8,820 | 77.73¢ per $1 |
| Gini / Inequality Index | 8,820 | 0.36 |
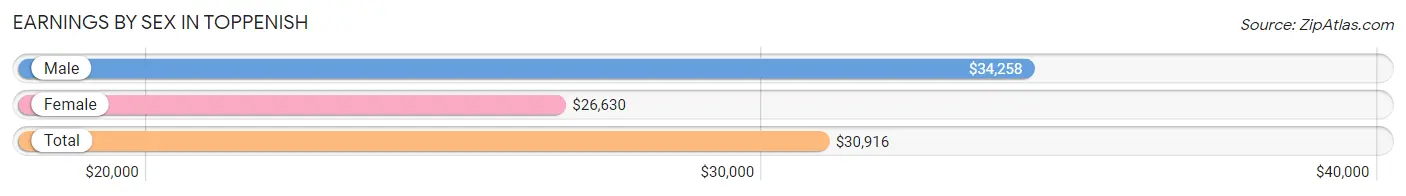
Earnings by Sex in Toppenish
Average Earnings in Toppenish are $30,916, $34,258 for men and $26,630 for women, a difference of 22.3%.
| Sex | Number | Average Earnings |
| Male | 2,531 (58.7%) | $34,258 |
| Female | 1,784 (41.3%) | $26,630 |
| Total | 4,315 (100.0%) | $30,916 |
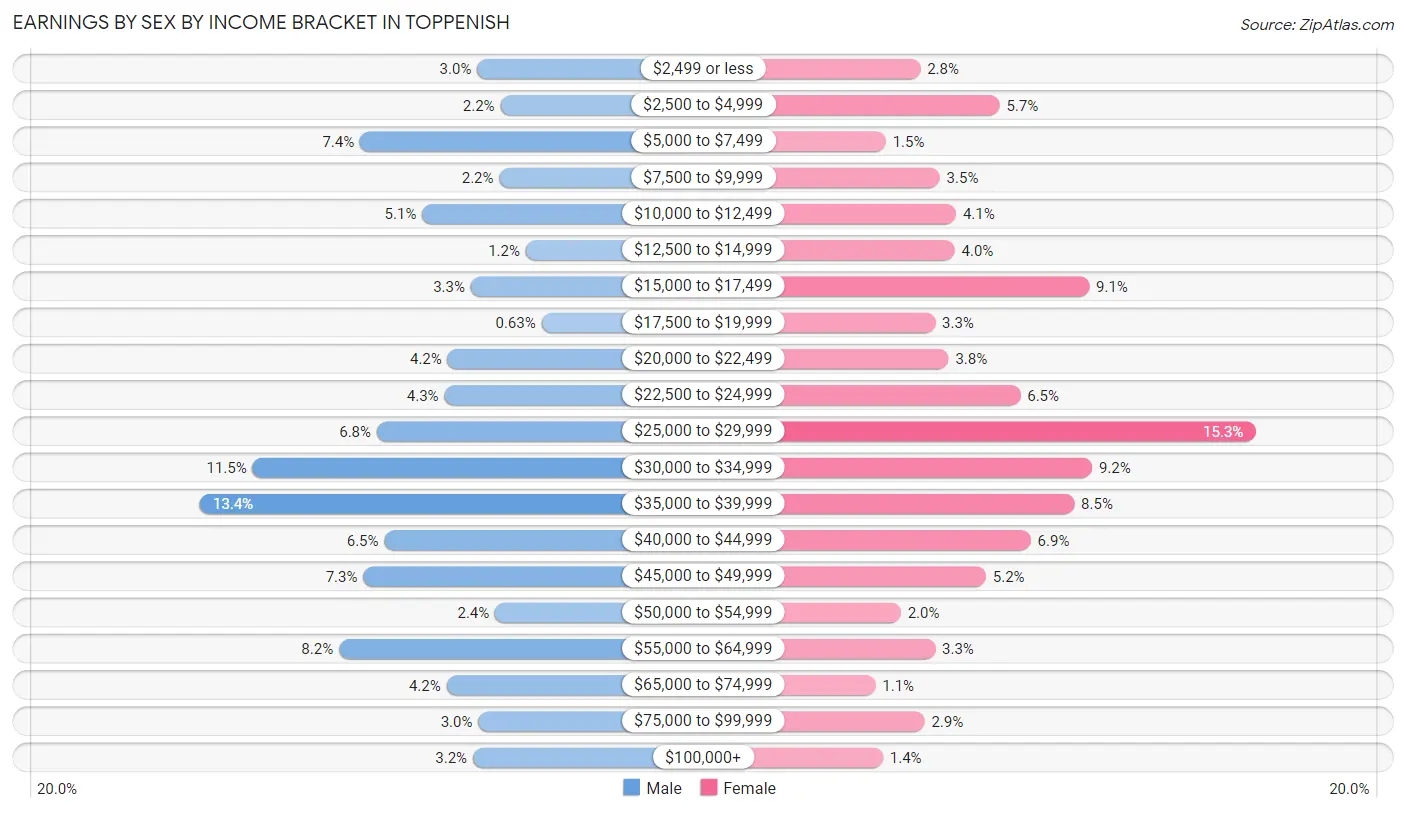
Earnings by Sex by Income Bracket in Toppenish
The most common earnings brackets in Toppenish are $35,000 to $39,999 for men (340 | 13.4%) and $25,000 to $29,999 for women (273 | 15.3%).
| Income | Male | Female |
| $2,499 or less | 77 (3.0%) | 49 (2.8%) |
| $2,500 to $4,999 | 55 (2.2%) | 102 (5.7%) |
| $5,000 to $7,499 | 188 (7.4%) | 26 (1.5%) |
| $7,500 to $9,999 | 56 (2.2%) | 62 (3.5%) |
| $10,000 to $12,499 | 129 (5.1%) | 73 (4.1%) |
| $12,500 to $14,999 | 31 (1.2%) | 72 (4.0%) |
| $15,000 to $17,499 | 83 (3.3%) | 162 (9.1%) |
| $17,500 to $19,999 | 16 (0.6%) | 59 (3.3%) |
| $20,000 to $22,499 | 105 (4.2%) | 68 (3.8%) |
| $22,500 to $24,999 | 108 (4.3%) | 116 (6.5%) |
| $25,000 to $29,999 | 172 (6.8%) | 273 (15.3%) |
| $30,000 to $34,999 | 290 (11.5%) | 164 (9.2%) |
| $35,000 to $39,999 | 340 (13.4%) | 152 (8.5%) |
| $40,000 to $44,999 | 165 (6.5%) | 123 (6.9%) |
| $45,000 to $49,999 | 185 (7.3%) | 93 (5.2%) |
| $50,000 to $54,999 | 60 (2.4%) | 36 (2.0%) |
| $55,000 to $64,999 | 208 (8.2%) | 59 (3.3%) |
| $65,000 to $74,999 | 106 (4.2%) | 19 (1.1%) |
| $75,000 to $99,999 | 76 (3.0%) | 52 (2.9%) |
| $100,000+ | 81 (3.2%) | 24 (1.3%) |
| Total | 2,531 (100.0%) | 1,784 (100.0%) |
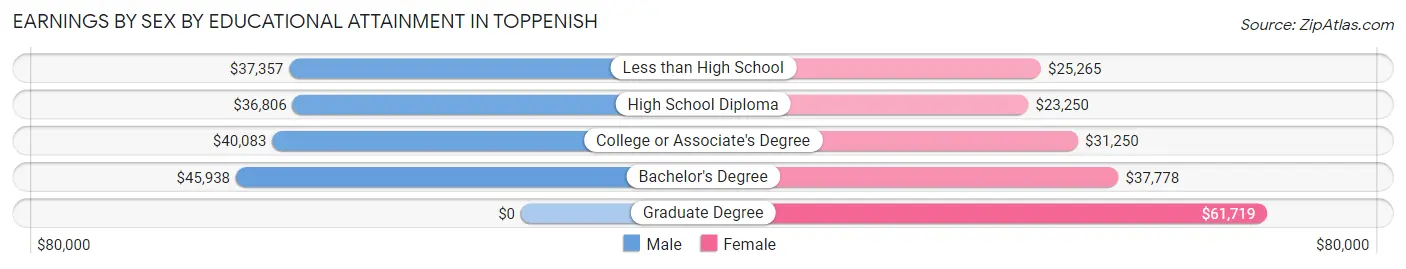
Earnings by Sex by Educational Attainment in Toppenish
Average earnings in Toppenish are $37,745 for men and $28,333 for women, a difference of 24.9%. Men with an educational attainment of bachelor's degree enjoy the highest average annual earnings of $45,938, while those with high school diploma education earn the least with $36,806. Women with an educational attainment of graduate degree earn the most with the average annual earnings of $61,719, while those with high school diploma education have the smallest earnings of $23,250.
| Educational Attainment | Male Income | Female Income |
| Less than High School | $37,357 | $25,265 |
| High School Diploma | $36,806 | $23,250 |
| College or Associate's Degree | $40,083 | $31,250 |
| Bachelor's Degree | $45,938 | $37,778 |
| Graduate Degree | - | - |
| Total | $37,745 | $28,333 |
Family Income in Toppenish
Family Income Brackets in Toppenish
According to the Toppenish family income data, there are 443 families falling into the $75,000 to $99,999 income range, which is the most common income bracket and makes up 22.3% of all families. Conversely, the $200,000+ income bracket is the least frequent group with only 34 families (1.7%) belonging to this category.
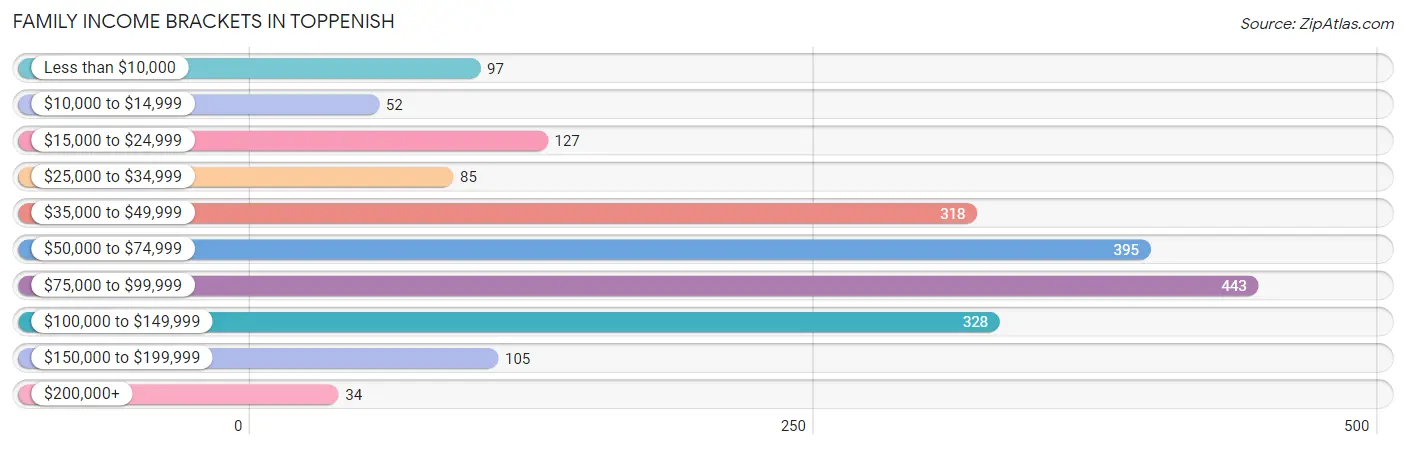
| Income Bracket | # Families | % Families |
| Less than $10,000 | 97 | 4.9% |
| $10,000 to $14,999 | 52 | 2.6% |
| $15,000 to $24,999 | 127 | 6.4% |
| $25,000 to $34,999 | 85 | 4.3% |
| $35,000 to $49,999 | 318 | 16.0% |
| $50,000 to $74,999 | 395 | 19.9% |
| $75,000 to $99,999 | 443 | 22.3% |
| $100,000 to $149,999 | 328 | 16.5% |
| $150,000 to $199,999 | 105 | 5.3% |
| $200,000+ | 34 | 1.7% |
Family Income by Famaliy Size in Toppenish
3-person families (430 | 21.7%) account for the highest median family income in Toppenish with $81,944 per family, while 3-person families (430 | 21.7%) have the highest median income of $27,315 per family member.
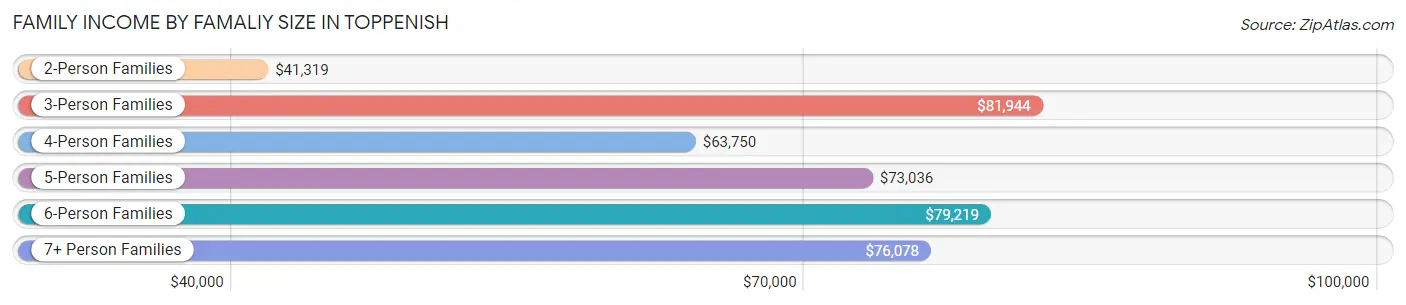
| Income Bracket | # Families | Median Income |
| 2-Person Families | 421 (21.2%) | $41,319 |
| 3-Person Families | 430 (21.7%) | $81,944 |
| 4-Person Families | 406 (20.4%) | $63,750 |
| 5-Person Families | 319 (16.1%) | $73,036 |
| 6-Person Families | 107 (5.4%) | $79,219 |
| 7+ Person Families | 302 (15.2%) | $76,078 |
| Total | 1,985 (100.0%) | $68,083 |
Family Income by Number of Earners in Toppenish
The median family income in Toppenish is $68,083, with families comprising 3+ earners (478) having the highest median family income of $96,100, while families with no earners (211) have the lowest median family income of $14,053, accounting for 24.1% and 10.6% of families, respectively.
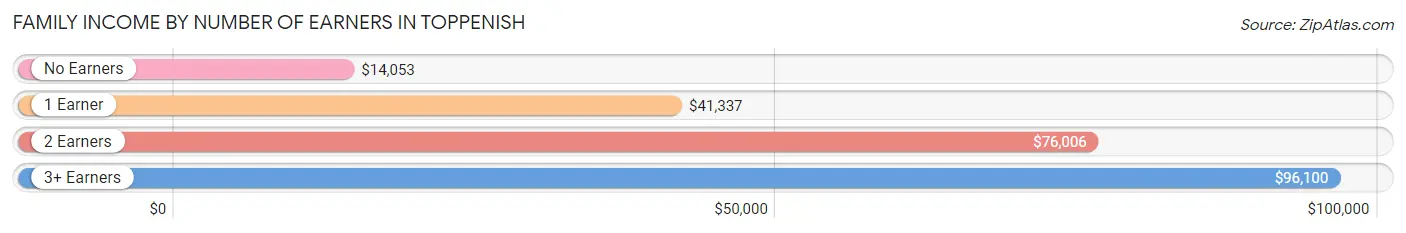
| Number of Earners | # Families | Median Income |
| No Earners | 211 (10.6%) | $14,053 |
| 1 Earner | 454 (22.9%) | $41,337 |
| 2 Earners | 842 (42.4%) | $76,006 |
| 3+ Earners | 478 (24.1%) | $96,100 |
| Total | 1,985 (100.0%) | $68,083 |
Household Income in Toppenish
Household Income Brackets in Toppenish
With 510 households falling in the category, the $75,000 to $99,999 income range is the most frequent in Toppenish, accounting for 21.1% of all households. In contrast, only 34 households (1.4%) fall into the $200,000+ income bracket, making it the least populous group.
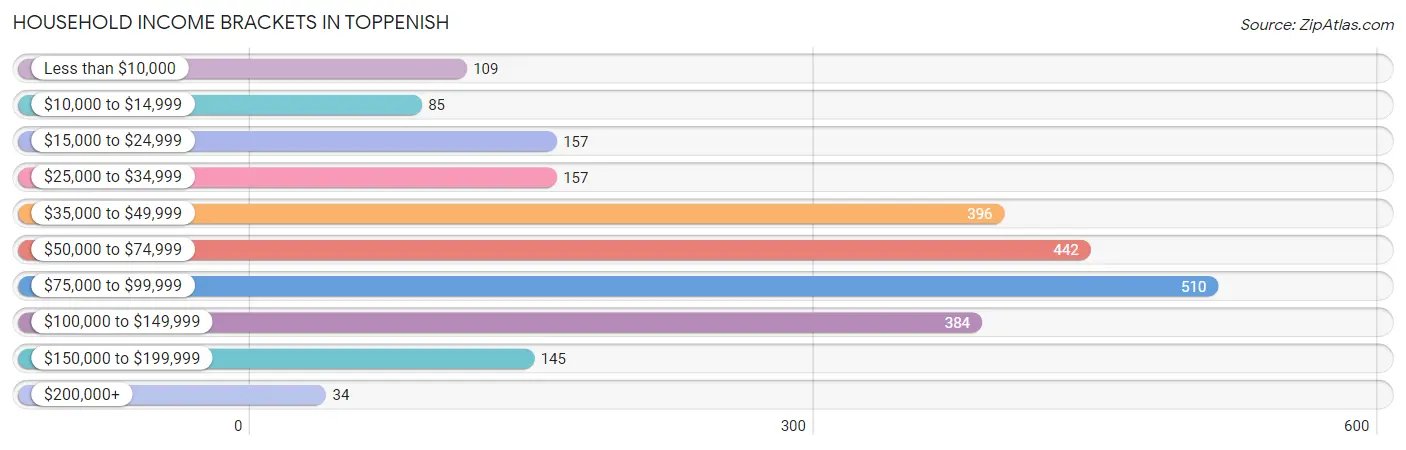
| Income Bracket | # Households | % Households |
| Less than $10,000 | 109 | 4.5% |
| $10,000 to $14,999 | 85 | 3.5% |
| $15,000 to $24,999 | 157 | 6.5% |
| $25,000 to $34,999 | 157 | 6.5% |
| $35,000 to $49,999 | 396 | 16.4% |
| $50,000 to $74,999 | 442 | 18.3% |
| $75,000 to $99,999 | 510 | 21.1% |
| $100,000 to $149,999 | 384 | 15.9% |
| $150,000 to $199,999 | 145 | 6.0% |
| $200,000+ | 34 | 1.4% |
Household Income by Householder Age in Toppenish
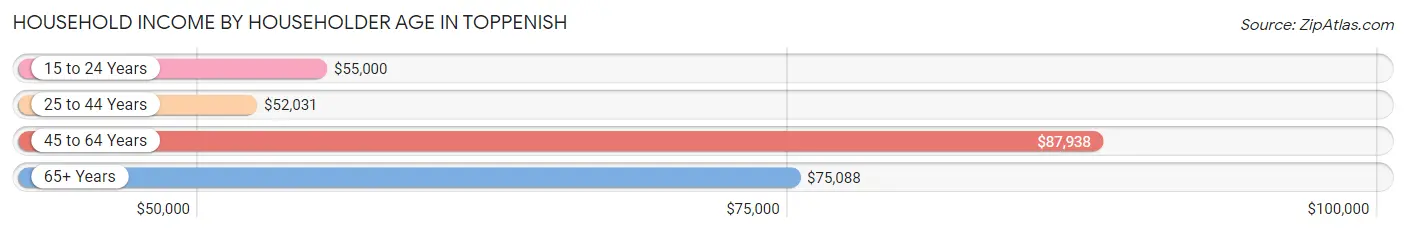
The median household income in Toppenish is $64,327, with the highest median household income of $87,938 found in the 45 to 64 years age bracket for the primary householder. A total of 815 households (33.8%) fall into this category. Meanwhile, the 25 to 44 years age bracket for the primary householder has the lowest median household income of $52,031, with 847 households (35.1%) in this group.
| Income Bracket | # Households | Median Income |
| 15 to 24 Years | 124 (5.1%) | $55,000 |
| 25 to 44 Years | 847 (35.1%) | $52,031 |
| 45 to 64 Years | 815 (33.8%) | $87,938 |
| 65+ Years | 629 (26.1%) | $75,088 |
| Total | 2,415 (100.0%) | $64,327 |
Poverty in Toppenish
Income Below Poverty by Sex and Age in Toppenish
With 13.5% poverty level for males and 20.1% for females among the residents of Toppenish, 75 year old and over males and 5 year old females are the most vulnerable to poverty, with 54 males (77.1%) and 51 females (51.0%) in their respective age groups living below the poverty level.
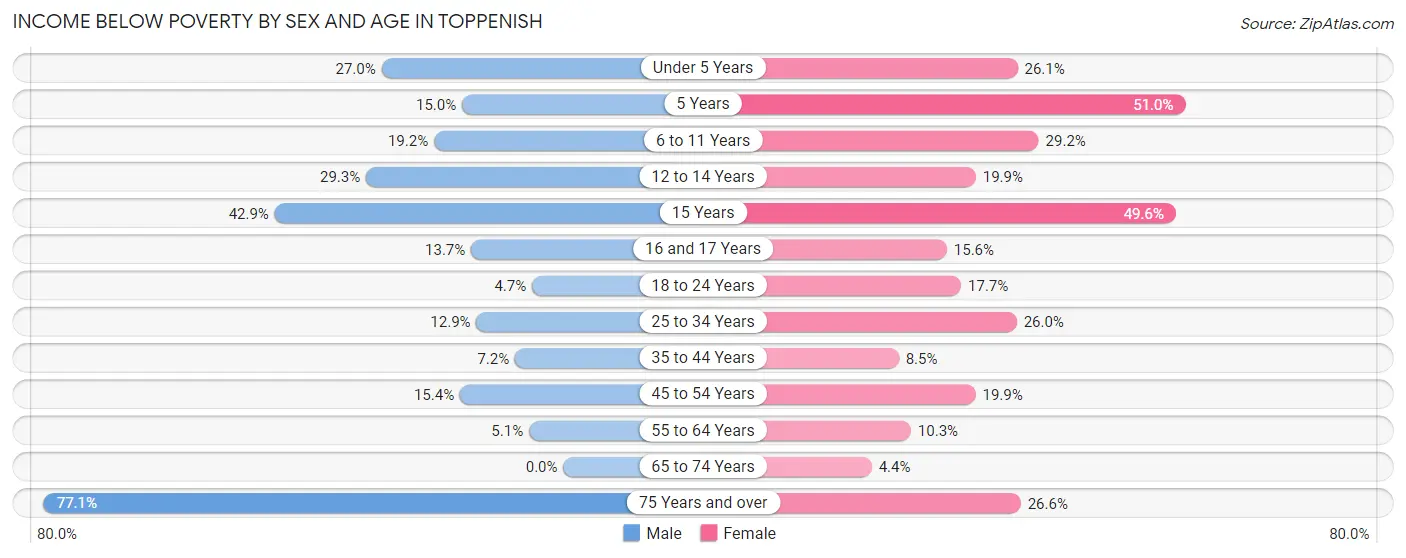
| Age Bracket | Male | Female |
| Under 5 Years | 122 (27.0%) | 95 (26.1%) |
| 5 Years | 17 (15.0%) | 51 (51.0%) |
| 6 to 11 Years | 93 (19.2%) | 114 (29.2%) |
| 12 to 14 Years | 46 (29.3%) | 38 (19.9%) |
| 15 Years | 30 (42.9%) | 59 (49.6%) |
| 16 and 17 Years | 20 (13.7%) | 22 (15.6%) |
| 18 to 24 Years | 29 (4.6%) | 87 (17.7%) |
| 25 to 34 Years | 86 (12.9%) | 140 (26.0%) |
| 35 to 44 Years | 40 (7.2%) | 42 (8.5%) |
| 45 to 54 Years | 66 (15.3%) | 88 (19.9%) |
| 55 to 64 Years | 20 (5.1%) | 35 (10.3%) |
| 65 to 74 Years | 0 (0.0%) | 15 (4.4%) |
| 75 Years and over | 54 (77.1%) | 38 (26.6%) |
| Total | 623 (13.5%) | 824 (20.1%) |
Income Above Poverty by Sex and Age in Toppenish
According to the poverty statistics in Toppenish, males aged 65 to 74 years and females aged 65 to 74 years are the age groups that are most secure financially, with 100.0% of males and 95.6% of females in these age groups living above the poverty line.
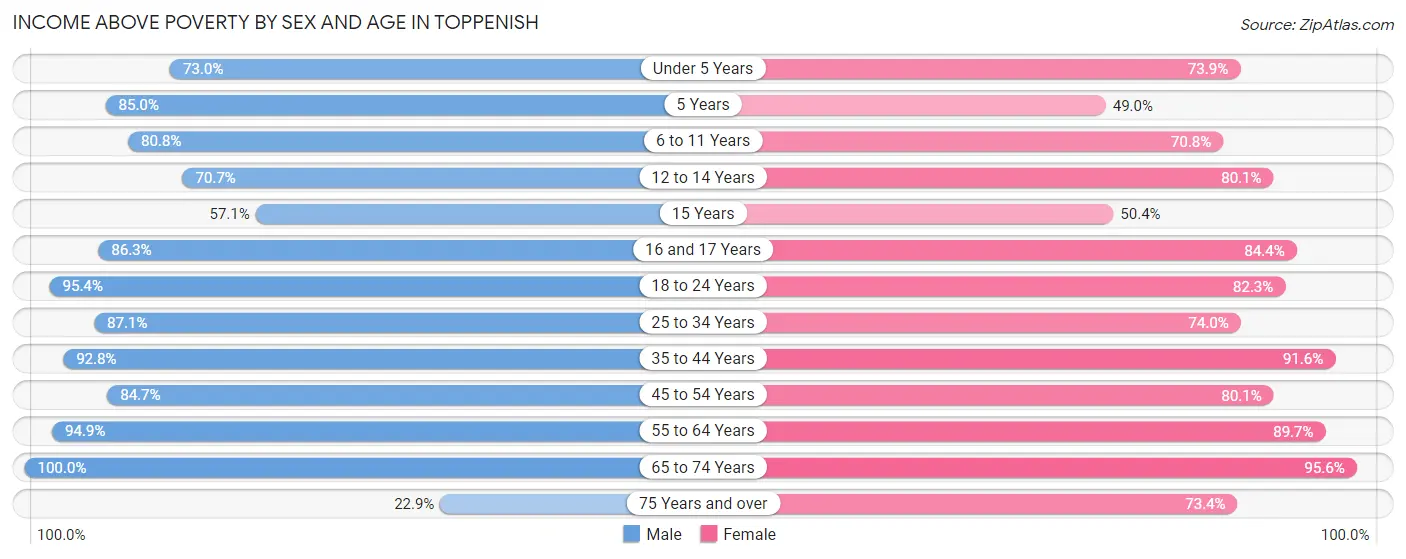
| Age Bracket | Male | Female |
| Under 5 Years | 330 (73.0%) | 269 (73.9%) |
| 5 Years | 96 (85.0%) | 49 (49.0%) |
| 6 to 11 Years | 391 (80.8%) | 276 (70.8%) |
| 12 to 14 Years | 111 (70.7%) | 153 (80.1%) |
| 15 Years | 40 (57.1%) | 60 (50.4%) |
| 16 and 17 Years | 126 (86.3%) | 119 (84.4%) |
| 18 to 24 Years | 594 (95.4%) | 404 (82.3%) |
| 25 to 34 Years | 580 (87.1%) | 399 (74.0%) |
| 35 to 44 Years | 518 (92.8%) | 455 (91.5%) |
| 45 to 54 Years | 364 (84.7%) | 355 (80.1%) |
| 55 to 64 Years | 372 (94.9%) | 306 (89.7%) |
| 65 to 74 Years | 453 (100.0%) | 323 (95.6%) |
| 75 Years and over | 16 (22.9%) | 105 (73.4%) |
| Total | 3,991 (86.5%) | 3,273 (79.9%) |
Income Below Poverty Among Married-Couple Families in Toppenish
The poverty statistics for married-couple families in Toppenish show that 9.4% or 124 of the total 1,320 families live below the poverty line. Families with 5 or more children have the highest poverty rate of 64.1%, comprising of 34 families. On the other hand, families with 3 or 4 children have the lowest poverty rate of 4.3%, which includes 17 families.
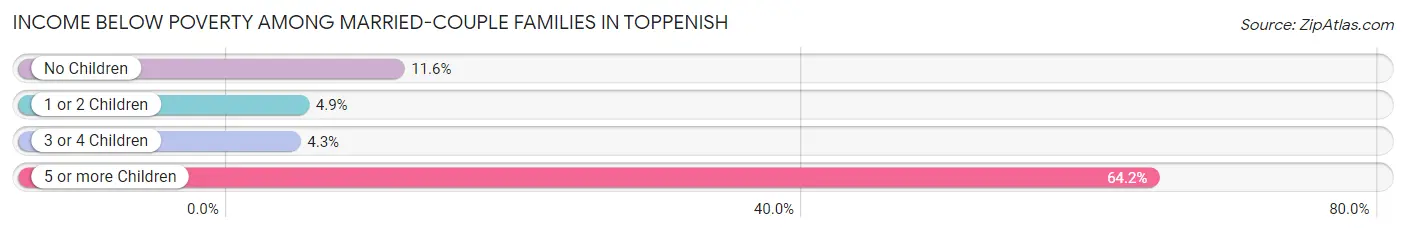
| Children | Above Poverty | Below Poverty |
| No Children | 397 (88.4%) | 52 (11.6%) |
| 1 or 2 Children | 405 (95.1%) | 21 (4.9%) |
| 3 or 4 Children | 375 (95.7%) | 17 (4.3%) |
| 5 or more Children | 19 (35.8%) | 34 (64.1%) |
| Total | 1,196 (90.6%) | 124 (9.4%) |
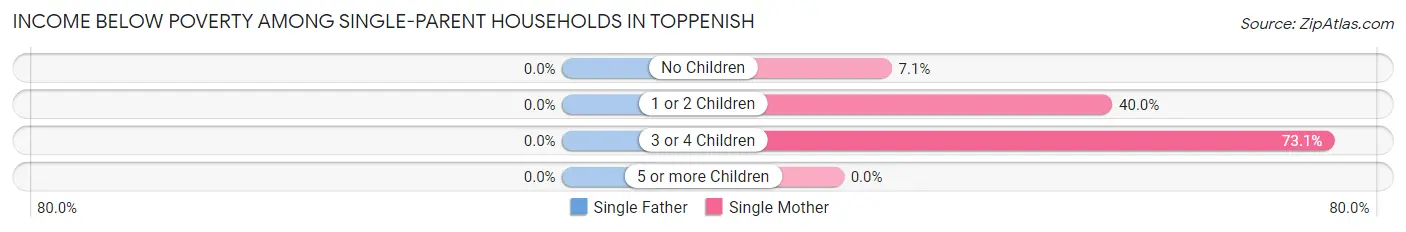
Income Below Poverty Among Single-Parent Households in Toppenish
| Children | Single Father | Single Mother |
| No Children | 0 (0.0%) | 9 (7.1%) |
| 1 or 2 Children | 0 (0.0%) | 92 (40.0%) |
| 3 or 4 Children | 0 (0.0%) | 76 (73.1%) |
| 5 or more Children | 0 (0.0%) | 0 (0.0%) |
| Total | 0 (0.0%) | 177 (38.3%) |
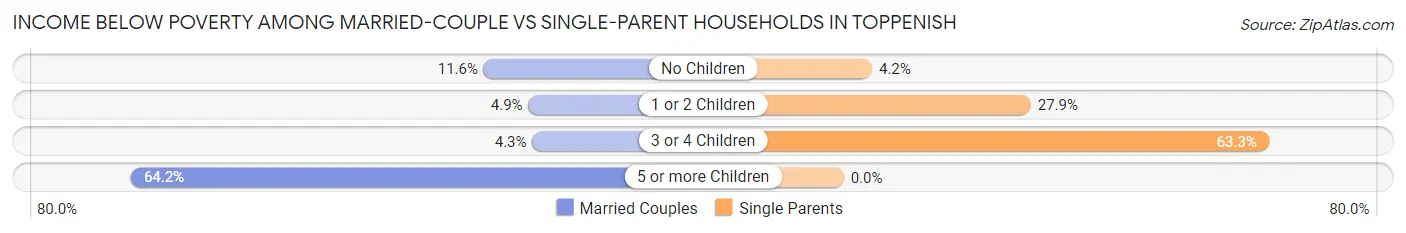
Income Below Poverty Among Married-Couple vs Single-Parent Households in Toppenish
The poverty data for Toppenish shows that 124 of the married-couple family households (9.4%) and 177 of the single-parent households (26.6%) are living below the poverty level. Within the married-couple family households, those with 5 or more children have the highest poverty rate, with 34 households (64.1%) falling below the poverty line. Among the single-parent households, those with 3 or 4 children have the highest poverty rate, with 76 household (63.3%) living below poverty.
| Children | Married-Couple Families | Single-Parent Households |
| No Children | 52 (11.6%) | 9 (4.2%) |
| 1 or 2 Children | 21 (4.9%) | 92 (27.9%) |
| 3 or 4 Children | 17 (4.3%) | 76 (63.3%) |
| 5 or more Children | 34 (64.1%) | 0 (0.0%) |
| Total | 124 (9.4%) | 177 (26.6%) |
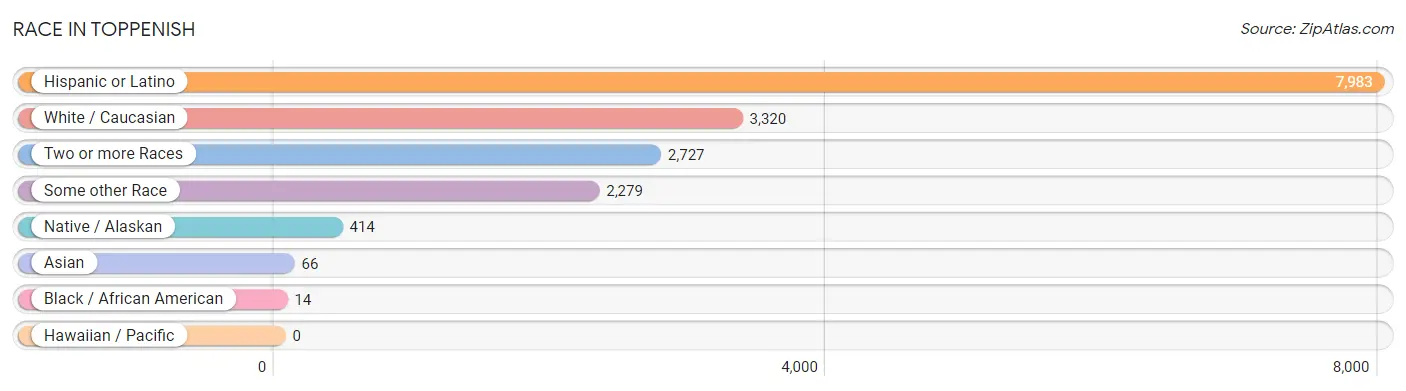
Race in Toppenish
The most populous races in Toppenish are Hispanic or Latino (7,983 | 90.5%), White / Caucasian (3,320 | 37.6%), and Two or more Races (2,727 | 30.9%).
| Race | # Population | % Population |
| Asian | 66 | 0.7% |
| Black / African American | 14 | 0.2% |
| Hawaiian / Pacific | 0 | 0.0% |
| Hispanic or Latino | 7,983 | 90.5% |
| Native / Alaskan | 414 | 4.7% |
| White / Caucasian | 3,320 | 37.6% |
| Two or more Races | 2,727 | 30.9% |
| Some other Race | 2,279 | 25.8% |
| Total | 8,820 | 100.0% |
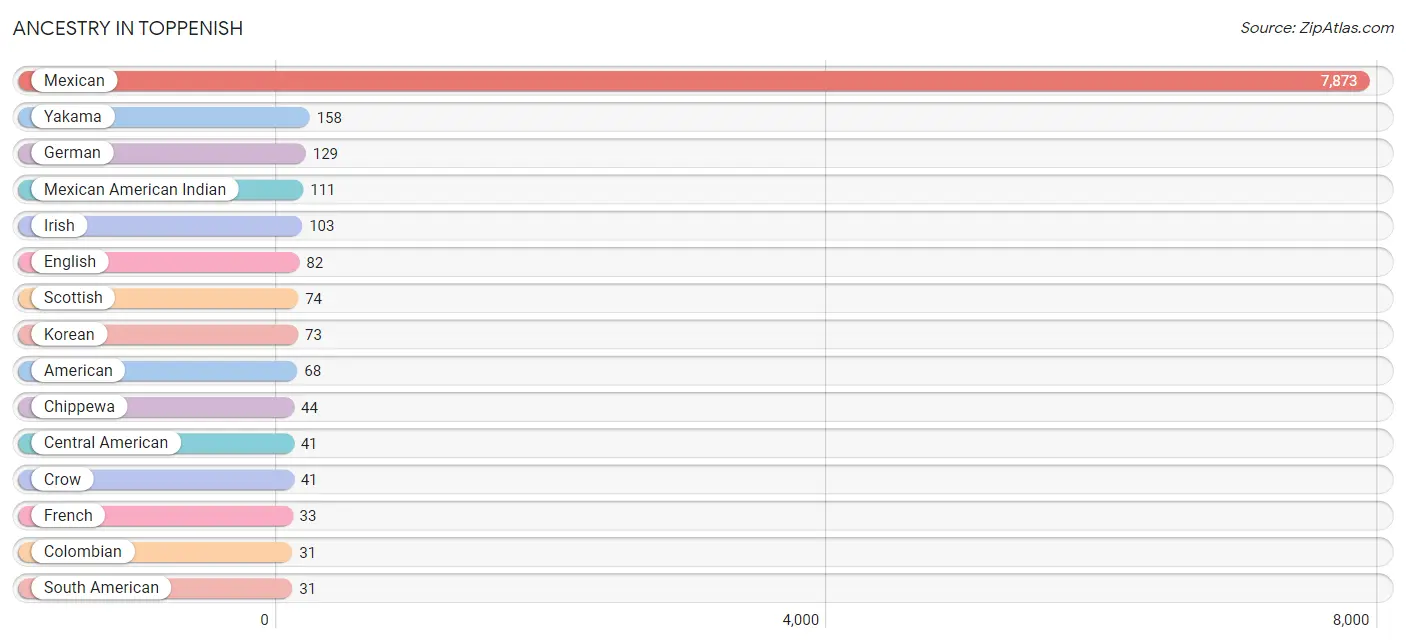
Ancestry in Toppenish
The most populous ancestries reported in Toppenish are Mexican (7,873 | 89.3%), Yakama (158 | 1.8%), German (129 | 1.5%), Mexican American Indian (111 | 1.3%), and Irish (103 | 1.2%), together accounting for 94.9% of all Toppenish residents.
| Ancestry | # Population | % Population |
| American | 68 | 0.8% |
| Armenian | 7 | 0.1% |
| Austrian | 8 | 0.1% |
| Bhutanese | 9 | 0.1% |
| Blackfeet | 8 | 0.1% |
| Burmese | 18 | 0.2% |
| Canadian | 5 | 0.1% |
| Central American | 41 | 0.5% |
| Central American Indian | 22 | 0.3% |
| Chippewa | 44 | 0.5% |
| Colombian | 31 | 0.4% |
| Colville | 8 | 0.1% |
| Crow | 41 | 0.5% |
| Czech | 7 | 0.1% |
| Danish | 6 | 0.1% |
| Dutch | 30 | 0.3% |
| Eastern European | 5 | 0.1% |
| English | 82 | 0.9% |
| European | 22 | 0.3% |
| French | 33 | 0.4% |
| German | 129 | 1.5% |
| Guatemalan | 22 | 0.3% |
| Honduran | 19 | 0.2% |
| Indian (Asian) | 19 | 0.2% |
| Irish | 103 | 1.2% |
| Italian | 22 | 0.3% |
| Korean | 73 | 0.8% |
| Mexican | 7,873 | 89.3% |
| Mexican American Indian | 111 | 1.3% |
| Native Hawaiian | 19 | 0.2% |
| Norwegian | 6 | 0.1% |
| Pennsylvania German | 12 | 0.1% |
| Puerto Rican | 17 | 0.2% |
| Russian | 6 | 0.1% |
| Scottish | 74 | 0.8% |
| Sioux | 3 | 0.0% |
| South American | 31 | 0.4% |
| Spanish | 1 | 0.0% |
| Sri Lankan | 19 | 0.2% |
| Swedish | 12 | 0.1% |
| Ute | 16 | 0.2% |
| Welsh | 12 | 0.1% |
| Yakama | 158 | 1.8% | View All 43 Rows |
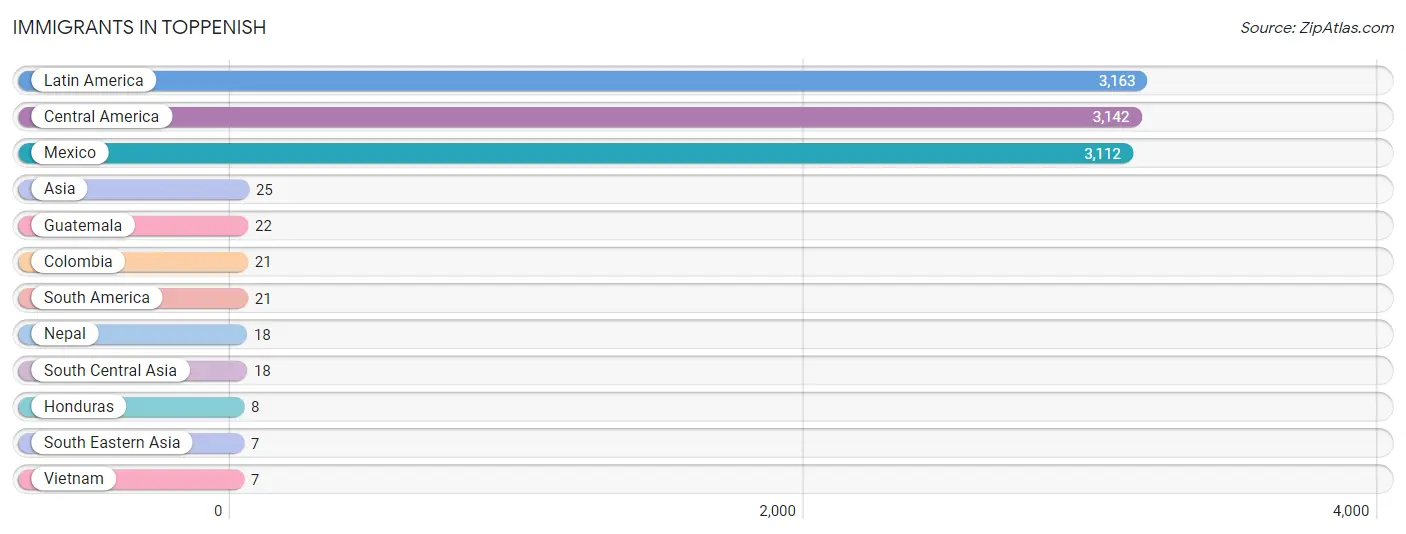
Immigrants in Toppenish
The most numerous immigrant groups reported in Toppenish came from Latin America (3,163 | 35.9%), Central America (3,142 | 35.6%), Mexico (3,112 | 35.3%), Asia (25 | 0.3%), and Guatemala (22 | 0.3%), together accounting for 107.3% of all Toppenish residents.
| Immigration Origin | # Population | % Population |
| Asia | 25 | 0.3% |
| Central America | 3,142 | 35.6% |
| Colombia | 21 | 0.2% |
| Guatemala | 22 | 0.3% |
| Honduras | 8 | 0.1% |
| Latin America | 3,163 | 35.9% |
| Mexico | 3,112 | 35.3% |
| Nepal | 18 | 0.2% |
| South America | 21 | 0.2% |
| South Central Asia | 18 | 0.2% |
| South Eastern Asia | 7 | 0.1% |
| Vietnam | 7 | 0.1% | View All 12 Rows |
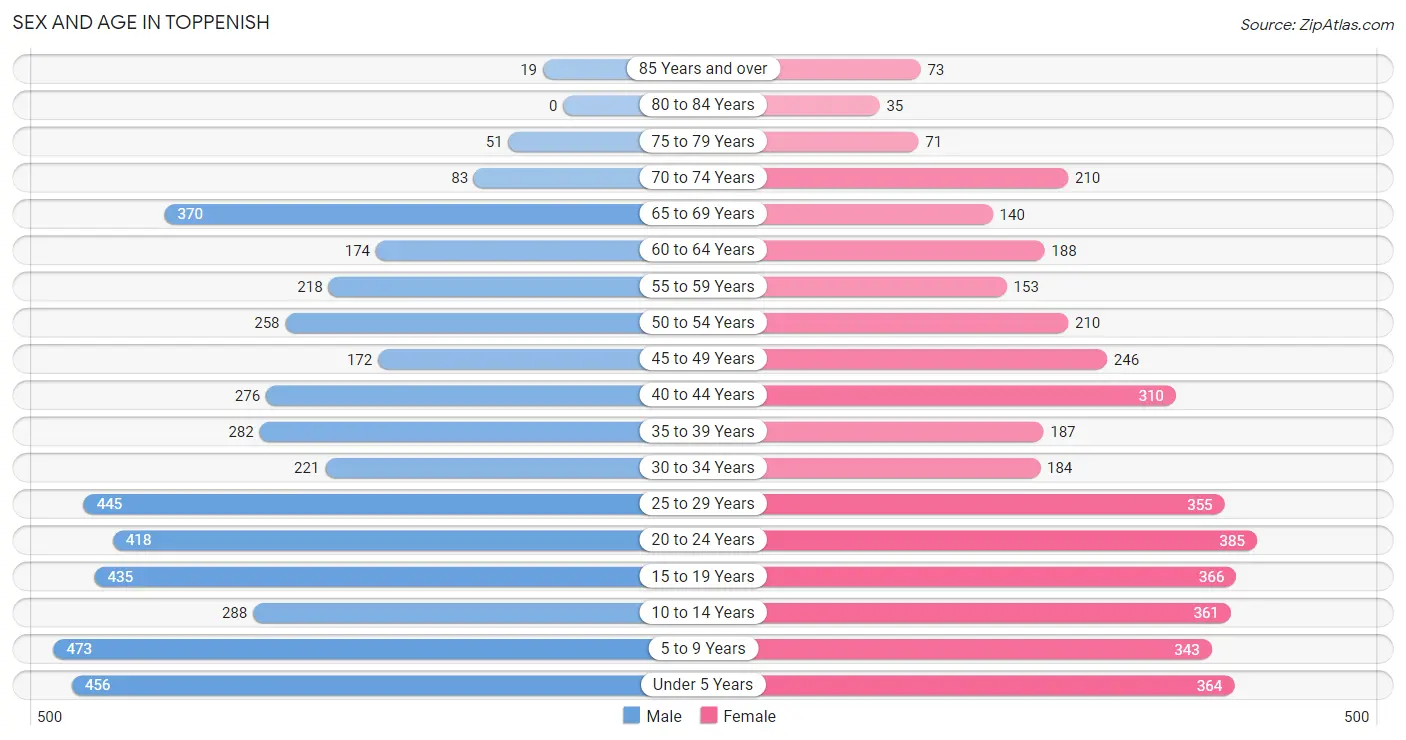
Sex and Age in Toppenish
Sex and Age in Toppenish
The most populous age groups in Toppenish are 5 to 9 Years (473 | 10.2%) for men and 20 to 24 Years (385 | 9.2%) for women.
| Age Bracket | Male | Female |
| Under 5 Years | 456 (9.8%) | 364 (8.7%) |
| 5 to 9 Years | 473 (10.2%) | 343 (8.2%) |
| 10 to 14 Years | 288 (6.2%) | 361 (8.6%) |
| 15 to 19 Years | 435 (9.4%) | 366 (8.7%) |
| 20 to 24 Years | 418 (9.0%) | 385 (9.2%) |
| 25 to 29 Years | 445 (9.6%) | 355 (8.5%) |
| 30 to 34 Years | 221 (4.8%) | 184 (4.4%) |
| 35 to 39 Years | 282 (6.1%) | 187 (4.5%) |
| 40 to 44 Years | 276 (5.9%) | 310 (7.4%) |
| 45 to 49 Years | 172 (3.7%) | 246 (5.9%) |
| 50 to 54 Years | 258 (5.6%) | 210 (5.0%) |
| 55 to 59 Years | 218 (4.7%) | 153 (3.7%) |
| 60 to 64 Years | 174 (3.7%) | 188 (4.5%) |
| 65 to 69 Years | 370 (8.0%) | 140 (3.4%) |
| 70 to 74 Years | 83 (1.8%) | 210 (5.0%) |
| 75 to 79 Years | 51 (1.1%) | 71 (1.7%) |
| 80 to 84 Years | 0 (0.0%) | 35 (0.8%) |
| 85 Years and over | 19 (0.4%) | 73 (1.8%) |
| Total | 4,639 (100.0%) | 4,181 (100.0%) |
Families and Households in Toppenish
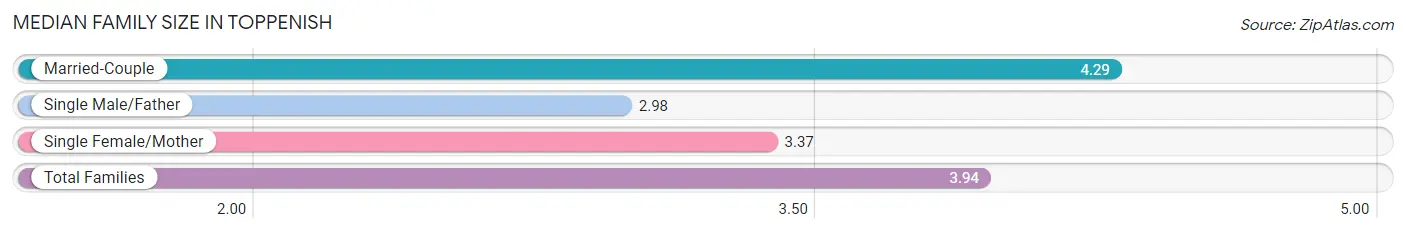
Median Family Size in Toppenish
The median family size in Toppenish is 3.94 persons per family, with married-couple families (1,320 | 66.5%) accounting for the largest median family size of 4.29 persons per family. On the other hand, single male/father families (203 | 10.2%) represent the smallest median family size with 2.98 persons per family.
| Family Type | # Families | Family Size |
| Married-Couple | 1,320 (66.5%) | 4.29 |
| Single Male/Father | 203 (10.2%) | 2.98 |
| Single Female/Mother | 462 (23.3%) | 3.37 |
| Total Families | 1,985 (100.0%) | 3.94 |
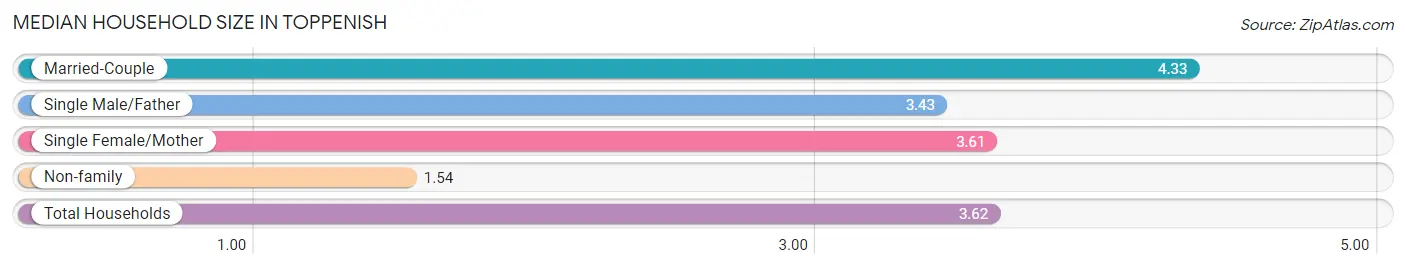
Median Household Size in Toppenish
The median household size in Toppenish is 3.62 persons per household, with married-couple households (1,320 | 54.7%) accounting for the largest median household size of 4.33 persons per household. non-family households (430 | 17.8%) represent the smallest median household size with 1.54 persons per household.
| Household Type | # Households | Household Size |
| Married-Couple | 1,320 (54.7%) | 4.33 |
| Single Male/Father | 203 (8.4%) | 3.43 |
| Single Female/Mother | 462 (19.1%) | 3.61 |
| Non-family | 430 (17.8%) | 1.54 |
| Total Households | 2,415 (100.0%) | 3.62 |
Household Size by Marriage Status in Toppenish
Out of a total of 2,415 households in Toppenish, 1,985 (82.2%) are family households, while 430 (17.8%) are nonfamily households. The most numerous type of family households are 3-person households, comprising 422, and the most common type of nonfamily households are 1-person households, comprising 288.
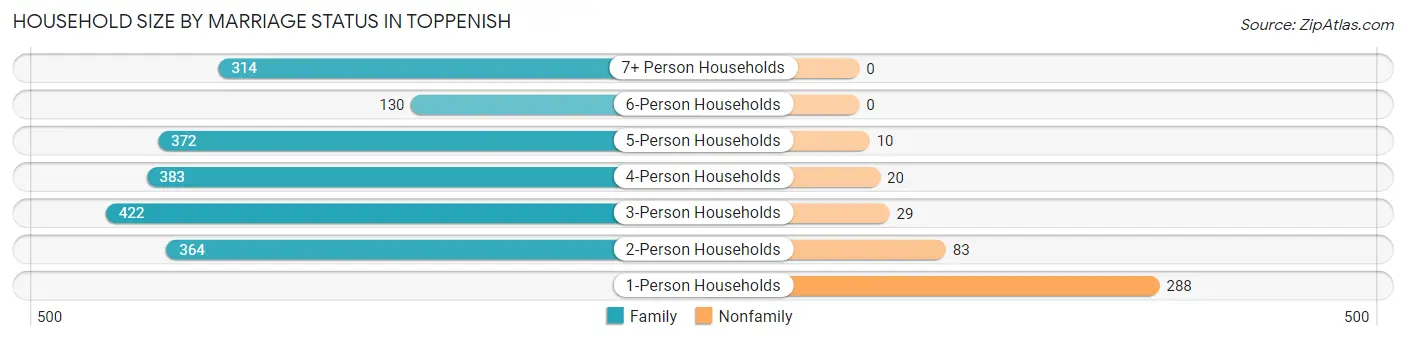
| Household Size | Family Households | Nonfamily Households |
| 1-Person Households | - | 288 (11.9%) |
| 2-Person Households | 364 (15.1%) | 83 (3.4%) |
| 3-Person Households | 422 (17.5%) | 29 (1.2%) |
| 4-Person Households | 383 (15.9%) | 20 (0.8%) |
| 5-Person Households | 372 (15.4%) | 10 (0.4%) |
| 6-Person Households | 130 (5.4%) | 0 (0.0%) |
| 7+ Person Households | 314 (13.0%) | 0 (0.0%) |
| Total | 1,985 (82.2%) | 430 (17.8%) |
Female Fertility in Toppenish
Fertility by Age in Toppenish
Average fertility rate in Toppenish is 57.0 births per 1,000 women. Women in the age bracket of 20 to 34 years have the highest fertility rate with 113.0 births per 1,000 women. Women in the age bracket of 20 to 34 years acount for 88.1% of all women with births.
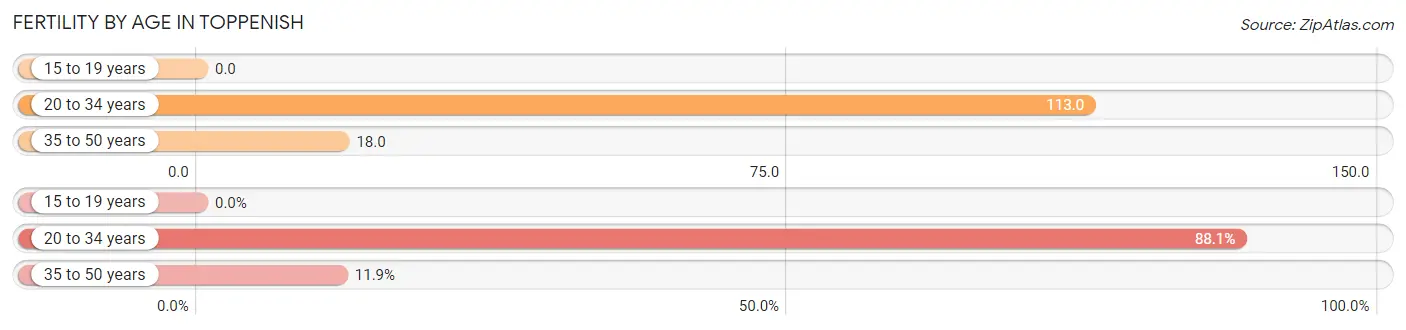
| Age Bracket | Women with Births | Births / 1,000 Women |
| 15 to 19 years | 0 (0.0%) | 0.0 |
| 20 to 34 years | 104 (88.1%) | 113.0 |
| 35 to 50 years | 14 (11.9%) | 18.0 |
| Total | 118 (100.0%) | 57.0 |
Fertility by Age by Marriage Status in Toppenish
66.9% of women with births (118) in Toppenish are married. The highest percentage of unmarried women with births falls into 20 to 34 years age bracket with 34.6% of them unmarried at the time of birth, while the lowest percentage of unmarried women with births belong to 35 to 50 years age bracket with 21.4% of them unmarried.
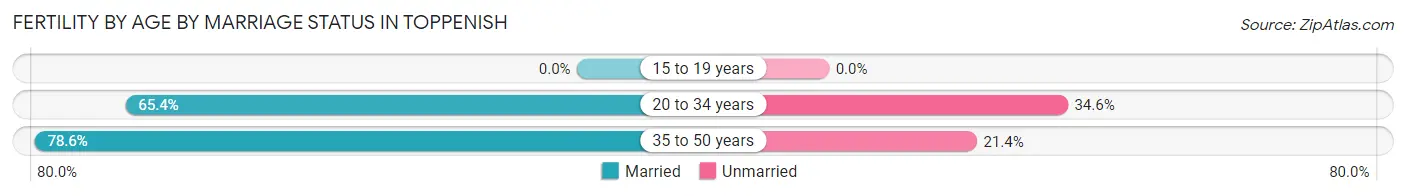
| Age Bracket | Married | Unmarried |
| 15 to 19 years | 0 (0.0%) | 0 (0.0%) |
| 20 to 34 years | 68 (65.4%) | 36 (34.6%) |
| 35 to 50 years | 11 (78.6%) | 3 (21.4%) |
| Total | 79 (66.9%) | 39 (33.1%) |
Fertility by Education in Toppenish
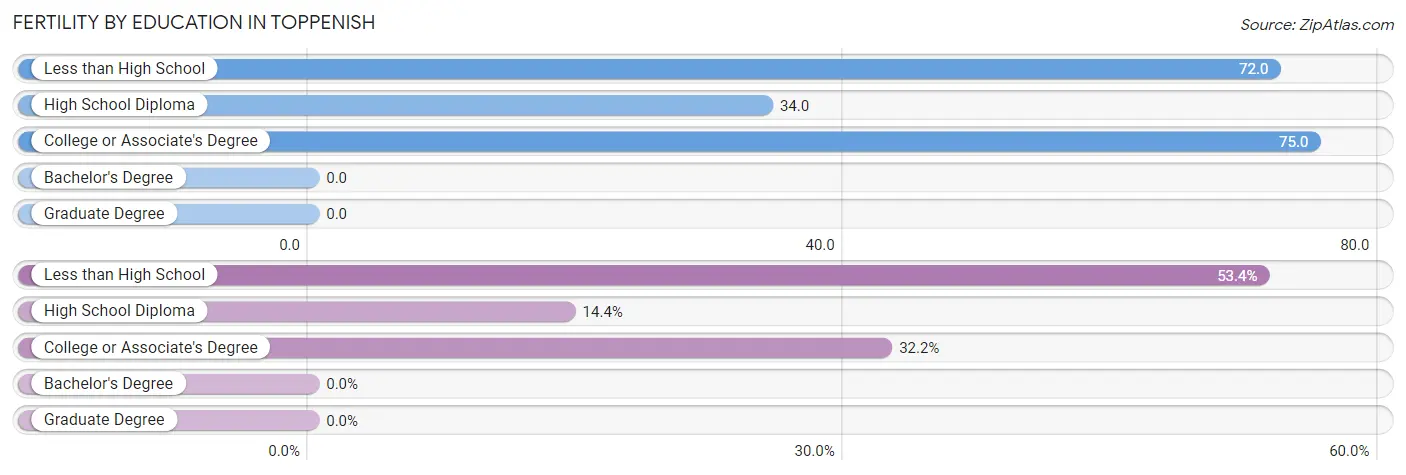
| Educational Attainment | Women with Births | Births / 1,000 Women |
| Less than High School | 63 (53.4%) | 72.0 |
| High School Diploma | 17 (14.4%) | 34.0 |
| College or Associate's Degree | 38 (32.2%) | 75.0 |
| Bachelor's Degree | 0 (0.0%) | 0.0 |
| Graduate Degree | 0 (0.0%) | 0.0 |
| Total | 118 (100.0%) | 57.0 |
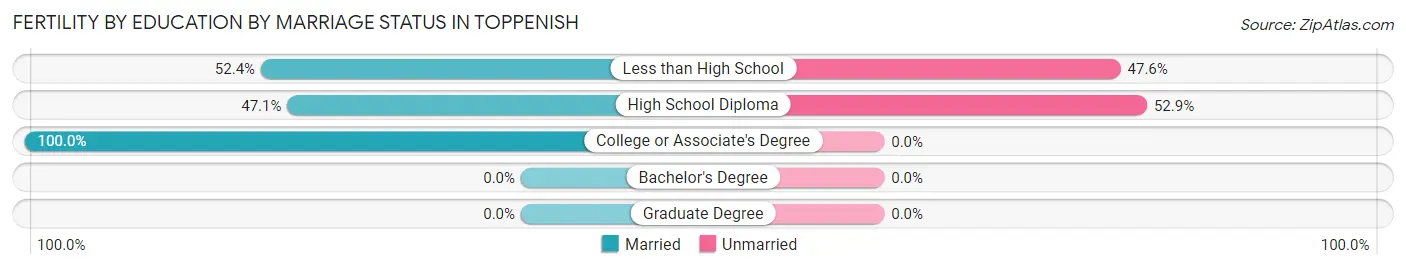
Fertility by Education by Marriage Status in Toppenish
33.1% of women with births in Toppenish are unmarried. Women with the educational attainment of college or associate's degree are most likely to be married with 100.0% of them married at childbirth, while women with the educational attainment of high school diploma are least likely to be married with 52.9% of them unmarried at childbirth.
| Educational Attainment | Married | Unmarried |
| Less than High School | 33 (52.4%) | 30 (47.6%) |
| High School Diploma | 8 (47.1%) | 9 (52.9%) |
| College or Associate's Degree | 38 (100.0%) | 0 (0.0%) |
| Bachelor's Degree | 0 (0.0%) | 0 (0.0%) |
| Graduate Degree | 0 (0.0%) | 0 (0.0%) |
| Total | 79 (66.9%) | 39 (33.1%) |
Employment Characteristics in Toppenish
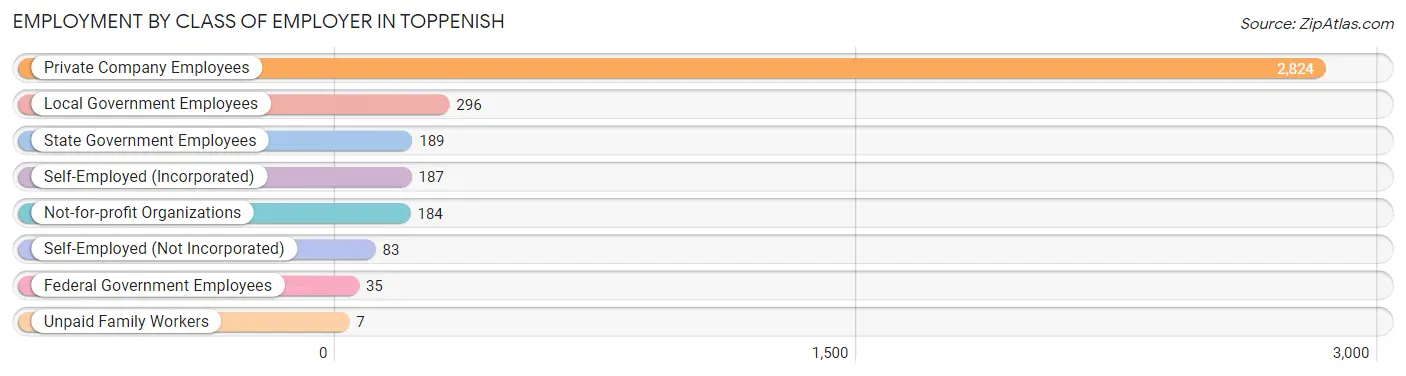
Employment by Class of Employer in Toppenish
Among the 3,805 employed individuals in Toppenish, private company employees (2,824 | 74.2%), local government employees (296 | 7.8%), and state government employees (189 | 5.0%) make up the most common classes of employment.
| Employer Class | # Employees | % Employees |
| Private Company Employees | 2,824 | 74.2% |
| Self-Employed (Incorporated) | 187 | 4.9% |
| Self-Employed (Not Incorporated) | 83 | 2.2% |
| Not-for-profit Organizations | 184 | 4.8% |
| Local Government Employees | 296 | 7.8% |
| State Government Employees | 189 | 5.0% |
| Federal Government Employees | 35 | 0.9% |
| Unpaid Family Workers | 7 | 0.2% |
| Total | 3,805 | 100.0% |
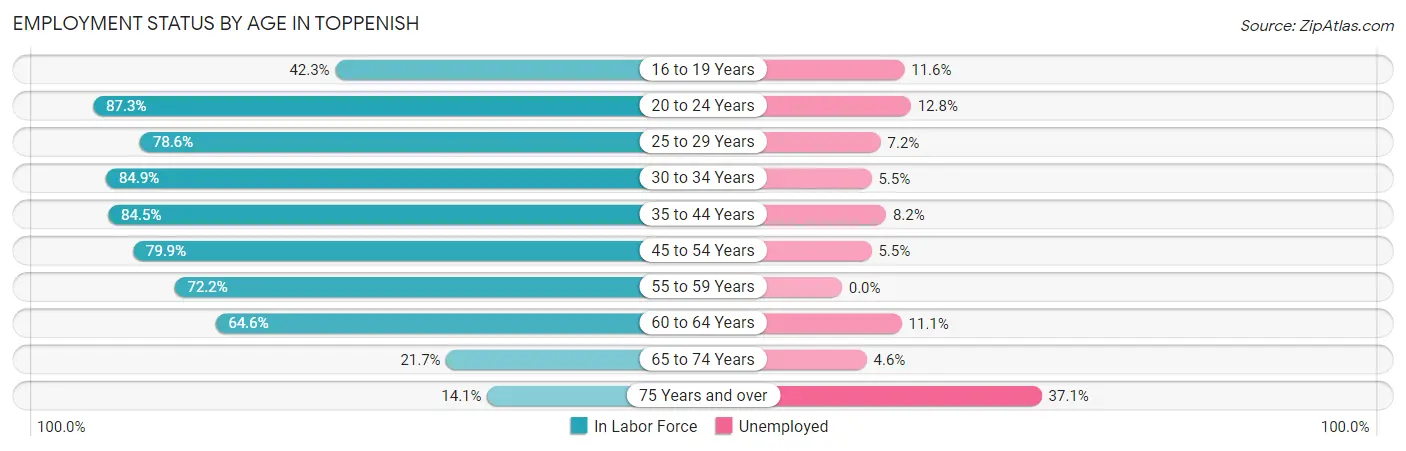
Employment Status by Age in Toppenish
According to the labor force statistics for Toppenish, out of the total population over 16 years of age (6,346), 66.9% or 4,245 individuals are in the labor force, with 8.1% or 344 of them unemployed. The age group with the highest labor force participation rate is 20 to 24 years, with 87.3% or 701 individuals in the labor force. Within the labor force, the 75 years and over age range has the highest percentage of unemployed individuals, with 37.1% or 13 of them being unemployed.
| Age Bracket | In Labor Force | Unemployed |
| 16 to 19 Years | 259 (42.3%) | 30 (11.6%) |
| 20 to 24 Years | 701 (87.3%) | 90 (12.8%) |
| 25 to 29 Years | 629 (78.6%) | 45 (7.2%) |
| 30 to 34 Years | 344 (84.9%) | 19 (5.5%) |
| 35 to 44 Years | 891 (84.5%) | 73 (8.2%) |
| 45 to 54 Years | 708 (79.9%) | 39 (5.5%) |
| 55 to 59 Years | 268 (72.2%) | 0 (0.0%) |
| 60 to 64 Years | 234 (64.6%) | 26 (11.1%) |
| 65 to 74 Years | 174 (21.7%) | 8 (4.6%) |
| 75 Years and over | 35 (14.1%) | 13 (37.1%) |
| Total | 4,245 (66.9%) | 344 (8.1%) |
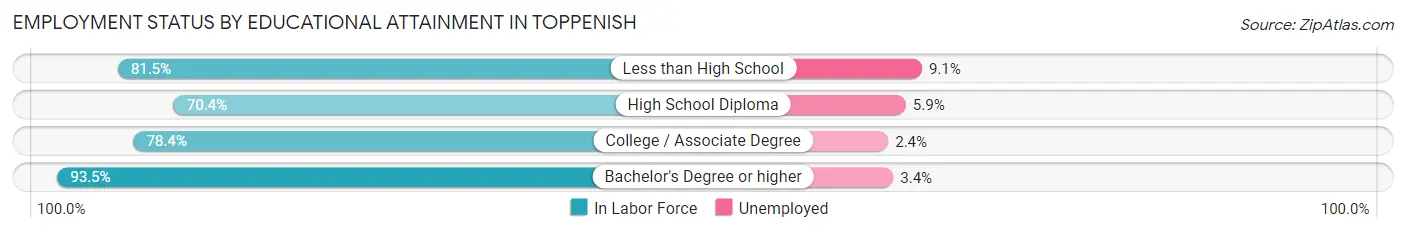
Employment Status by Educational Attainment in Toppenish
According to labor force statistics for Toppenish, 79.2% of individuals (3,072) out of the total population between 25 and 64 years of age (3,879) are in the labor force, with 6.6% or 203 of them being unemployed. The group with the highest labor force participation rate are those with the educational attainment of bachelor's degree or higher, with 93.5% or 319 individuals in the labor force. Within the labor force, individuals with less than high school education have the highest percentage of unemployment, with 9.1% or 136 of them being unemployed.
| Educational Attainment | In Labor Force | Unemployed |
| Less than High School | 1,499 (81.5%) | 167 (9.1%) |
| High School Diploma | 674 (70.4%) | 56 (5.9%) |
| College / Associate Degree | 582 (78.4%) | 18 (2.4%) |
| Bachelor's Degree or higher | 319 (93.5%) | 12 (3.4%) |
| Total | 3,072 (79.2%) | 256 (6.6%) |
Employment Occupations by Sex in Toppenish
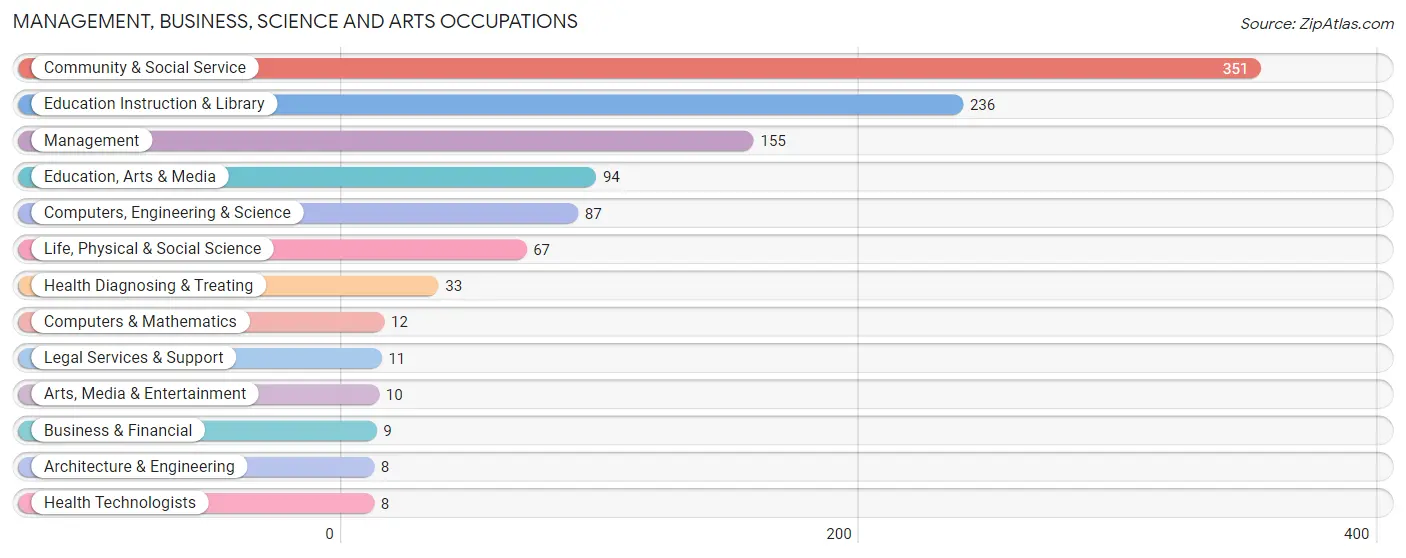
Management, Business, Science and Arts Occupations
The most common Management, Business, Science and Arts occupations in Toppenish are Community & Social Service (351 | 9.0%), Education Instruction & Library (236 | 6.0%), Management (155 | 4.0%), Education, Arts & Media (94 | 2.4%), and Computers, Engineering & Science (87 | 2.2%).
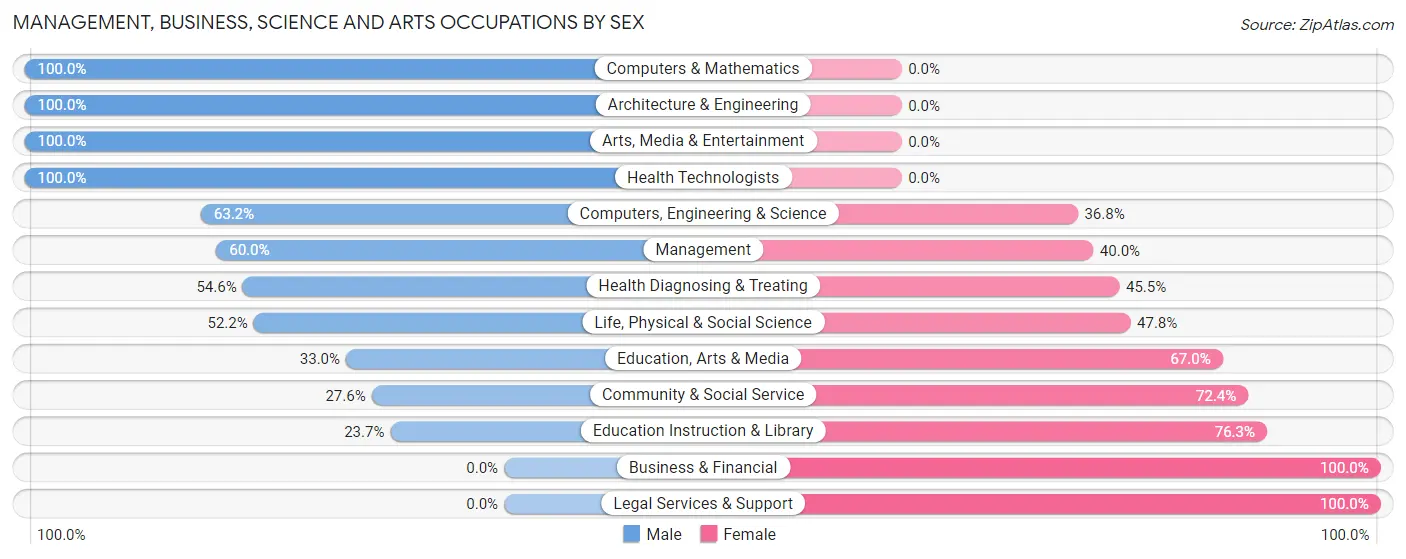
Management, Business, Science and Arts Occupations by Sex
Within the Management, Business, Science and Arts occupations in Toppenish, the most male-oriented occupations are Computers & Mathematics (100.0%), Architecture & Engineering (100.0%), and Arts, Media & Entertainment (100.0%), while the most female-oriented occupations are Business & Financial (100.0%), Legal Services & Support (100.0%), and Education Instruction & Library (76.3%).
| Occupation | Male | Female |
| Management | 93 (60.0%) | 62 (40.0%) |
| Business & Financial | 0 (0.0%) | 9 (100.0%) |
| Computers, Engineering & Science | 55 (63.2%) | 32 (36.8%) |
| Computers & Mathematics | 12 (100.0%) | 0 (0.0%) |
| Architecture & Engineering | 8 (100.0%) | 0 (0.0%) |
| Life, Physical & Social Science | 35 (52.2%) | 32 (47.8%) |
| Community & Social Service | 97 (27.6%) | 254 (72.4%) |
| Education, Arts & Media | 31 (33.0%) | 63 (67.0%) |
| Legal Services & Support | 0 (0.0%) | 11 (100.0%) |
| Education Instruction & Library | 56 (23.7%) | 180 (76.3%) |
| Arts, Media & Entertainment | 10 (100.0%) | 0 (0.0%) |
| Health Diagnosing & Treating | 18 (54.5%) | 15 (45.5%) |
| Health Technologists | 8 (100.0%) | 0 (0.0%) |
| Total (Category) | 263 (41.4%) | 372 (58.6%) |
| Total (Overall) | 2,368 (60.7%) | 1,532 (39.3%) |
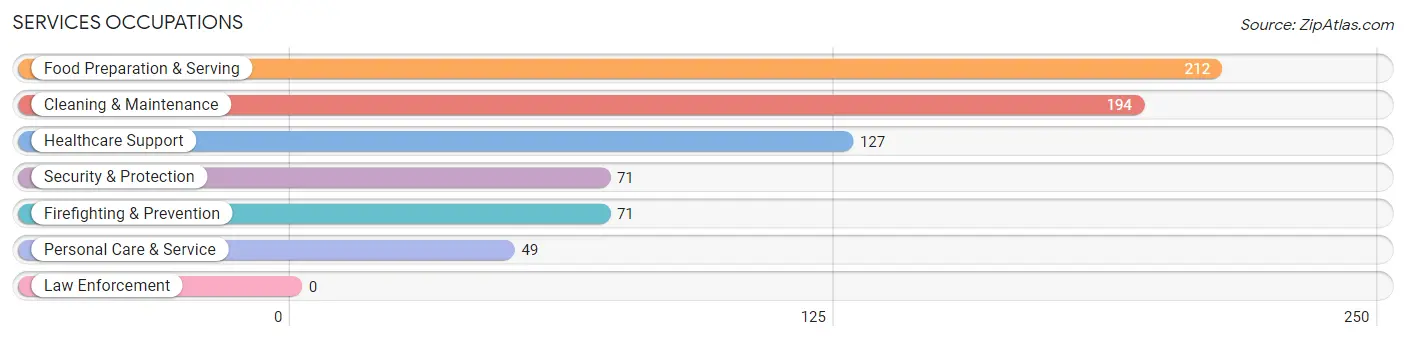
Services Occupations
The most common Services occupations in Toppenish are Food Preparation & Serving (212 | 5.4%), Cleaning & Maintenance (194 | 5.0%), Healthcare Support (127 | 3.3%), Security & Protection (71 | 1.8%), and Firefighting & Prevention (71 | 1.8%).
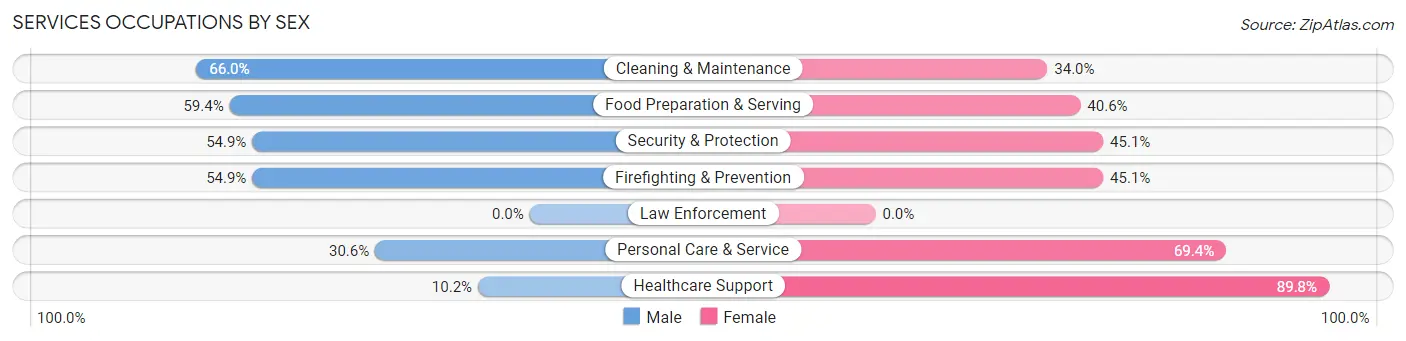
Services Occupations by Sex
Within the Services occupations in Toppenish, the most male-oriented occupations are Cleaning & Maintenance (66.0%), Food Preparation & Serving (59.4%), and Security & Protection (54.9%), while the most female-oriented occupations are Healthcare Support (89.8%), Personal Care & Service (69.4%), and Security & Protection (45.1%).
| Occupation | Male | Female |
| Healthcare Support | 13 (10.2%) | 114 (89.8%) |
| Security & Protection | 39 (54.9%) | 32 (45.1%) |
| Firefighting & Prevention | 39 (54.9%) | 32 (45.1%) |
| Law Enforcement | 0 (0.0%) | 0 (0.0%) |
| Food Preparation & Serving | 126 (59.4%) | 86 (40.6%) |
| Cleaning & Maintenance | 128 (66.0%) | 66 (34.0%) |
| Personal Care & Service | 15 (30.6%) | 34 (69.4%) |
| Total (Category) | 321 (49.2%) | 332 (50.8%) |
| Total (Overall) | 2,368 (60.7%) | 1,532 (39.3%) |
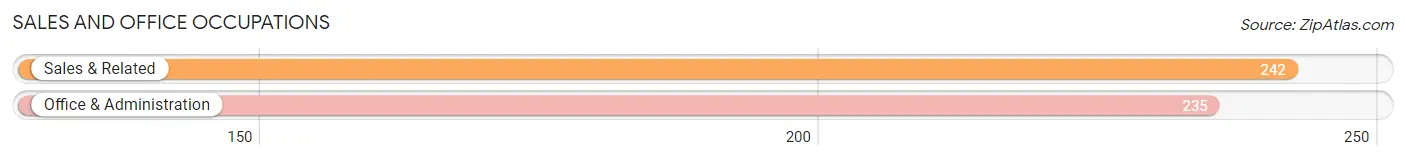
Sales and Office Occupations
The most common Sales and Office occupations in Toppenish are Sales & Related (242 | 6.2%), and Office & Administration (235 | 6.0%).
Sales and Office Occupations by Sex
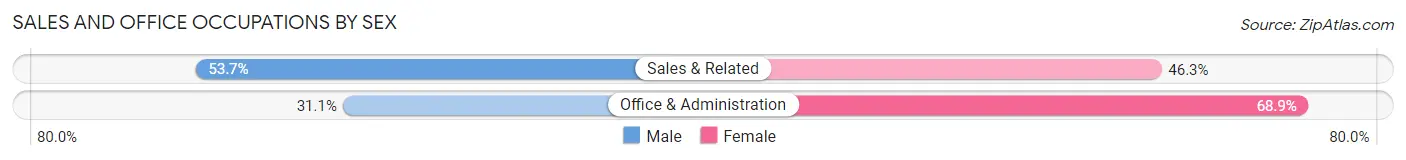
| Occupation | Male | Female |
| Sales & Related | 130 (53.7%) | 112 (46.3%) |
| Office & Administration | 73 (31.1%) | 162 (68.9%) |
| Total (Category) | 203 (42.6%) | 274 (57.4%) |
| Total (Overall) | 2,368 (60.7%) | 1,532 (39.3%) |
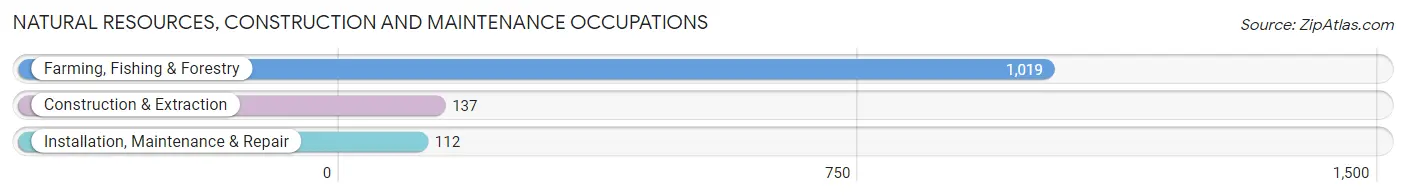
Natural Resources, Construction and Maintenance Occupations
The most common Natural Resources, Construction and Maintenance occupations in Toppenish are Farming, Fishing & Forestry (1,019 | 26.1%), Construction & Extraction (137 | 3.5%), and Installation, Maintenance & Repair (112 | 2.9%).
Natural Resources, Construction and Maintenance Occupations by Sex
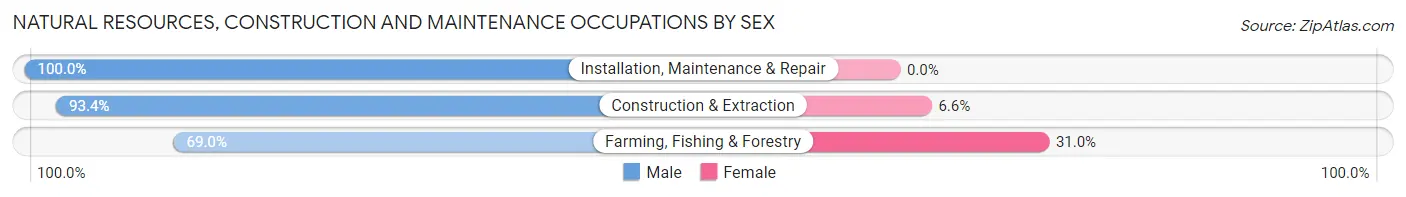
| Occupation | Male | Female |
| Farming, Fishing & Forestry | 703 (69.0%) | 316 (31.0%) |
| Construction & Extraction | 128 (93.4%) | 9 (6.6%) |
| Installation, Maintenance & Repair | 112 (100.0%) | 0 (0.0%) |
| Total (Category) | 943 (74.4%) | 325 (25.6%) |
| Total (Overall) | 2,368 (60.7%) | 1,532 (39.3%) |
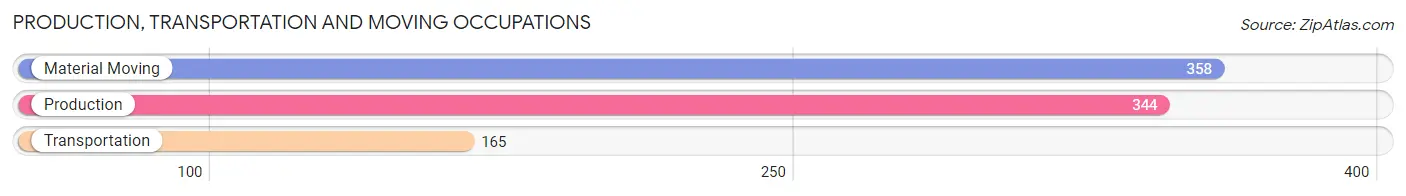
Production, Transportation and Moving Occupations
The most common Production, Transportation and Moving occupations in Toppenish are Material Moving (358 | 9.2%), Production (344 | 8.8%), and Transportation (165 | 4.2%).
Production, Transportation and Moving Occupations by Sex
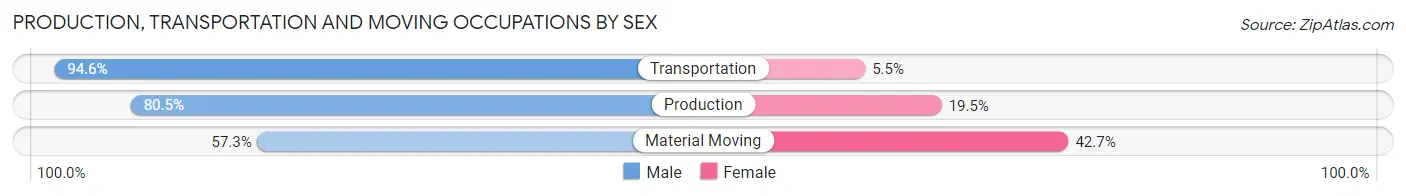
| Occupation | Male | Female |
| Production | 277 (80.5%) | 67 (19.5%) |
| Transportation | 156 (94.6%) | 9 (5.4%) |
| Material Moving | 205 (57.3%) | 153 (42.7%) |
| Total (Category) | 638 (73.6%) | 229 (26.4%) |
| Total (Overall) | 2,368 (60.7%) | 1,532 (39.3%) |
Employment Industries by Sex in Toppenish
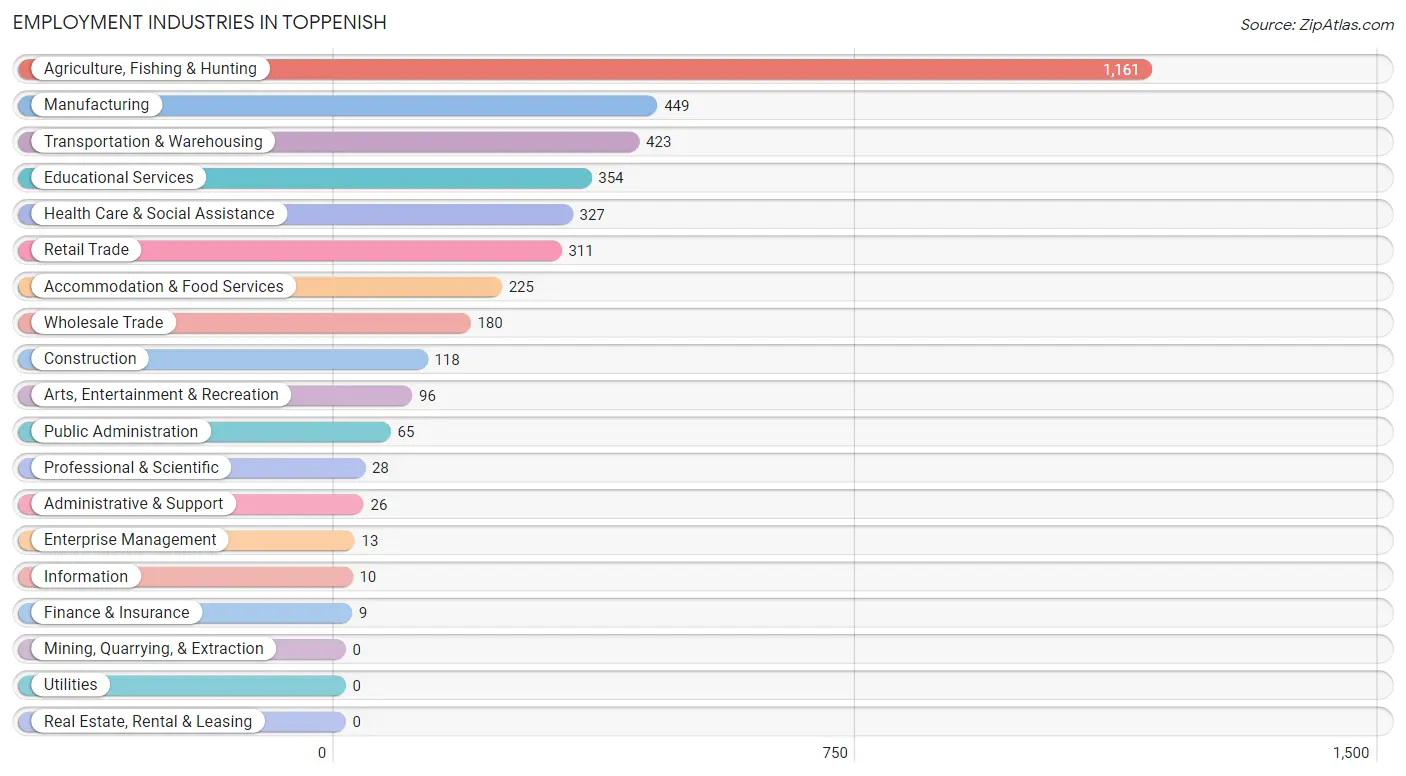
Employment Industries in Toppenish
The major employment industries in Toppenish include Agriculture, Fishing & Hunting (1,161 | 29.8%), Manufacturing (449 | 11.5%), Transportation & Warehousing (423 | 10.8%), Educational Services (354 | 9.1%), and Health Care & Social Assistance (327 | 8.4%).
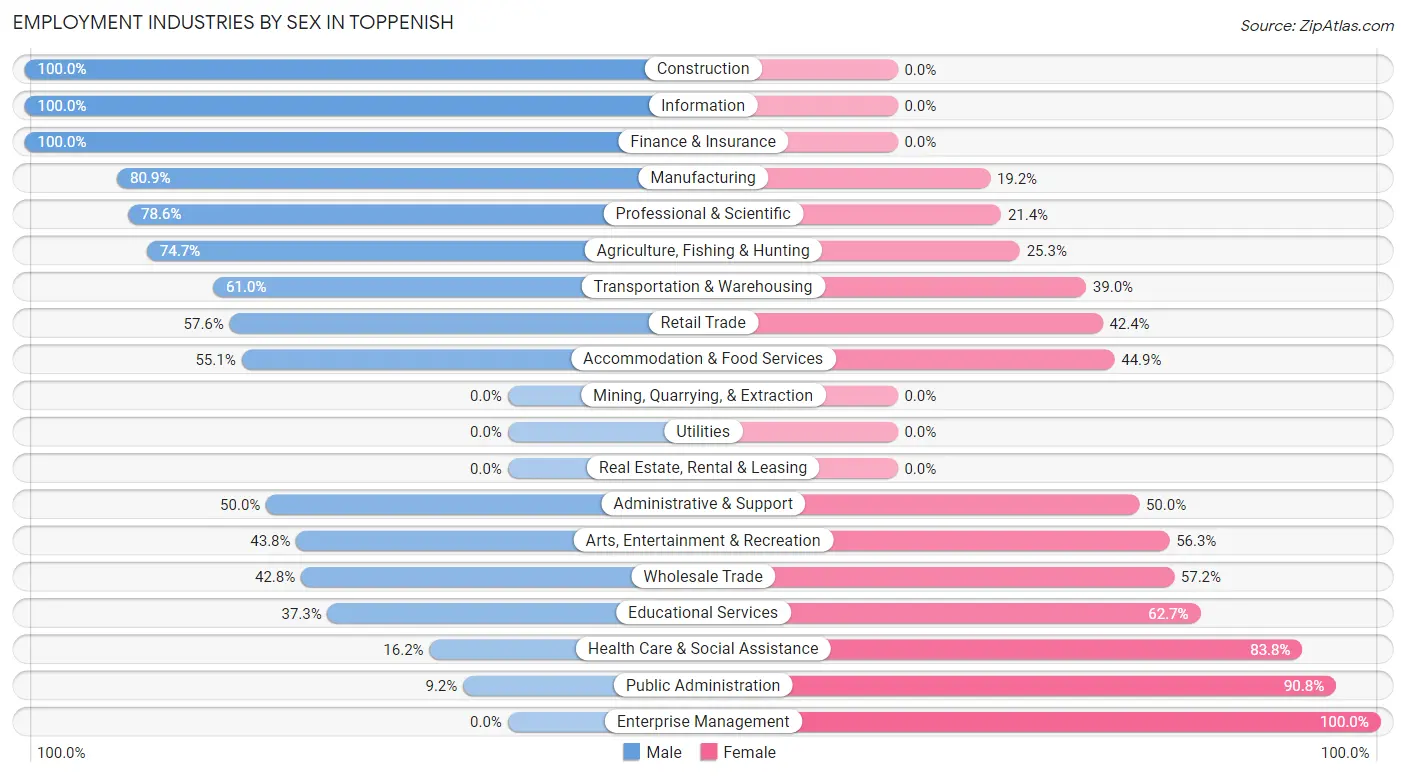
Employment Industries by Sex in Toppenish
The Toppenish industries that see more men than women are Construction (100.0%), Information (100.0%), and Finance & Insurance (100.0%), whereas the industries that tend to have a higher number of women are Enterprise Management (100.0%), Public Administration (90.8%), and Health Care & Social Assistance (83.8%).
| Industry | Male | Female |
| Agriculture, Fishing & Hunting | 867 (74.7%) | 294 (25.3%) |
| Mining, Quarrying, & Extraction | 0 (0.0%) | 0 (0.0%) |
| Construction | 118 (100.0%) | 0 (0.0%) |
| Manufacturing | 363 (80.8%) | 86 (19.2%) |
| Wholesale Trade | 77 (42.8%) | 103 (57.2%) |
| Retail Trade | 179 (57.6%) | 132 (42.4%) |
| Transportation & Warehousing | 258 (61.0%) | 165 (39.0%) |
| Utilities | 0 (0.0%) | 0 (0.0%) |
| Information | 10 (100.0%) | 0 (0.0%) |
| Finance & Insurance | 9 (100.0%) | 0 (0.0%) |
| Real Estate, Rental & Leasing | 0 (0.0%) | 0 (0.0%) |
| Professional & Scientific | 22 (78.6%) | 6 (21.4%) |
| Enterprise Management | 0 (0.0%) | 13 (100.0%) |
| Administrative & Support | 13 (50.0%) | 13 (50.0%) |
| Educational Services | 132 (37.3%) | 222 (62.7%) |
| Health Care & Social Assistance | 53 (16.2%) | 274 (83.8%) |
| Arts, Entertainment & Recreation | 42 (43.8%) | 54 (56.2%) |
| Accommodation & Food Services | 124 (55.1%) | 101 (44.9%) |
| Public Administration | 6 (9.2%) | 59 (90.8%) |
| Total | 2,368 (60.7%) | 1,532 (39.3%) |
Education in Toppenish
School Enrollment in Toppenish
The most common levels of schooling among the 2,496 students in Toppenish are high school (708 | 28.4%), elementary school (529 | 21.2%), and middle school (500 | 20.0%).
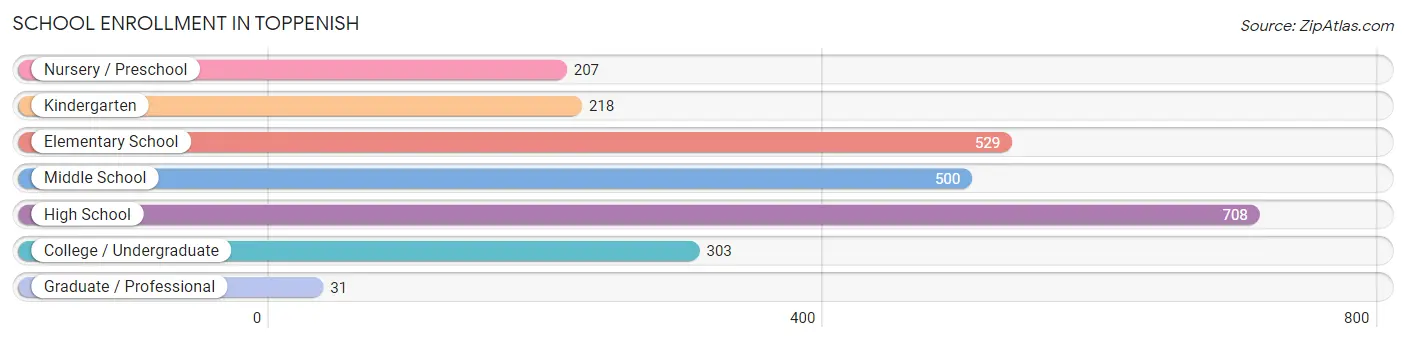
| School Level | # Students | % Students |
| Nursery / Preschool | 207 | 8.3% |
| Kindergarten | 218 | 8.7% |
| Elementary School | 529 | 21.2% |
| Middle School | 500 | 20.0% |
| High School | 708 | 28.4% |
| College / Undergraduate | 303 | 12.1% |
| Graduate / Professional | 31 | 1.2% |
| Total | 2,496 | 100.0% |
School Enrollment by Age by Funding Source in Toppenish
Out of a total of 2,496 students who are enrolled in schools in Toppenish, 215 (8.6%) attend a private institution, while the remaining 2,281 (91.4%) are enrolled in public schools. The age group of 35 years and over has the highest likelihood of being enrolled in private schools, with 15 (39.5% in the age bracket) enrolled. Conversely, the age group of 10 to 14 year olds has the lowest likelihood of being enrolled in a private school, with 584 (97.8% in the age bracket) attending a public institution.
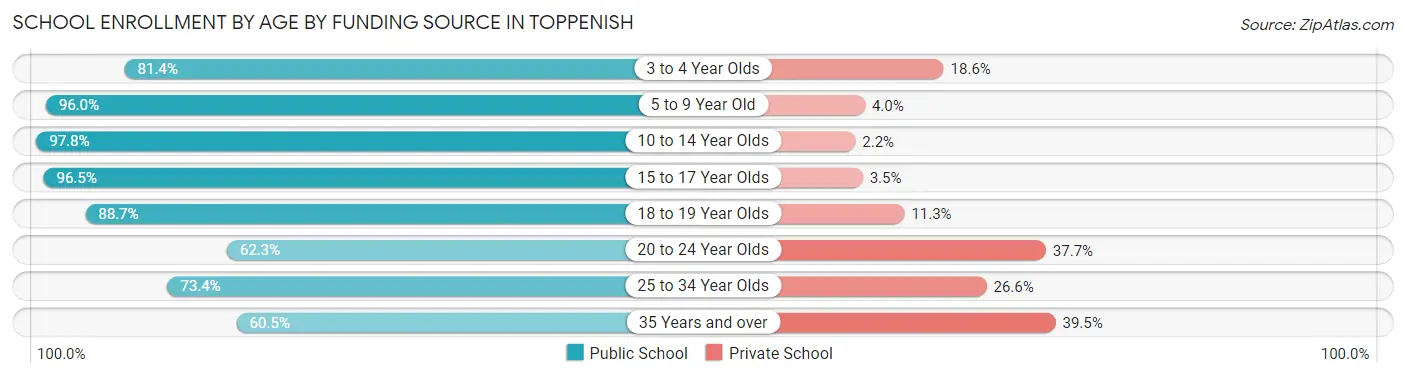
| Age Bracket | Public School | Private School |
| 3 to 4 Year Olds | 118 (81.4%) | 27 (18.6%) |
| 5 to 9 Year Old | 751 (96.0%) | 31 (4.0%) |
| 10 to 14 Year Olds | 584 (97.8%) | 13 (2.2%) |
| 15 to 17 Year Olds | 436 (96.5%) | 16 (3.5%) |
| 18 to 19 Year Olds | 188 (88.7%) | 24 (11.3%) |
| 20 to 24 Year Olds | 91 (62.3%) | 55 (37.7%) |
| 25 to 34 Year Olds | 91 (73.4%) | 33 (26.6%) |
| 35 Years and over | 23 (60.5%) | 15 (39.5%) |
| Total | 2,281 (91.4%) | 215 (8.6%) |
Educational Attainment by Field of Study in Toppenish
Education (136 | 31.3%), psychology (50 | 11.5%), arts & humanities (50 | 11.5%), computers & mathematics (32 | 7.4%), and liberal arts & history (27 | 6.2%) are the most common fields of study among 434 individuals in Toppenish who have obtained a bachelor's degree or higher.
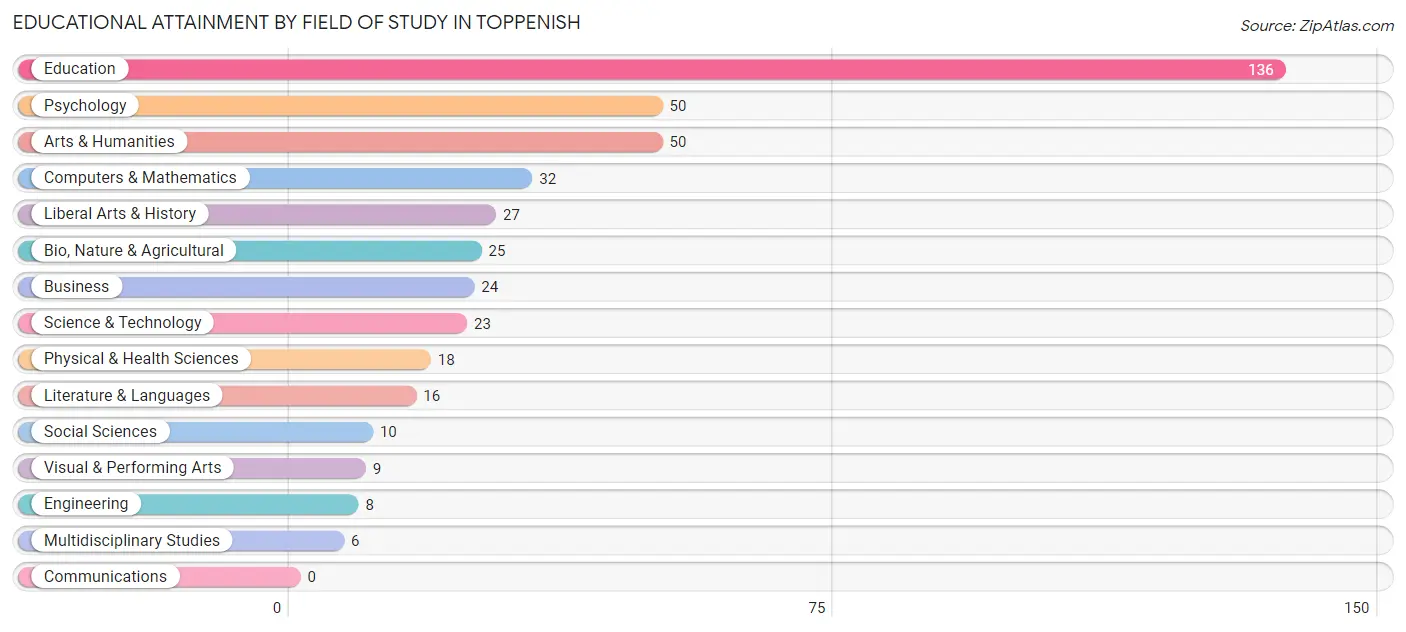
| Field of Study | # Graduates | % Graduates |
| Computers & Mathematics | 32 | 7.4% |
| Bio, Nature & Agricultural | 25 | 5.8% |
| Physical & Health Sciences | 18 | 4.2% |
| Psychology | 50 | 11.5% |
| Social Sciences | 10 | 2.3% |
| Engineering | 8 | 1.8% |
| Multidisciplinary Studies | 6 | 1.4% |
| Science & Technology | 23 | 5.3% |
| Business | 24 | 5.5% |
| Education | 136 | 31.3% |
| Literature & Languages | 16 | 3.7% |
| Liberal Arts & History | 27 | 6.2% |
| Visual & Performing Arts | 9 | 2.1% |
| Communications | 0 | 0.0% |
| Arts & Humanities | 50 | 11.5% |
| Total | 434 | 100.0% |
Transportation & Commute in Toppenish
Vehicle Availability by Sex in Toppenish
The most prevalent vehicle ownership categories in Toppenish are males with 3 vehicles (733, accounting for 31.4%) and females with 3 vehicles (445, making up 49.9%).
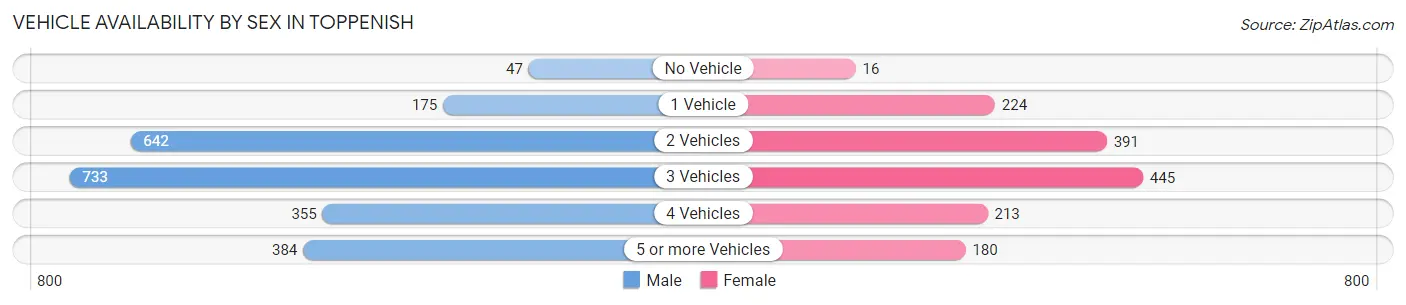
| Vehicles Available | Male | Female |
| No Vehicle | 47 (2.0%) | 16 (1.1%) |
| 1 Vehicle | 175 (7.5%) | 224 (15.2%) |
| 2 Vehicles | 642 (27.5%) | 391 (26.6%) |
| 3 Vehicles | 733 (31.4%) | 445 (30.3%) |
| 4 Vehicles | 355 (15.2%) | 213 (14.5%) |
| 5 or more Vehicles | 384 (16.4%) | 180 (12.2%) |
| Total | 2,336 (100.0%) | 1,469 (100.0%) |
Commute Time in Toppenish
The most frequently occuring commute durations in Toppenish are 5 to 9 minutes (709 commuters, 19.2%), 10 to 14 minutes (615 commuters, 16.7%), and 30 to 34 minutes (565 commuters, 15.3%).
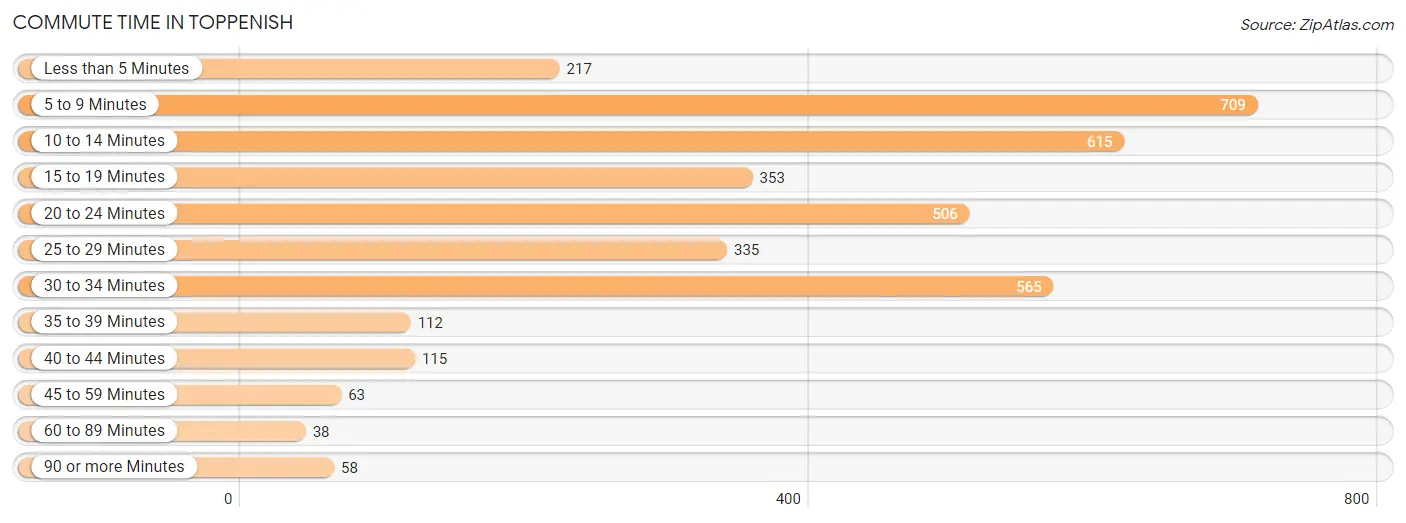
| Commute Time | # Commuters | % Commuters |
| Less than 5 Minutes | 217 | 5.9% |
| 5 to 9 Minutes | 709 | 19.2% |
| 10 to 14 Minutes | 615 | 16.7% |
| 15 to 19 Minutes | 353 | 9.6% |
| 20 to 24 Minutes | 506 | 13.7% |
| 25 to 29 Minutes | 335 | 9.1% |
| 30 to 34 Minutes | 565 | 15.3% |
| 35 to 39 Minutes | 112 | 3.0% |
| 40 to 44 Minutes | 115 | 3.1% |
| 45 to 59 Minutes | 63 | 1.7% |
| 60 to 89 Minutes | 38 | 1.0% |
| 90 or more Minutes | 58 | 1.6% |
Commute Time by Sex in Toppenish
The most common commute times in Toppenish are 10 to 14 minutes (428 commuters, 18.6%) for males and 5 to 9 minutes (334 commuters, 24.0%) for females.
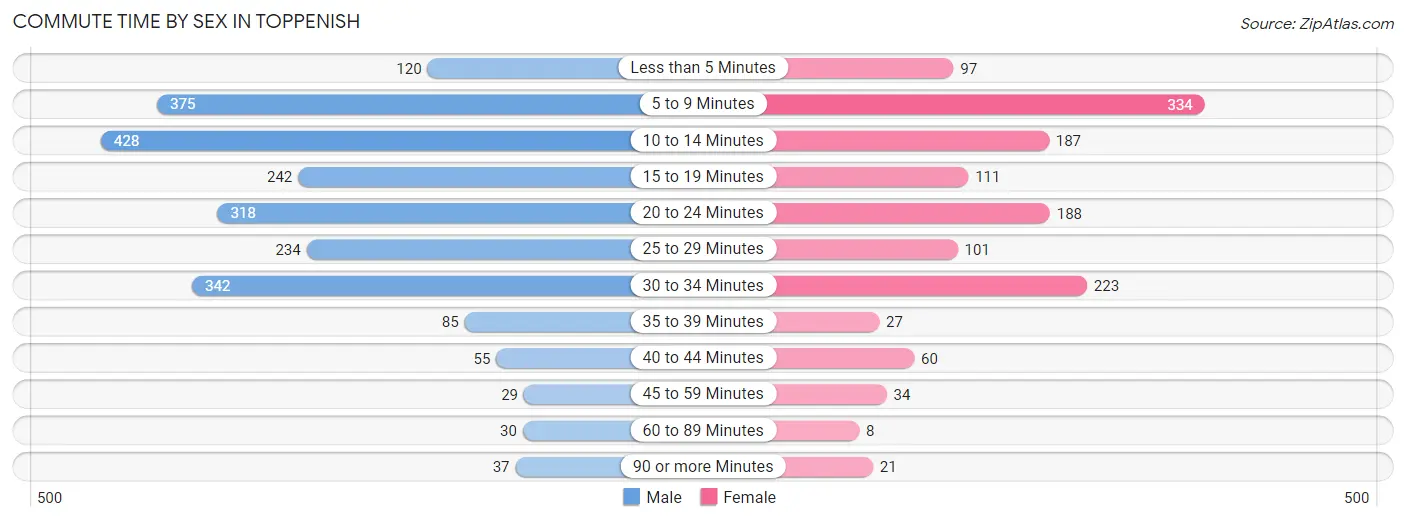
| Commute Time | Male | Female |
| Less than 5 Minutes | 120 (5.2%) | 97 (7.0%) |
| 5 to 9 Minutes | 375 (16.3%) | 334 (24.0%) |
| 10 to 14 Minutes | 428 (18.6%) | 187 (13.4%) |
| 15 to 19 Minutes | 242 (10.5%) | 111 (8.0%) |
| 20 to 24 Minutes | 318 (13.9%) | 188 (13.5%) |
| 25 to 29 Minutes | 234 (10.2%) | 101 (7.3%) |
| 30 to 34 Minutes | 342 (14.9%) | 223 (16.0%) |
| 35 to 39 Minutes | 85 (3.7%) | 27 (1.9%) |
| 40 to 44 Minutes | 55 (2.4%) | 60 (4.3%) |
| 45 to 59 Minutes | 29 (1.3%) | 34 (2.4%) |
| 60 to 89 Minutes | 30 (1.3%) | 8 (0.6%) |
| 90 or more Minutes | 37 (1.6%) | 21 (1.5%) |
Time of Departure to Work by Sex in Toppenish
The most frequent times of departure to work in Toppenish are 12:00 AM to 4:59 AM (371, 16.2%) for males and 6:30 AM to 6:59 AM (199, 14.3%) for females.
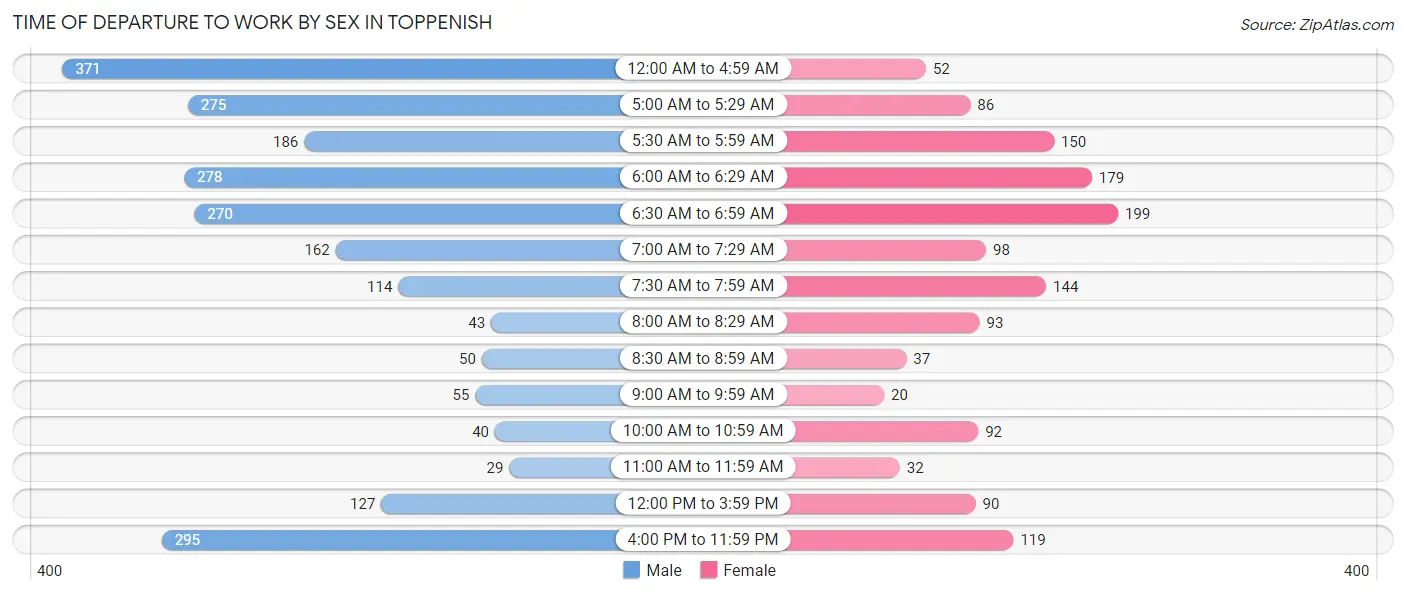
| Time of Departure | Male | Female |
| 12:00 AM to 4:59 AM | 371 (16.2%) | 52 (3.7%) |
| 5:00 AM to 5:29 AM | 275 (12.0%) | 86 (6.2%) |
| 5:30 AM to 5:59 AM | 186 (8.1%) | 150 (10.8%) |
| 6:00 AM to 6:29 AM | 278 (12.1%) | 179 (12.9%) |
| 6:30 AM to 6:59 AM | 270 (11.8%) | 199 (14.3%) |
| 7:00 AM to 7:29 AM | 162 (7.1%) | 98 (7.0%) |
| 7:30 AM to 7:59 AM | 114 (5.0%) | 144 (10.3%) |
| 8:00 AM to 8:29 AM | 43 (1.9%) | 93 (6.7%) |
| 8:30 AM to 8:59 AM | 50 (2.2%) | 37 (2.7%) |
| 9:00 AM to 9:59 AM | 55 (2.4%) | 20 (1.4%) |
| 10:00 AM to 10:59 AM | 40 (1.7%) | 92 (6.6%) |
| 11:00 AM to 11:59 AM | 29 (1.3%) | 32 (2.3%) |
| 12:00 PM to 3:59 PM | 127 (5.5%) | 90 (6.5%) |
| 4:00 PM to 11:59 PM | 295 (12.9%) | 119 (8.6%) |
| Total | 2,295 (100.0%) | 1,391 (100.0%) |
Housing Occupancy in Toppenish
Occupancy by Ownership in Toppenish
Of the total 2,415 dwellings in Toppenish, owner-occupied units account for 1,454 (60.2%), while renter-occupied units make up 961 (39.8%).
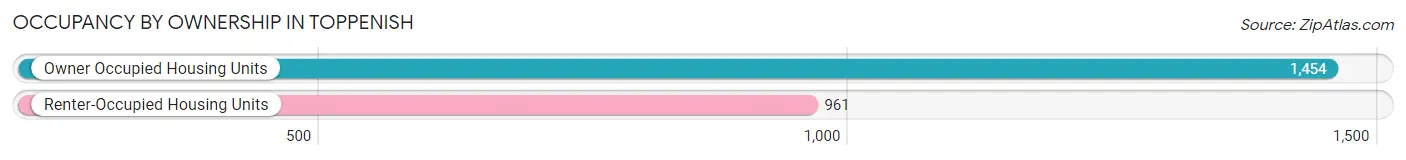
| Occupancy | # Housing Units | % Housing Units |
| Owner Occupied Housing Units | 1,454 | 60.2% |
| Renter-Occupied Housing Units | 961 | 39.8% |
| Total Occupied Housing Units | 2,415 | 100.0% |
Occupancy by Household Size in Toppenish
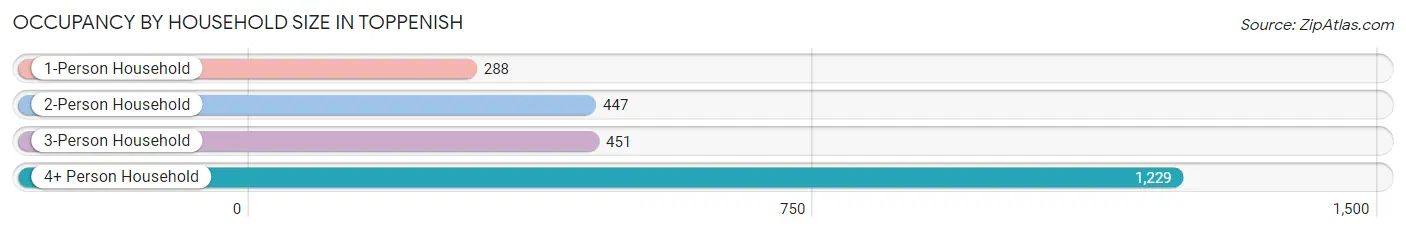
| Household Size | # Housing Units | % Housing Units |
| 1-Person Household | 288 | 11.9% |
| 2-Person Household | 447 | 18.5% |
| 3-Person Household | 451 | 18.7% |
| 4+ Person Household | 1,229 | 50.9% |
| Total Housing Units | 2,415 | 100.0% |
Occupancy by Ownership by Household Size in Toppenish
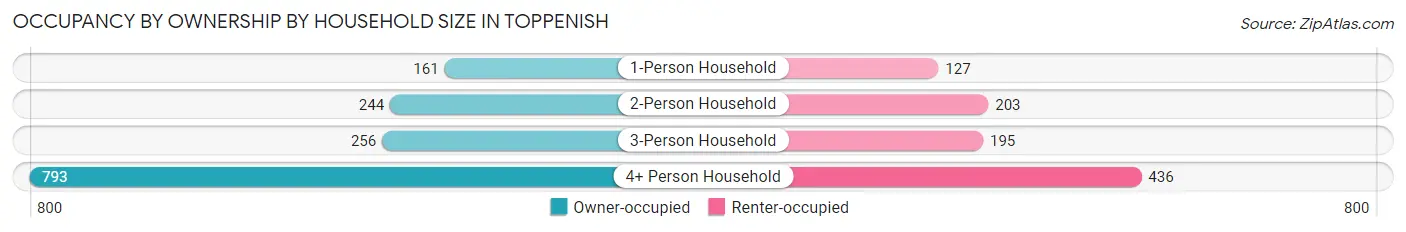
| Household Size | Owner-occupied | Renter-occupied |
| 1-Person Household | 161 (55.9%) | 127 (44.1%) |
| 2-Person Household | 244 (54.6%) | 203 (45.4%) |
| 3-Person Household | 256 (56.8%) | 195 (43.2%) |
| 4+ Person Household | 793 (64.5%) | 436 (35.5%) |
| Total Housing Units | 1,454 (60.2%) | 961 (39.8%) |
Occupancy by Educational Attainment in Toppenish
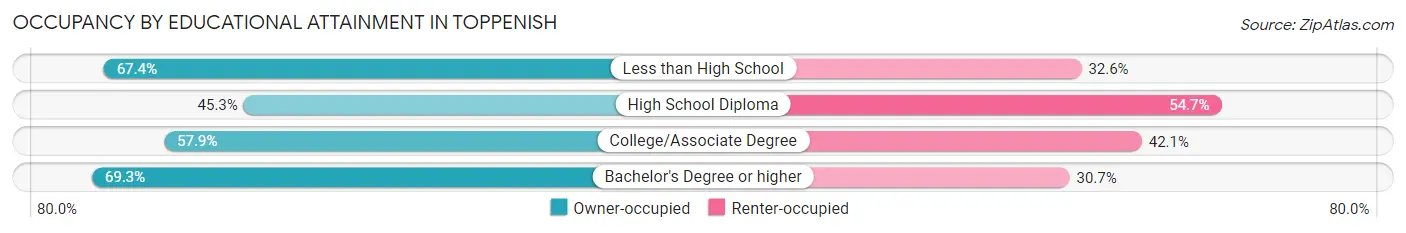
| Household Size | Owner-occupied | Renter-occupied |
| Less than High School | 760 (67.4%) | 367 (32.6%) |
| High School Diploma | 277 (45.3%) | 335 (54.7%) |
| College/Associate Degree | 261 (57.9%) | 190 (42.1%) |
| Bachelor's Degree or higher | 156 (69.3%) | 69 (30.7%) |
Occupancy by Age of Householder in Toppenish
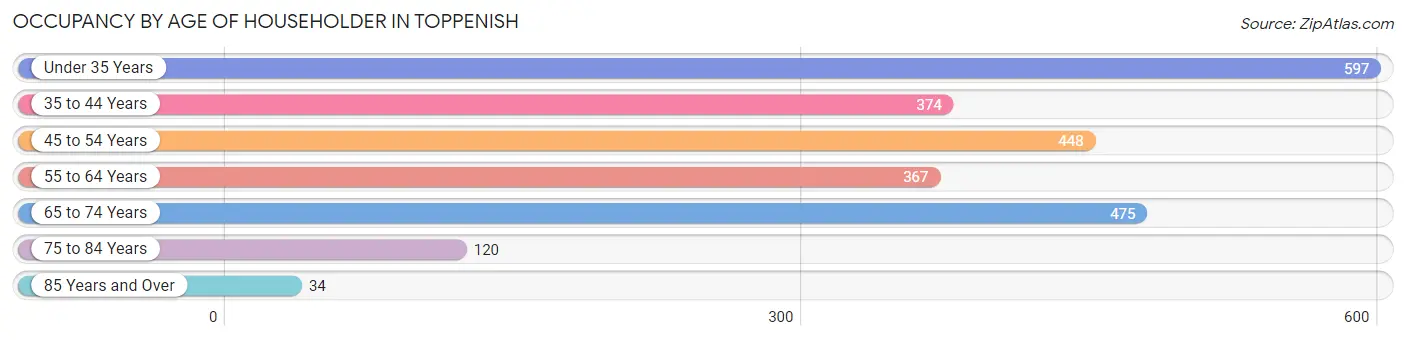
| Age Bracket | # Households | % Households |
| Under 35 Years | 597 | 24.7% |
| 35 to 44 Years | 374 | 15.5% |
| 45 to 54 Years | 448 | 18.5% |
| 55 to 64 Years | 367 | 15.2% |
| 65 to 74 Years | 475 | 19.7% |
| 75 to 84 Years | 120 | 5.0% |
| 85 Years and Over | 34 | 1.4% |
| Total | 2,415 | 100.0% |
Housing Finances in Toppenish
Median Income by Occupancy in Toppenish
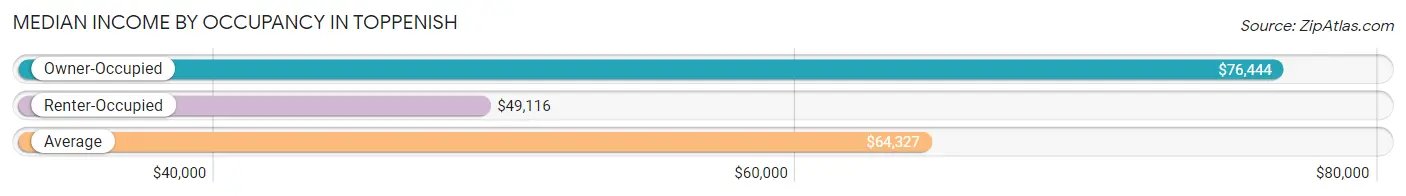
| Occupancy Type | # Households | Median Income |
| Owner-Occupied | 1,454 (60.2%) | $76,444 |
| Renter-Occupied | 961 (39.8%) | $49,116 |
| Average | 2,415 (100.0%) | $64,327 |
Occupancy by Householder Income Bracket in Toppenish
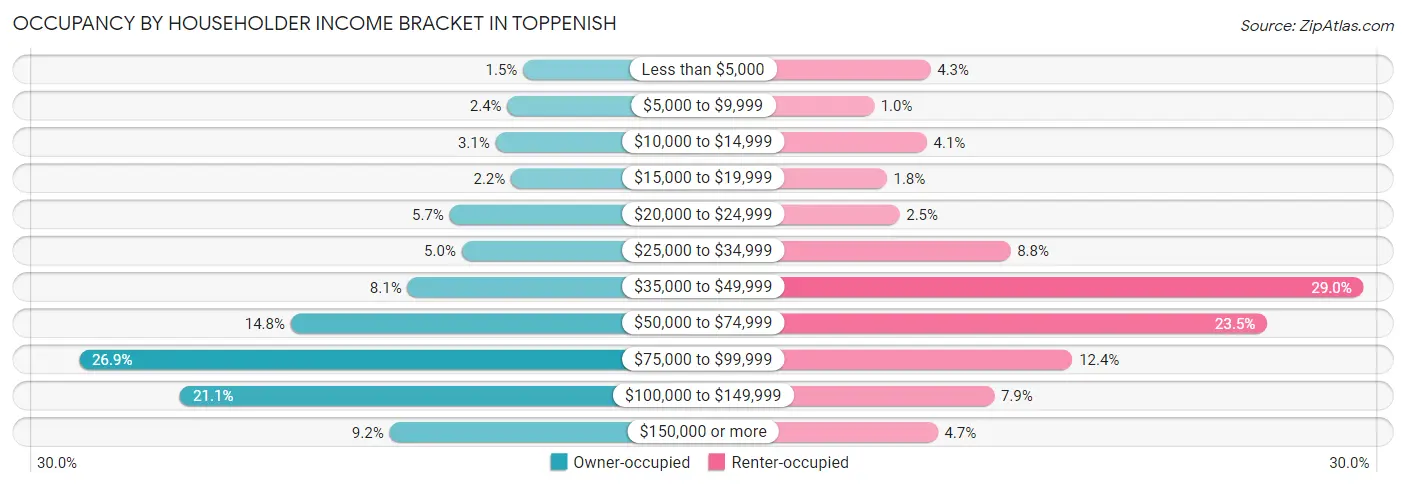
| Income Bracket | Owner-occupied | Renter-occupied |
| Less than $5,000 | 22 (1.5%) | 41 (4.3%) |
| $5,000 to $9,999 | 35 (2.4%) | 10 (1.0%) |
| $10,000 to $14,999 | 45 (3.1%) | 39 (4.1%) |
| $15,000 to $19,999 | 32 (2.2%) | 17 (1.8%) |
| $20,000 to $24,999 | 83 (5.7%) | 24 (2.5%) |
| $25,000 to $34,999 | 73 (5.0%) | 85 (8.8%) |
| $35,000 to $49,999 | 118 (8.1%) | 279 (29.0%) |
| $50,000 to $74,999 | 215 (14.8%) | 226 (23.5%) |
| $75,000 to $99,999 | 391 (26.9%) | 119 (12.4%) |
| $100,000 to $149,999 | 307 (21.1%) | 76 (7.9%) |
| $150,000 or more | 133 (9.1%) | 45 (4.7%) |
| Total | 1,454 (100.0%) | 961 (100.0%) |
Monthly Housing Cost Tiers in Toppenish
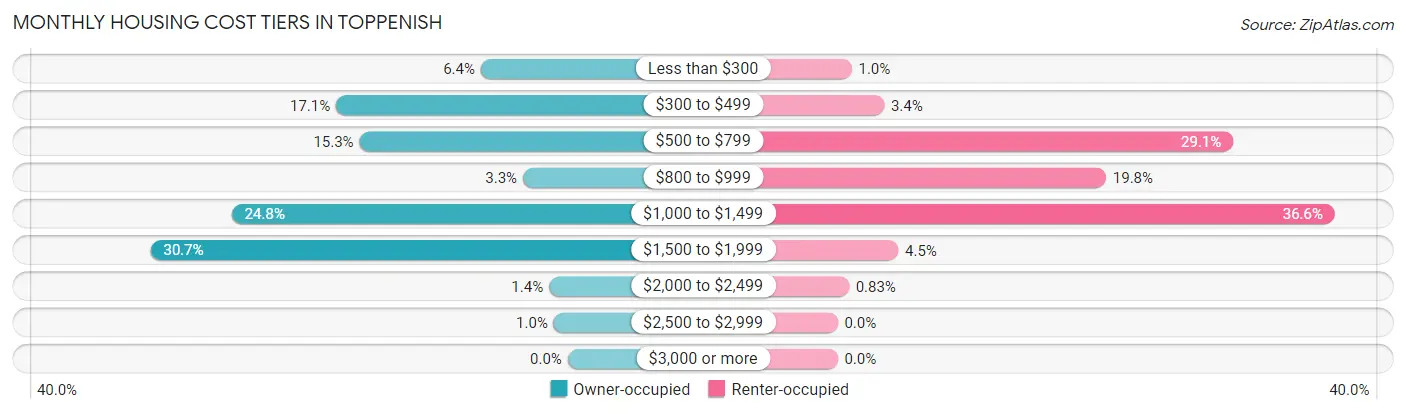
| Monthly Cost | Owner-occupied | Renter-occupied |
| Less than $300 | 93 (6.4%) | 10 (1.0%) |
| $300 to $499 | 248 (17.1%) | 33 (3.4%) |
| $500 to $799 | 223 (15.3%) | 280 (29.1%) |
| $800 to $999 | 48 (3.3%) | 190 (19.8%) |
| $1,000 to $1,499 | 360 (24.8%) | 352 (36.6%) |
| $1,500 to $1,999 | 447 (30.7%) | 43 (4.5%) |
| $2,000 to $2,499 | 20 (1.4%) | 8 (0.8%) |
| $2,500 to $2,999 | 15 (1.0%) | 0 (0.0%) |
| $3,000 or more | 0 (0.0%) | 0 (0.0%) |
| Total | 1,454 (100.0%) | 961 (100.0%) |
Physical Housing Characteristics in Toppenish
Housing Structures in Toppenish
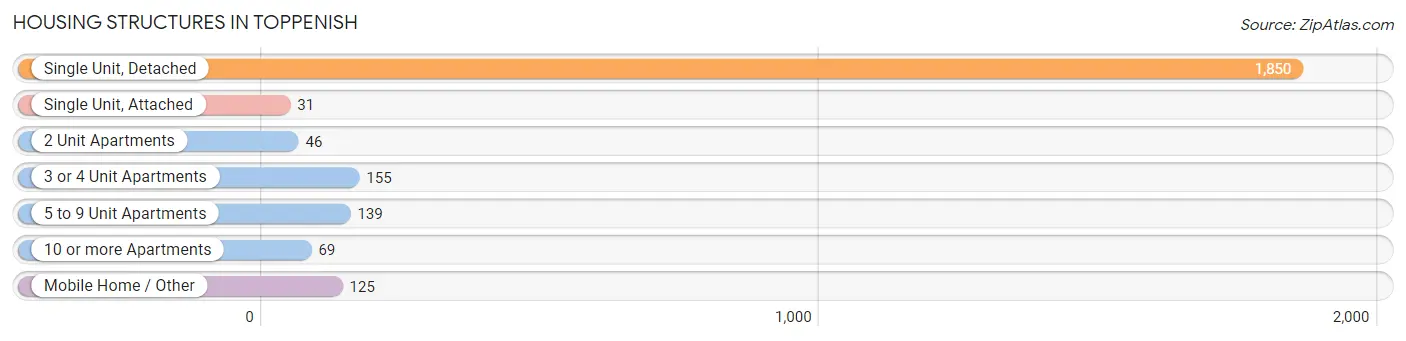
| Structure Type | # Housing Units | % Housing Units |
| Single Unit, Detached | 1,850 | 76.6% |
| Single Unit, Attached | 31 | 1.3% |
| 2 Unit Apartments | 46 | 1.9% |
| 3 or 4 Unit Apartments | 155 | 6.4% |
| 5 to 9 Unit Apartments | 139 | 5.8% |
| 10 or more Apartments | 69 | 2.9% |
| Mobile Home / Other | 125 | 5.2% |
| Total | 2,415 | 100.0% |
Housing Structures by Occupancy in Toppenish
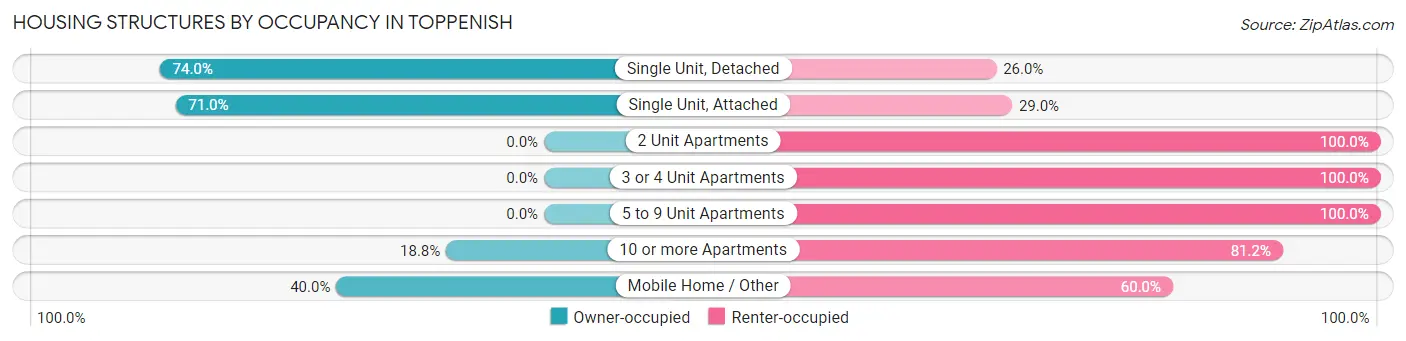
| Structure Type | Owner-occupied | Renter-occupied |
| Single Unit, Detached | 1,369 (74.0%) | 481 (26.0%) |
| Single Unit, Attached | 22 (71.0%) | 9 (29.0%) |
| 2 Unit Apartments | 0 (0.0%) | 46 (100.0%) |
| 3 or 4 Unit Apartments | 0 (0.0%) | 155 (100.0%) |
| 5 to 9 Unit Apartments | 0 (0.0%) | 139 (100.0%) |
| 10 or more Apartments | 13 (18.8%) | 56 (81.2%) |
| Mobile Home / Other | 50 (40.0%) | 75 (60.0%) |
| Total | 1,454 (60.2%) | 961 (39.8%) |
Housing Structures by Number of Rooms in Toppenish
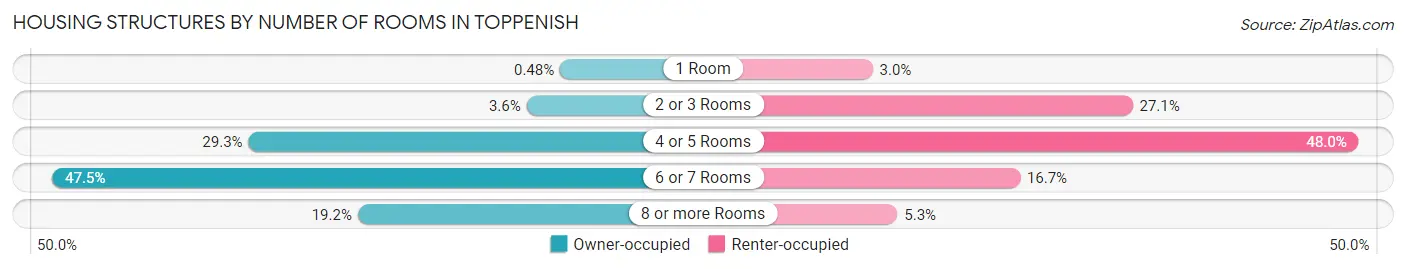
| Number of Rooms | Owner-occupied | Renter-occupied |
| 1 Room | 7 (0.5%) | 29 (3.0%) |
| 2 or 3 Rooms | 52 (3.6%) | 260 (27.1%) |
| 4 or 5 Rooms | 426 (29.3%) | 461 (48.0%) |
| 6 or 7 Rooms | 690 (47.5%) | 160 (16.7%) |
| 8 or more Rooms | 279 (19.2%) | 51 (5.3%) |
| Total | 1,454 (100.0%) | 961 (100.0%) |
Housing Structure by Heating Type in Toppenish
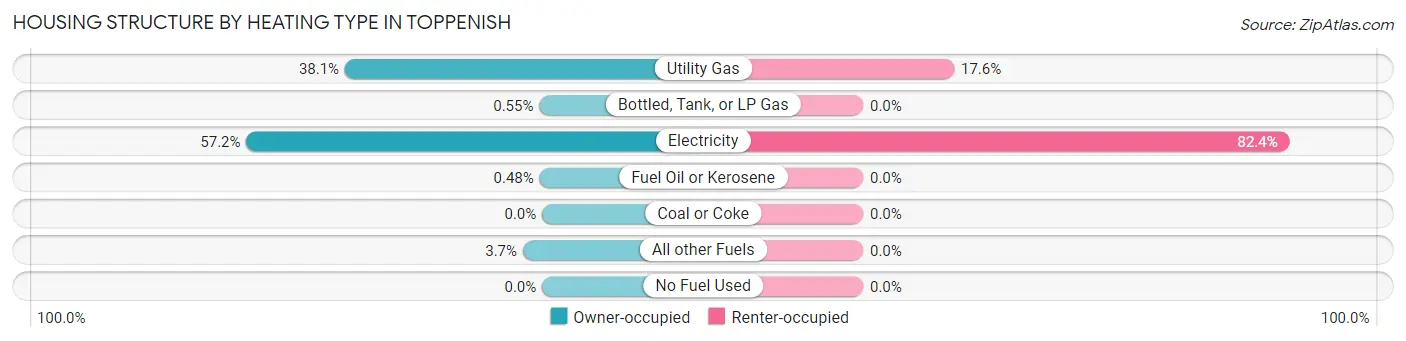
| Heating Type | Owner-occupied | Renter-occupied |
| Utility Gas | 554 (38.1%) | 169 (17.6%) |
| Bottled, Tank, or LP Gas | 8 (0.5%) | 0 (0.0%) |
| Electricity | 831 (57.2%) | 792 (82.4%) |
| Fuel Oil or Kerosene | 7 (0.5%) | 0 (0.0%) |
| Coal or Coke | 0 (0.0%) | 0 (0.0%) |
| All other Fuels | 54 (3.7%) | 0 (0.0%) |
| No Fuel Used | 0 (0.0%) | 0 (0.0%) |
| Total | 1,454 (100.0%) | 961 (100.0%) |
Household Vehicle Usage in Toppenish
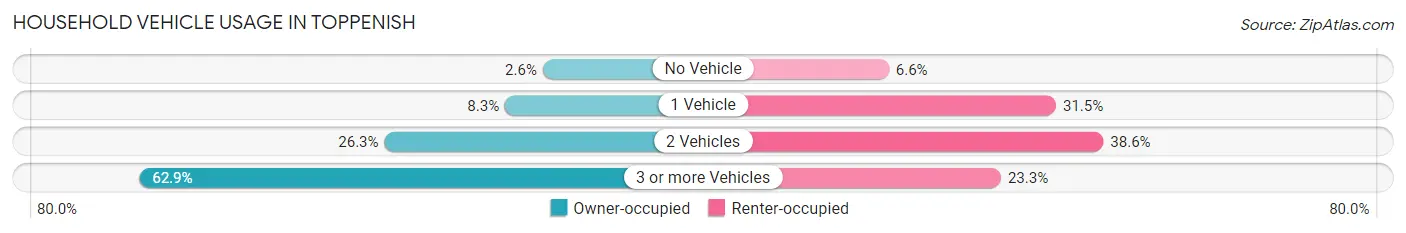
| Vehicles per Household | Owner-occupied | Renter-occupied |
| No Vehicle | 38 (2.6%) | 63 (6.6%) |
| 1 Vehicle | 120 (8.3%) | 303 (31.5%) |
| 2 Vehicles | 382 (26.3%) | 371 (38.6%) |
| 3 or more Vehicles | 914 (62.9%) | 224 (23.3%) |
| Total | 1,454 (100.0%) | 961 (100.0%) |
Real Estate & Mortgages in Toppenish
Real Estate and Mortgage Overview in Toppenish
| Characteristic | Without Mortgage | With Mortgage |
| Housing Units | 585 | 869 |
| Median Property Value | $166,600 | $209,700 |
| Median Household Income | $57,031 | $70 |
| Monthly Housing Costs | $466 | $0 |
| Real Estate Taxes | $1,447 | $10 |
Property Value by Mortgage Status in Toppenish
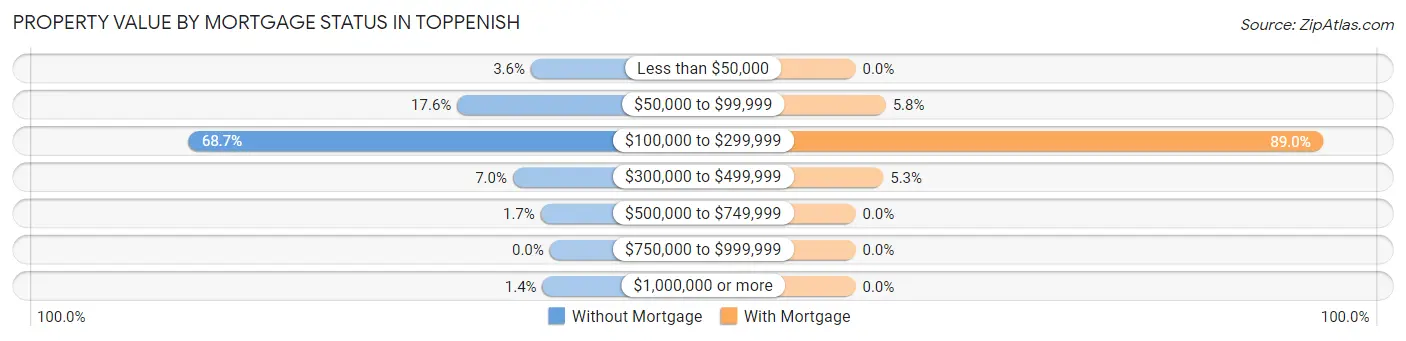
| Property Value | Without Mortgage | With Mortgage |
| Less than $50,000 | 21 (3.6%) | 0 (0.0%) |
| $50,000 to $99,999 | 103 (17.6%) | 50 (5.8%) |
| $100,000 to $299,999 | 402 (68.7%) | 773 (88.9%) |
| $300,000 to $499,999 | 41 (7.0%) | 46 (5.3%) |
| $500,000 to $749,999 | 10 (1.7%) | 0 (0.0%) |
| $750,000 to $999,999 | 0 (0.0%) | 0 (0.0%) |
| $1,000,000 or more | 8 (1.4%) | 0 (0.0%) |
| Total | 585 (100.0%) | 869 (100.0%) |
Household Income by Mortgage Status in Toppenish
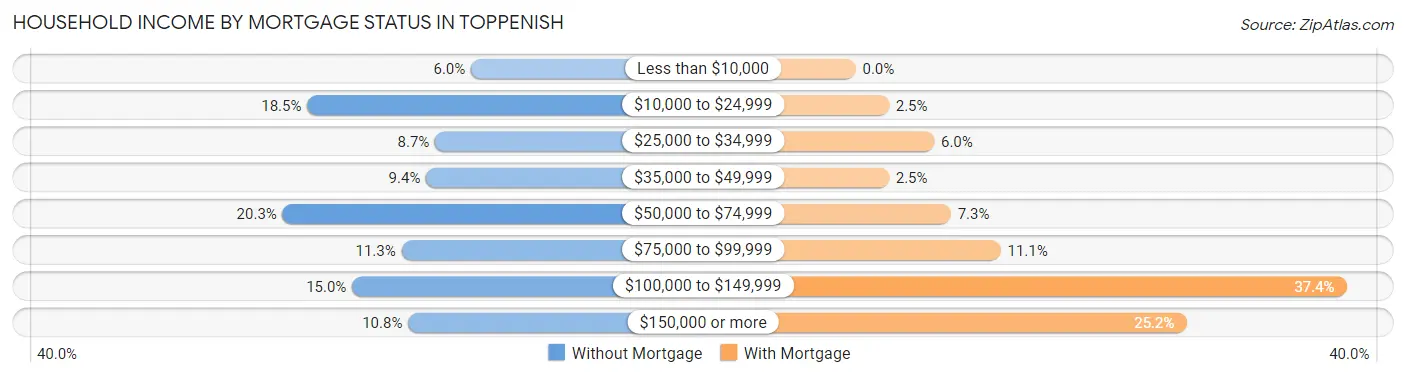
| Household Income | Without Mortgage | With Mortgage |
| Less than $10,000 | 35 (6.0%) | 0 (0.0%) |
| $10,000 to $24,999 | 108 (18.5%) | 22 (2.5%) |
| $25,000 to $34,999 | 51 (8.7%) | 52 (6.0%) |
| $35,000 to $49,999 | 55 (9.4%) | 22 (2.5%) |
| $50,000 to $74,999 | 119 (20.3%) | 63 (7.2%) |
| $75,000 to $99,999 | 66 (11.3%) | 96 (11.1%) |
| $100,000 to $149,999 | 88 (15.0%) | 325 (37.4%) |
| $150,000 or more | 63 (10.8%) | 219 (25.2%) |
| Total | 585 (100.0%) | 869 (100.0%) |
Property Value to Household Income Ratio in Toppenish
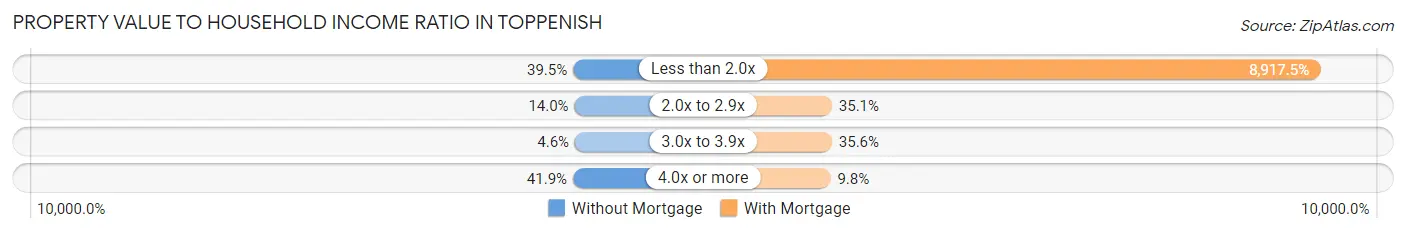
| Value-to-Income Ratio | Without Mortgage | With Mortgage |
| Less than 2.0x | 231 (39.5%) | 77,493 (8,917.5%) |
| 2.0x to 2.9x | 82 (14.0%) | 305 (35.1%) |
| 3.0x to 3.9x | 27 (4.6%) | 309 (35.6%) |
| 4.0x or more | 245 (41.9%) | 85 (9.8%) |
| Total | 585 (100.0%) | 869 (100.0%) |
Real Estate Taxes by Mortgage Status in Toppenish
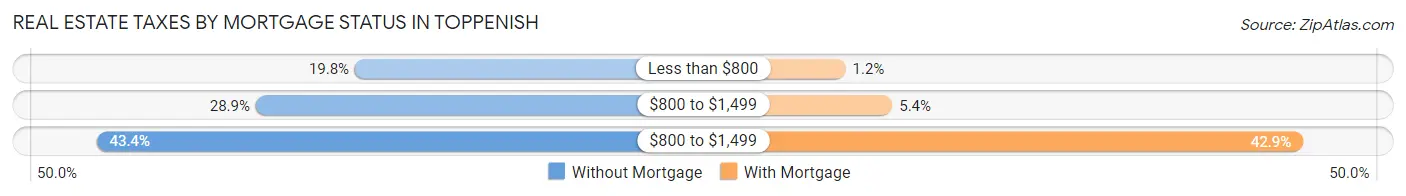
| Property Taxes | Without Mortgage | With Mortgage |
| Less than $800 | 116 (19.8%) | 10 (1.1%) |
| $800 to $1,499 | 169 (28.9%) | 47 (5.4%) |
| $800 to $1,499 | 254 (43.4%) | 373 (42.9%) |
| Total | 585 (100.0%) | 869 (100.0%) |
Health & Disability in Toppenish
Health Insurance Coverage by Age in Toppenish
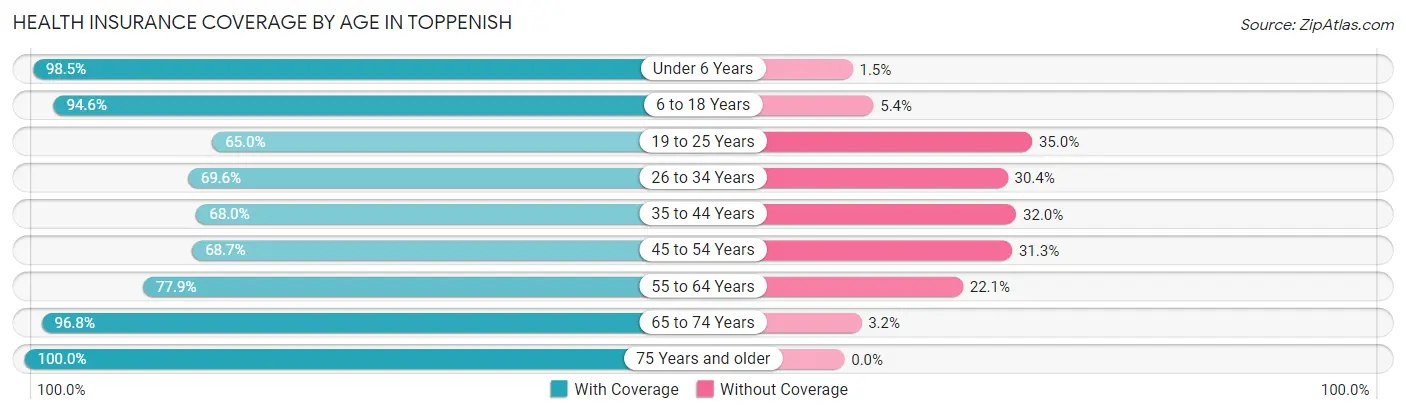
| Age Bracket | With Coverage | Without Coverage |
| Under 6 Years | 1,024 (98.5%) | 16 (1.5%) |
| 6 to 18 Years | 1,782 (94.6%) | 102 (5.4%) |
| 19 to 25 Years | 765 (65.0%) | 412 (35.0%) |
| 26 to 34 Years | 681 (69.6%) | 298 (30.4%) |
| 35 to 44 Years | 717 (68.0%) | 338 (32.0%) |
| 45 to 54 Years | 600 (68.7%) | 273 (31.3%) |
| 55 to 64 Years | 571 (77.9%) | 162 (22.1%) |
| 65 to 74 Years | 766 (96.8%) | 25 (3.2%) |
| 75 Years and older | 213 (100.0%) | 0 (0.0%) |
| Total | 7,119 (81.4%) | 1,626 (18.6%) |
Health Insurance Coverage by Citizenship Status in Toppenish
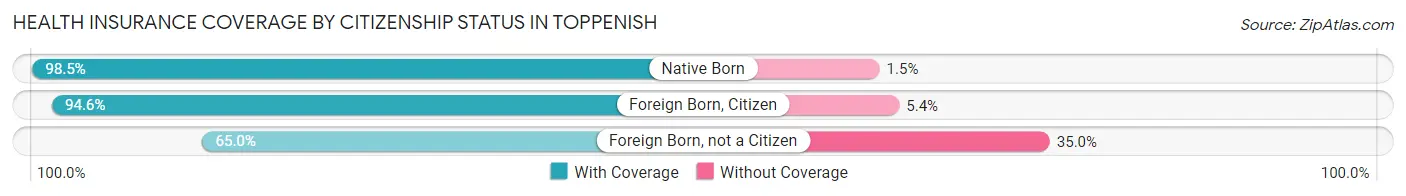
| Citizenship Status | With Coverage | Without Coverage |
| Native Born | 1,024 (98.5%) | 16 (1.5%) |
| Foreign Born, Citizen | 1,782 (94.6%) | 102 (5.4%) |
| Foreign Born, not a Citizen | 765 (65.0%) | 412 (35.0%) |
Health Insurance Coverage by Household Income in Toppenish
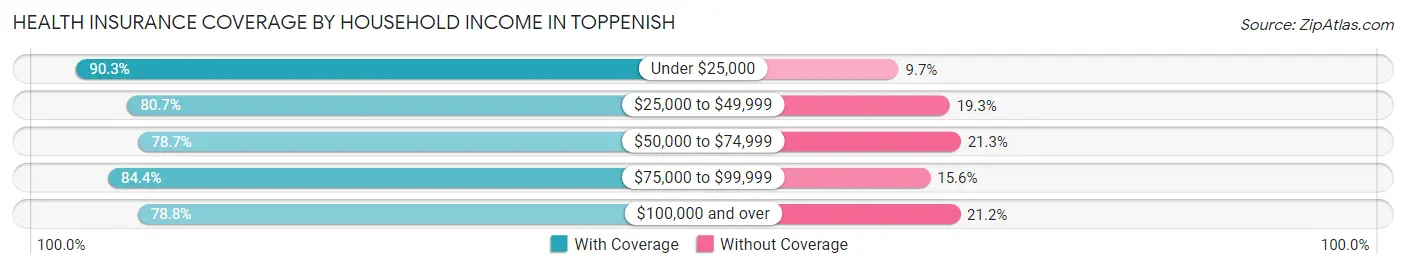
| Household Income | With Coverage | Without Coverage |
| Under $25,000 | 688 (90.3%) | 74 (9.7%) |
| $25,000 to $49,999 | 1,524 (80.7%) | 364 (19.3%) |
| $50,000 to $74,999 | 1,323 (78.7%) | 359 (21.3%) |
| $75,000 to $99,999 | 1,634 (84.4%) | 303 (15.6%) |
| $100,000 and over | 1,950 (78.8%) | 526 (21.2%) |
Public vs Private Health Insurance Coverage by Age in Toppenish
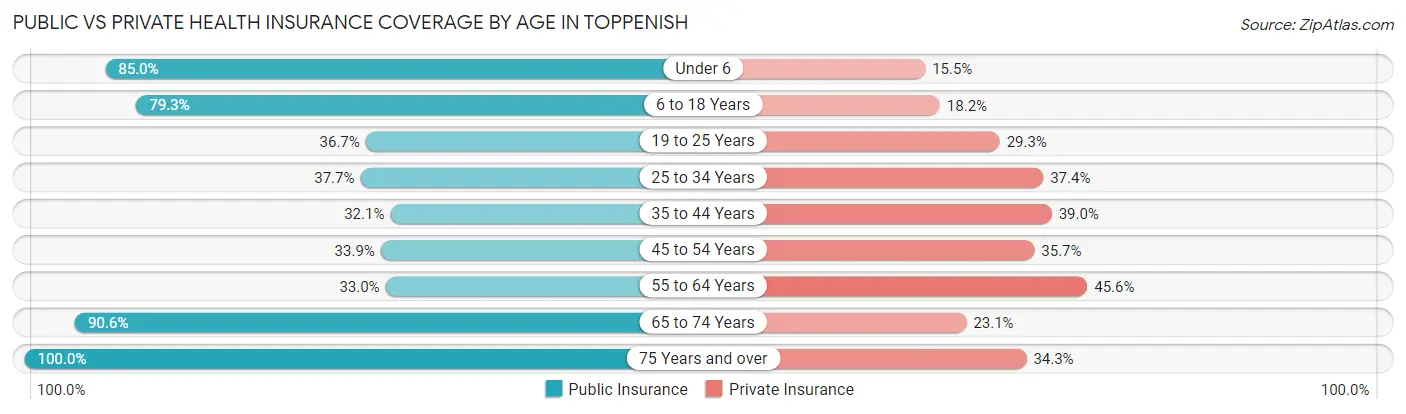
| Age Bracket | Public Insurance | Private Insurance |
| Under 6 | 884 (85.0%) | 161 (15.5%) |
| 6 to 18 Years | 1,493 (79.2%) | 343 (18.2%) |
| 19 to 25 Years | 432 (36.7%) | 345 (29.3%) |
| 25 to 34 Years | 369 (37.7%) | 366 (37.4%) |
| 35 to 44 Years | 339 (32.1%) | 411 (39.0%) |
| 45 to 54 Years | 296 (33.9%) | 312 (35.7%) |
| 55 to 64 Years | 242 (33.0%) | 334 (45.6%) |
| 65 to 74 Years | 717 (90.6%) | 183 (23.1%) |
| 75 Years and over | 213 (100.0%) | 73 (34.3%) |
| Total | 4,985 (57.0%) | 2,528 (28.9%) |
Disability Status by Sex by Age in Toppenish
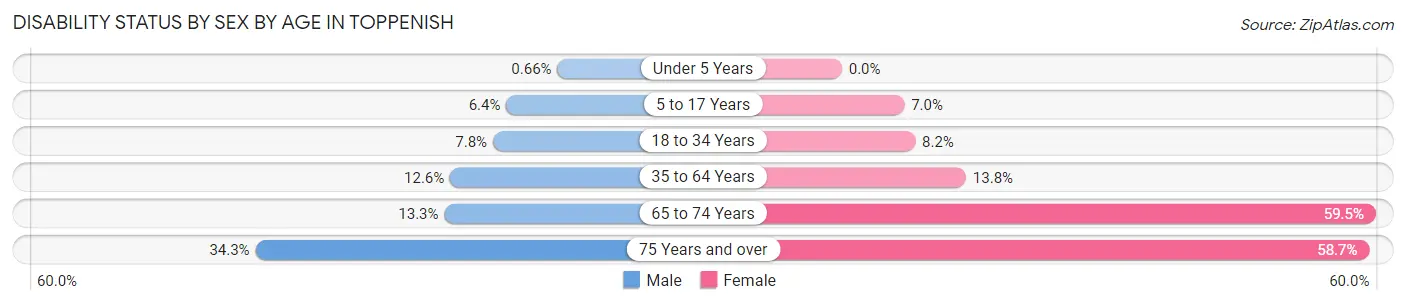
| Age Bracket | Male | Female |
| Under 5 Years | 3 (0.7%) | 0 (0.0%) |
| 5 to 17 Years | 62 (6.4%) | 67 (7.0%) |
| 18 to 34 Years | 101 (7.8%) | 84 (8.2%) |
| 35 to 64 Years | 174 (12.6%) | 177 (13.8%) |
| 65 to 74 Years | 60 (13.3%) | 201 (59.5%) |
| 75 Years and over | 24 (34.3%) | 84 (58.7%) |
Disability Class by Sex by Age in Toppenish
Disability Class: Hearing Difficulty
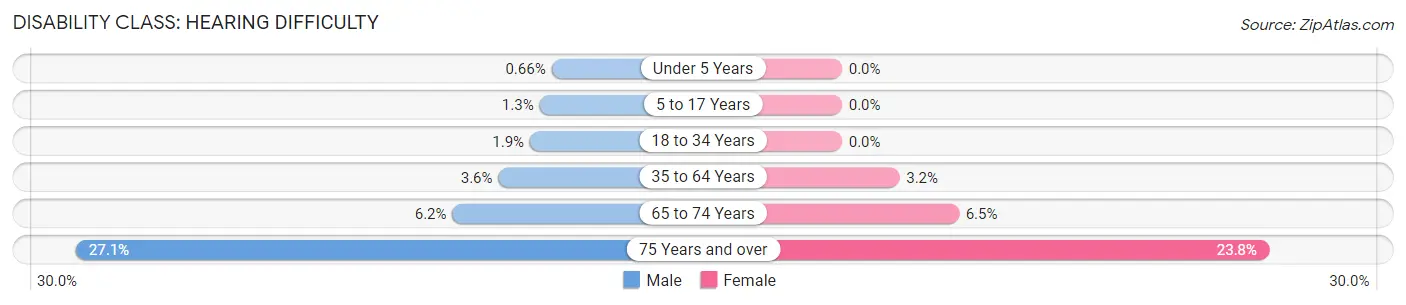
| Age Bracket | Male | Female |
| Under 5 Years | 3 (0.7%) | 0 (0.0%) |
| 5 to 17 Years | 13 (1.3%) | 0 (0.0%) |
| 18 to 34 Years | 24 (1.9%) | 0 (0.0%) |
| 35 to 64 Years | 50 (3.6%) | 41 (3.2%) |
| 65 to 74 Years | 28 (6.2%) | 22 (6.5%) |
| 75 Years and over | 19 (27.1%) | 34 (23.8%) |
Disability Class: Vision Difficulty
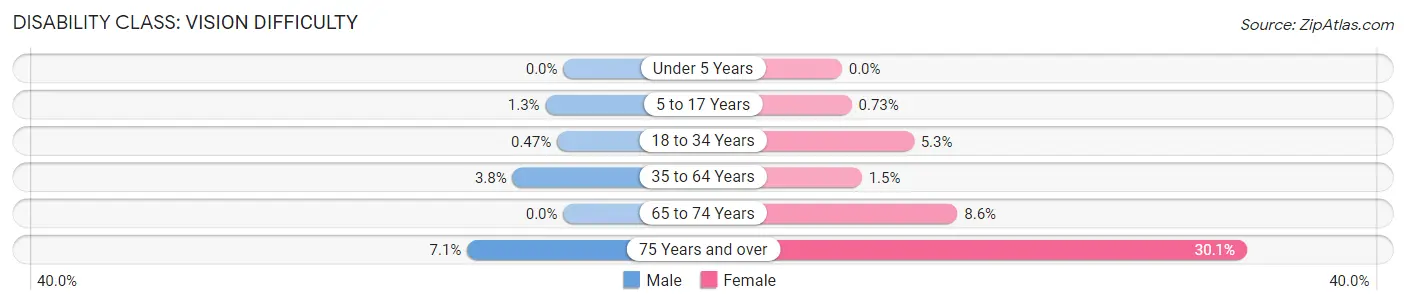
| Age Bracket | Male | Female |
| Under 5 Years | 0 (0.0%) | 0 (0.0%) |
| 5 to 17 Years | 13 (1.3%) | 7 (0.7%) |
| 18 to 34 Years | 6 (0.5%) | 55 (5.3%) |
| 35 to 64 Years | 52 (3.8%) | 19 (1.5%) |
| 65 to 74 Years | 0 (0.0%) | 29 (8.6%) |
| 75 Years and over | 5 (7.1%) | 43 (30.1%) |
Disability Class: Cognitive Difficulty
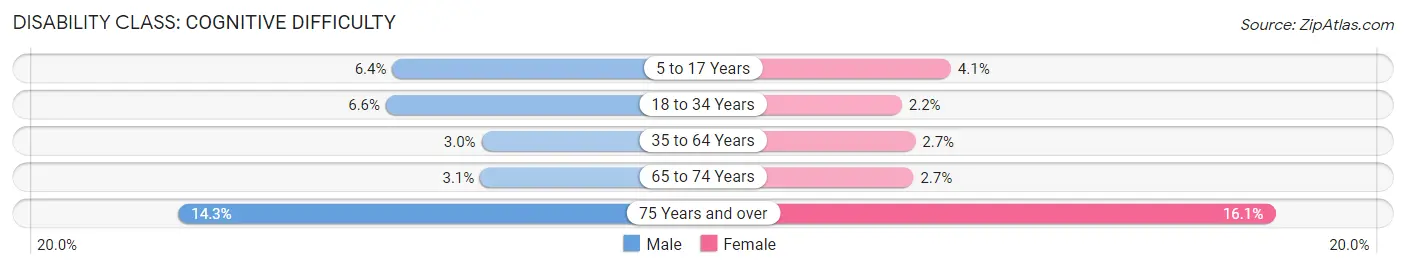
| Age Bracket | Male | Female |
| 5 to 17 Years | 62 (6.4%) | 39 (4.1%) |
| 18 to 34 Years | 85 (6.6%) | 23 (2.2%) |
| 35 to 64 Years | 42 (3.0%) | 35 (2.7%) |
| 65 to 74 Years | 14 (3.1%) | 9 (2.7%) |
| 75 Years and over | 10 (14.3%) | 23 (16.1%) |
Disability Class: Ambulatory Difficulty
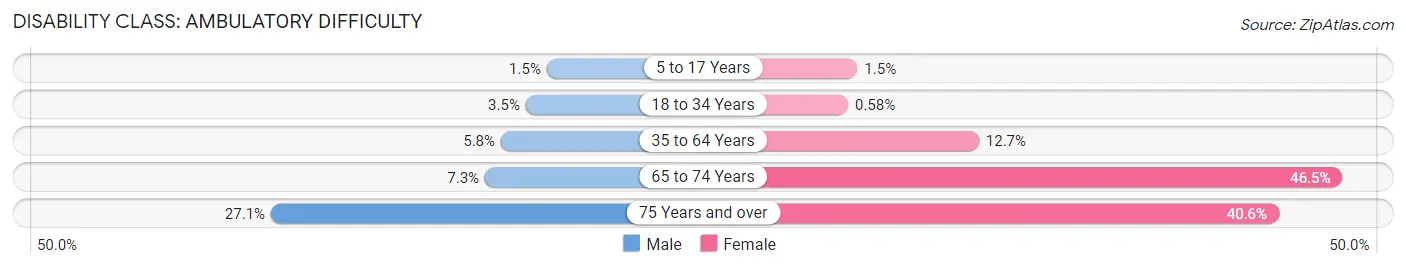
| Age Bracket | Male | Female |
| 5 to 17 Years | 15 (1.5%) | 14 (1.5%) |
| 18 to 34 Years | 45 (3.5%) | 6 (0.6%) |
| 35 to 64 Years | 80 (5.8%) | 163 (12.7%) |
| 65 to 74 Years | 33 (7.3%) | 157 (46.5%) |
| 75 Years and over | 19 (27.1%) | 58 (40.6%) |
Disability Class: Self-Care Difficulty
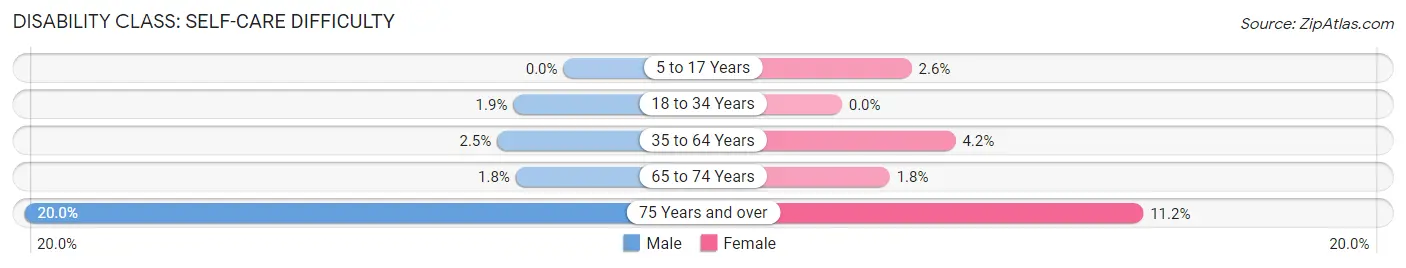
| Age Bracket | Male | Female |
| 5 to 17 Years | 0 (0.0%) | 25 (2.6%) |
| 18 to 34 Years | 24 (1.9%) | 0 (0.0%) |
| 35 to 64 Years | 34 (2.5%) | 54 (4.2%) |
| 65 to 74 Years | 8 (1.8%) | 6 (1.8%) |
| 75 Years and over | 14 (20.0%) | 16 (11.2%) |
Technology Access in Toppenish
Computing Device Access in Toppenish
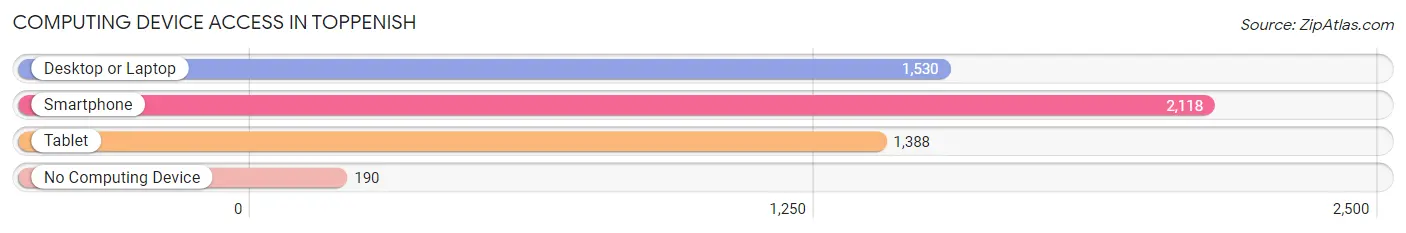
| Device Type | # Households | % Households |
| Desktop or Laptop | 1,530 | 63.3% |
| Smartphone | 2,118 | 87.7% |
| Tablet | 1,388 | 57.5% |
| No Computing Device | 190 | 7.9% |
| Total | 2,415 | 100.0% |
Internet Access in Toppenish
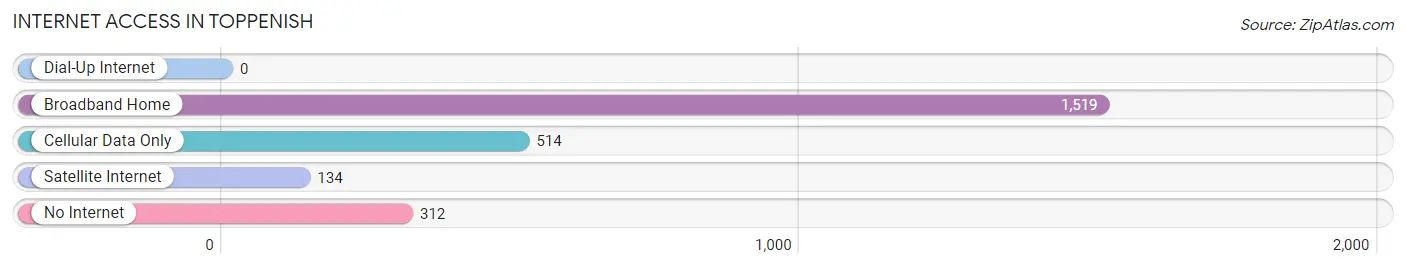
| Internet Type | # Households | % Households |
| Dial-Up Internet | 0 | 0.0% |
| Broadband Home | 1,519 | 62.9% |
| Cellular Data Only | 514 | 21.3% |
| Satellite Internet | 134 | 5.6% |
| No Internet | 312 | 12.9% |
| Total | 2,415 | 100.0% |
Toppenish Summary
Toppenish is a city located in Yakima County, Washington, United States. It is located in the Yakima Valley, approximately 60 miles southeast of Seattle. The population was 8,949 at the 2010 census.
History
The area that is now Toppenish was originally inhabited by the Yakama Native American tribe. The first non-native settlers arrived in the area in the late 1800s, and the town was officially incorporated in 1902. The name Toppenish is derived from the Yakama word for “place of many waters”.
The town was initially a farming community, and the economy was largely based on agriculture. In the early 1900s, the Northern Pacific Railway built a line through the town, which helped to spur economic growth. The town also became a center for the cattle industry, and the local economy was further bolstered by the construction of the Yakima Valley Highway in the 1920s.
Geography
Toppenish is located in the Yakima Valley, approximately 60 miles southeast of Seattle. The city is situated at the confluence of the Toppenish and Naches Rivers, and is surrounded by rolling hills and farmland. The city has a total area of 4.2 square miles, all of which is land.
Economy
The economy of Toppenish is largely based on agriculture. The city is home to a number of fruit and vegetable farms, as well as several wineries and breweries. The city is also home to a number of manufacturing companies, including a canning plant and a furniture factory.
The city is also home to a number of retail stores, restaurants, and other businesses. The city is served by the Toppenish-Yakima Airport, which provides air service to Seattle and other cities in the region.
Demographics
As of the 2010 census, there were 8,949 people, 2,845 households, and 1,945 families residing in the city. The population density was 2,133.3 people per square mile. The racial makeup of the city was 68.3% White, 0.7% African American, 1.3% Native American, 0.7% Asian, 0.1% Pacific Islander, 25.2% from other races, and 3.9% from two or more races. Hispanic or Latino of any race were 44.2% of the population.
The median income for a household in the city was $30,938, and the median income for a family was $35,938. The per capita income for the city was $14,945. About 20.2% of families and 24.2% of the population were below the poverty line, including 33.3% of those under age 18 and 11.2% of those age 65 or over.
Conclusion
Toppenish is a city located in Yakima County, Washington, United States. It is located in the Yakima Valley, approximately 60 miles southeast of Seattle. The population was 8,949 at the 2010 census. The economy of Toppenish is largely based on agriculture, and the city is home to a number of manufacturing companies, retail stores, restaurants, and other businesses. The racial makeup of the city was 68.3% White, 0.7% African American, 1.3% Native American, 0.7% Asian, 0.1% Pacific Islander, 25.2% from other races, and 3.9% from two or more races. The median income for a household in the city was $30,938, and the median income for a family was $35,938. About 20.2% of families and 24.2% of the population were below the poverty line.
Common Questions
What is Per Capita Income in Toppenish?
Per Capita income in Toppenish is $19,471.
What is the Median Family Income in Toppenish?
Median Family Income in Toppenish is $68,083.
What is the Median Household income in Toppenish?
Median Household Income in Toppenish is $64,327.
What is Income or Wage Gap in Toppenish?
Income or Wage Gap in Toppenish is 22.3%.
Women in Toppenish earn 77.7 cents for every dollar earned by a man.
What is Family Income Deficit in Toppenish?
Family Income Deficit in Toppenish is $10,824.
Families that are below poverty line in Toppenish earn $10,824 less on average than the poverty threshold level.
What is Inequality or Gini Index in Toppenish?
Inequality or Gini Index in Toppenish is 0.36.
What is the Total Population of Toppenish?
Total Population of Toppenish is 8,820.
What is the Total Male Population of Toppenish?
Total Male Population of Toppenish is 4,639.
What is the Total Female Population of Toppenish?
Total Female Population of Toppenish is 4,181.
What is the Ratio of Males per 100 Females in Toppenish?
There are 110.95 Males per 100 Females in Toppenish.
What is the Ratio of Females per 100 Males in Toppenish?
There are 90.13 Females per 100 Males in Toppenish.
What is the Median Population Age in Toppenish?
Median Population Age in Toppenish is 28.1 Years.
What is the Average Family Size in Toppenish
Average Family Size in Toppenish is 3.9 People.
What is the Average Household Size in Toppenish
Average Household Size in Toppenish is 3.6 People.
How Large is the Labor Force in Toppenish?
There are 4,245 People in the Labor Forcein in Toppenish.
What is the Percentage of People in the Labor Force in Toppenish?
66.9% of People are in the Labor Force in Toppenish.
What is the Unemployment Rate in Toppenish?
Unemployment Rate in Toppenish is 8.1%.