Cities with the Highest Percentage of Births to Unmarried Women over the Age of 35 in Tennessee

RELATED REPORTS & OPTIONS

Highest Illegitimacy | Women 35+
Population
Families and Households
Female Fertility
Female Fertility (Unmarried)
Race (Community Size)
Race (Percentage)
Ancestry (Community Size)
AfghanAfricanAlaska NativeAlaskan AthabascanAlbanianAleutAlsatianAmericanApacheArabArapahoArgentineanArmenianAssyrian / Chaldean / SyriacAustralianAustrianBahamianBangladeshiBarbadianBasqueBelgianBelizeanBermudanBhutaneseBlackfeetBolivianBrazilianBritishBritish West IndianBulgarianBurmeseCajunCambodianCanadianCape VerdeanCarpatho RusynCelticCentral AmericanCentral American IndianCherokeeCheyenneChickasawChileanChineseChippewaChoctawColombianColvilleComancheCosta RicanCreeCreekCroatianCrowCubanCypriotCzechCzechoslovakianDanishDelawareDominicanDutchDutch West IndianEastern EuropeanEcuadorianEgyptianEnglishEstonianEthiopianEuropeanFijianFilipinoFinnishFrenchFrench American IndianFrench CanadianGermanGerman RussianGhanaianGreekGuamanian / ChamorroGuatemalanGuyaneseHaitianHmongHonduranHopiHoumaHungarianIcelanderIndian (Asian)IndonesianInupiatIranianIraqiIrishIroquoisIsraeliItalianJamaicanJapaneseJordanianKenyanKiowaKoreanLaotianLatvianLebaneseLiberianLithuanianLumbeeLuxembourgerMacedonianMalaysianMalteseMarshalleseMenomineeMexicanMexican American IndianMongolianMoroccanNative HawaiianNavajoNepaleseNew ZealanderNicaraguanNigerianNorthern EuropeanNorwegianOkinawanOsageOttawaPaiutePakistaniPalestinianPanamanianParaguayanPennsylvania GermanPeruvianPimaPolishPortuguesePotawatomiPuebloPuerto RicanPuget Sound SalishRomanianRussianSalvadoranSamoanScandinavianScotch-IrishScottishSeminoleSenegaleseSerbianShoshoneSierra LeoneanSiouxSlavicSlovakSloveneSomaliSouth AfricanSouth AmericanSouth American IndianSoviet UnionSpaniardSpanishSpanish AmericanSpanish American IndianSri LankanSubsaharan AfricanSudaneseSwedishSwissSyrianTaiwaneseThaiTlingit-HaidaTohono O'OdhamTonganTrinidadian and TobagonianTsimshianTurkishU.S. Virgin IslanderUgandanUkrainianUruguayanUteVenezuelanVietnameseWelshWest IndianYakamaYaquiYugoslavianYumanYup'ikZimbabwean
Ancestry (Percentage)
AfghanAfricanAlaska NativeAlaskan AthabascanAlbanianAleutAlsatianAmericanApacheArabArapahoArgentineanArmenianAssyrian / Chaldean / SyriacAustralianAustrianBahamianBangladeshiBarbadianBasqueBelgianBelizeanBermudanBhutaneseBlackfeetBolivianBrazilianBritishBritish West IndianBulgarianBurmeseCajunCambodianCanadianCape VerdeanCarpatho RusynCelticCentral AmericanCentral American IndianCherokeeCheyenneChickasawChileanChineseChippewaChoctawColombianColvilleComancheCosta RicanCreeCreekCroatianCrowCubanCypriotCzechCzechoslovakianDanishDelawareDominicanDutchDutch West IndianEastern EuropeanEcuadorianEgyptianEnglishEstonianEthiopianEuropeanFijianFilipinoFinnishFrenchFrench American IndianFrench CanadianGermanGerman RussianGhanaianGreekGuamanian / ChamorroGuatemalanGuyaneseHaitianHmongHonduranHopiHoumaHungarianIcelanderIndian (Asian)IndonesianInupiatIranianIraqiIrishIroquoisIsraeliItalianJamaicanJapaneseJordanianKenyanKiowaKoreanLaotianLatvianLebaneseLiberianLithuanianLumbeeLuxembourgerMacedonianMalaysianMalteseMarshalleseMenomineeMexicanMexican American IndianMongolianMoroccanNative HawaiianNavajoNepaleseNew ZealanderNicaraguanNigerianNorthern EuropeanNorwegianOkinawanOsageOttawaPaiutePakistaniPalestinianPanamanianParaguayanPennsylvania GermanPeruvianPimaPolishPortuguesePotawatomiPuebloPuerto RicanPuget Sound SalishRomanianRussianSalvadoranSamoanScandinavianScotch-IrishScottishSeminoleSenegaleseSerbianShoshoneSierra LeoneanSiouxSlavicSlovakSloveneSomaliSouth AfricanSouth AmericanSouth American IndianSoviet UnionSpaniardSpanishSpanish AmericanSpanish American IndianSri LankanSubsaharan AfricanSudaneseSwedishSwissSyrianTaiwaneseThaiTlingit-HaidaTohono O'OdhamTonganTrinidadian and TobagonianTsimshianTurkishU.S. Virgin IslanderUgandanUkrainianUruguayanUteVenezuelanVietnameseWelshWest IndianYakamaYaquiYugoslavianYumanYup'ikZimbabwean
Immigrant Origin (Total)
AfghanistanAfricaAlbaniaArgentinaArmeniaAsiaAustraliaAustriaAzoresBahamasBangladeshBarbadosBelarusBelgiumBelizeBoliviaBosnia and HerzegovinaBrazilBulgariaBurma / MyanmarCabo VerdeCambodiaCameroonCanadaCaribbeanCentral AmericaChileChinaColombiaCongoCosta RicaCroatiaCubaCzechoslovakiaDenmarkDominicaDominican RepublicEastern AfricaEastern AsiaEastern EuropeEcuadorEgyptEl SalvadorEnglandEritreaEthiopiaEuropeFijiFranceGermanyGhanaGreeceGrenadaGuatemalaGuyanaHaitiHondurasHong KongHungaryIndiaIndonesiaIranIraqIrelandIsraelItalyJamaicaJapanJordanKazakhstanKenyaKoreaKuwaitLaosLatin AmericaLatviaLebanonLiberiaLithuaniaMalaysiaMexicoMicronesiaMiddle AfricaMoldovaMoroccoNepalNetherlandsNicaraguaNigeriaNorth MacedoniaNorthern AfricaNorthern EuropeNorwayOceaniaPakistanPanamaPeruPhilippinesPolandPortugalRomaniaRussiaSaudi ArabiaScotlandSenegalSerbiaSierra LeoneSingaporeSomaliaSouth AfricaSouth AmericaSouth Central AsiaSouth Eastern AsiaSouthern EuropeSpainSri LankaSt. Vincent and the GrenadinesSudanSwedenSwitzerlandSyriaTaiwanThailandTrinidad and TobagoTurkeyUgandaUkraineUruguayUzbekistanVenezuelaVietnamWest IndiesWestern AfricaWestern AsiaWestern EuropeYemenZaireZimbabwe
Immigrant Origin (Percentage)
AfghanistanAfricaAlbaniaArgentinaArmeniaAsiaAustraliaAustriaAzoresBahamasBangladeshBarbadosBelarusBelgiumBelizeBoliviaBosnia and HerzegovinaBrazilBulgariaBurma / MyanmarCabo VerdeCambodiaCameroonCanadaCaribbeanCentral AmericaChileChinaColombiaCongoCosta RicaCroatiaCubaCzechoslovakiaDenmarkDominicaDominican RepublicEastern AfricaEastern AsiaEastern EuropeEcuadorEgyptEl SalvadorEnglandEritreaEthiopiaEuropeFijiFranceGermanyGhanaGreeceGrenadaGuatemalaGuyanaHaitiHondurasHong KongHungaryIndiaIndonesiaIranIraqIrelandIsraelItalyJamaicaJapanJordanKazakhstanKenyaKoreaKuwaitLaosLatin AmericaLatviaLebanonLiberiaLithuaniaMalaysiaMexicoMicronesiaMiddle AfricaMoldovaMoroccoNepalNetherlandsNicaraguaNigeriaNorth MacedoniaNorthern AfricaNorthern EuropeNorwayOceaniaPakistanPanamaPeruPhilippinesPolandPortugalRomaniaRussiaSaudi ArabiaScotlandSenegalSerbiaSierra LeoneSingaporeSomaliaSouth AfricaSouth AmericaSouth Central AsiaSouth Eastern AsiaSouthern EuropeSpainSri LankaSt. Vincent and the GrenadinesSudanSwedenSwitzerlandSyriaTaiwanThailandTrinidad and TobagoTurkeyUgandaUkraineUruguayUzbekistanVenezuelaVietnamWest IndiesWestern AfricaWestern AsiaWestern EuropeYemenZaireZimbabwe
Income
Income (Families)
Income (Households)
Poverty
Poverty (Families)
Unemployment
Employment Occupations
Employment Industries
Employer Class
Commute Time
Commute Means
School Enrollment
Education by Degree Field
Occupancy
Finances
Physical Characteristics
Tennessee
Compare Cities
Comparison Subject

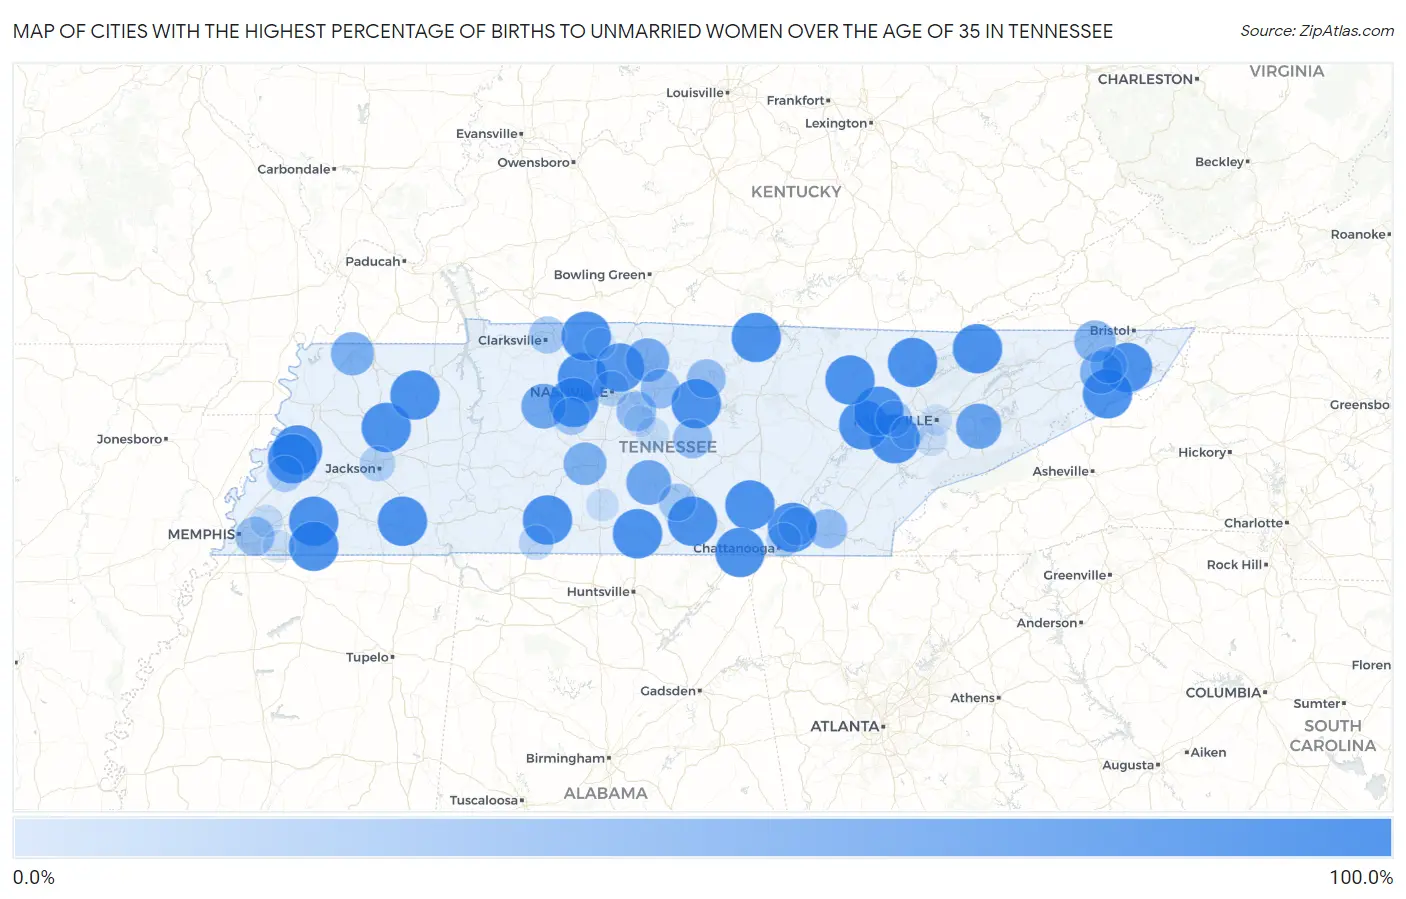
Map of Cities with the Highest Percentage of Births to Unmarried Women over the Age of 35 in Tennessee

0.0%
100.0%
Cities with the Highest Percentage of Births to Unmarried Women over the Age of 35 in Tennessee Map

Cities with the Highest Percentage of Births to Unmarried Women over the Age of 35 in Tennessee

City % Unmarried vs State vs National
1.Elizabethton100.0%23.8%(+76.2)#120.1%(+79.9)#89
2.Middle Valley100.0%23.8%(+76.2)#220.1%(+79.9)#138
3.Lawrenceburg100.0%23.8%(+76.2)#320.1%(+79.9)#140
4.Lenoir City100.0%23.8%(+76.2)#420.1%(+79.9)#178
5.Milan100.0%23.8%(+76.2)#520.1%(+79.9)#239
6.Ripley100.0%23.8%(+76.2)#620.1%(+79.9)#250
7.La Follette100.0%23.8%(+76.2)#720.1%(+79.9)#263
8.Fayetteville100.0%23.8%(+76.2)#820.1%(+79.9)#273
9.Erwin100.0%23.8%(+76.2)#920.1%(+79.9)#317
10.Harriman100.0%23.8%(+76.2)#1020.1%(+79.9)#319
11.Mckenzie100.0%23.8%(+76.2)#1120.1%(+79.9)#347
12.Ashland City100.0%23.8%(+76.2)#1220.1%(+79.9)#373
13.Somerville100.0%23.8%(+76.2)#1320.1%(+79.9)#503
14.Coalfield100.0%23.8%(+76.2)#1420.1%(+79.9)#554
15.Kingston Springs100.0%23.8%(+76.2)#1520.1%(+79.9)#572
16.Decherd100.0%23.8%(+76.2)#1620.1%(+79.9)#602
17.Tazewell100.0%23.8%(+76.2)#1720.1%(+79.9)#667
18.Celina100.0%23.8%(+76.2)#1820.1%(+79.9)#764
19.Henning100.0%23.8%(+76.2)#1920.1%(+79.9)#876
20.Alexandria100.0%23.8%(+76.2)#2020.1%(+79.9)#922
21.Bethel Springs100.0%23.8%(+76.2)#2120.1%(+79.9)#1,012
22.Palmer100.0%23.8%(+76.2)#2220.1%(+79.9)#1,021
23.Sunbright100.0%23.8%(+76.2)#2320.1%(+79.9)#1,023
24.New Hope100.0%23.8%(+76.2)#2420.1%(+79.9)#1,044
25.Moscow100.0%23.8%(+76.2)#2520.1%(+79.9)#1,050
26.Cedar Hill100.0%23.8%(+76.2)#2620.1%(+79.9)#1,284
27.Goodlettsville93.8%23.8%(+70.0)#2720.1%(+73.7)#1,462
28.Sevierville77.8%23.8%(+54.0)#2820.1%(+57.7)#1,581
29.Shelbyville75.8%23.8%(+52.0)#2920.1%(+55.7)#1,606
30.Dickson75.0%23.8%(+51.2)#3020.1%(+54.9)#1,612
31.Gallatin69.2%23.8%(+45.4)#3120.1%(+49.1)#1,687
32.Union City66.7%23.8%(+42.9)#3220.1%(+46.6)#1,722
33.Columbia65.0%23.8%(+41.2)#3320.1%(+44.9)#1,763
34.Jonesborough63.6%23.8%(+39.8)#3420.1%(+43.5)#1,801
35.Kingsport59.1%23.8%(+35.3)#3520.1%(+39.0)#1,909
36.La Vergne49.8%23.8%(+26.0)#3620.1%(+29.7)#2,165
37.Cleveland47.0%23.8%(+23.2)#3720.1%(+26.9)#2,228
38.Lebanon47.0%23.8%(+23.2)#3820.1%(+26.9)#2,229
39.Woodbury46.2%23.8%(+22.4)#3920.1%(+26.1)#2,247
40.Memphis46.0%23.8%(+22.2)#4020.1%(+25.9)#2,249
41.Carthage45.5%23.8%(+21.7)#4120.1%(+25.4)#2,272
42.Lakesite42.9%23.8%(+19.1)#4220.1%(+22.8)#2,356
43.Tullahoma37.5%23.8%(+13.7)#4320.1%(+17.4)#2,527
44.Fairview37.5%23.8%(+13.7)#4420.1%(+17.4)#2,529
45.Clarksville35.9%23.8%(+12.1)#4520.1%(+15.8)#2,585
46.Johnson City35.6%23.8%(+11.8)#4620.1%(+15.5)#2,602
47.Oak Ridge33.1%23.8%(+9.30)#4720.1%(+13.0)#2,733
48.Covington32.4%23.8%(+8.60)#4820.1%(+12.3)#2,749
49.Jackson27.3%23.8%(+3.50)#4920.1%(+7.20)#2,966
50.Nashville27.0%23.8%(+3.20)#5020.1%(+6.90)#2,981
51.Loretto23.5%23.8%(-0.300)#5120.1%(+3.40)#3,145
52.Chattanooga23.0%23.8%(-0.800)#5220.1%(+2.90)#3,165
53.Farragut18.2%23.8%(-5.60)#5320.1%(-1.90)#3,389
54.Murfreesboro14.6%23.8%(-9.20)#5420.1%(-5.50)#3,596
55.Bartlett13.7%23.8%(-10.1)#5520.1%(-6.40)#3,654
56.Cornersville13.0%23.8%(-10.8)#5620.1%(-7.10)#3,699
57.Collierville11.0%23.8%(-12.8)#5720.1%(-9.10)#3,798
58.Alcoa10.5%23.8%(-13.3)#5820.1%(-9.60)#3,818
59.Smyrna8.6%23.8%(-15.2)#5920.1%(-11.5)#3,902
60.Springfield8.3%23.8%(-15.5)#6020.1%(-11.8)#3,916
61.Knoxville7.7%23.8%(-16.1)#6120.1%(-12.4)#3,945

Common Questions

What are the Top 10 Cities with the Highest Percentage of Births to Unmarried Women over the Age of 35 in Tennessee?
Top 10 Cities with the Highest Percentage of Births to Unmarried Women over the Age of 35 in Tennessee are:
#1
100.0%
#2
100.0%
#3
100.0%
#4
100.0%
#5
100.0%
#6
100.0%
#7
100.0%
#8
100.0%
#9
100.0%
#10
100.0%
What city has the Highest Percentage of Births to Unmarried Women over the Age of 35 in Tennessee?
Elizabethton has the Highest Percentage of Births to Unmarried Women over the Age of 35 in Tennessee with 100.0%.
What is the Percentage of Births to Unmarried Women over the Age of 35 in the State of Tennessee?
Percentage of Births to Unmarried Women over the Age of 35 in Tennessee is 23.8%.
What is the Percentage of Births to Unmarried Women over the Age of 35 in the United States?
Percentage of Births to Unmarried Women over the Age of 35 in the United States is 20.1%.